#Prime_indicator settings:
Max percentage difference: 1 %
Last x amount of days: 578
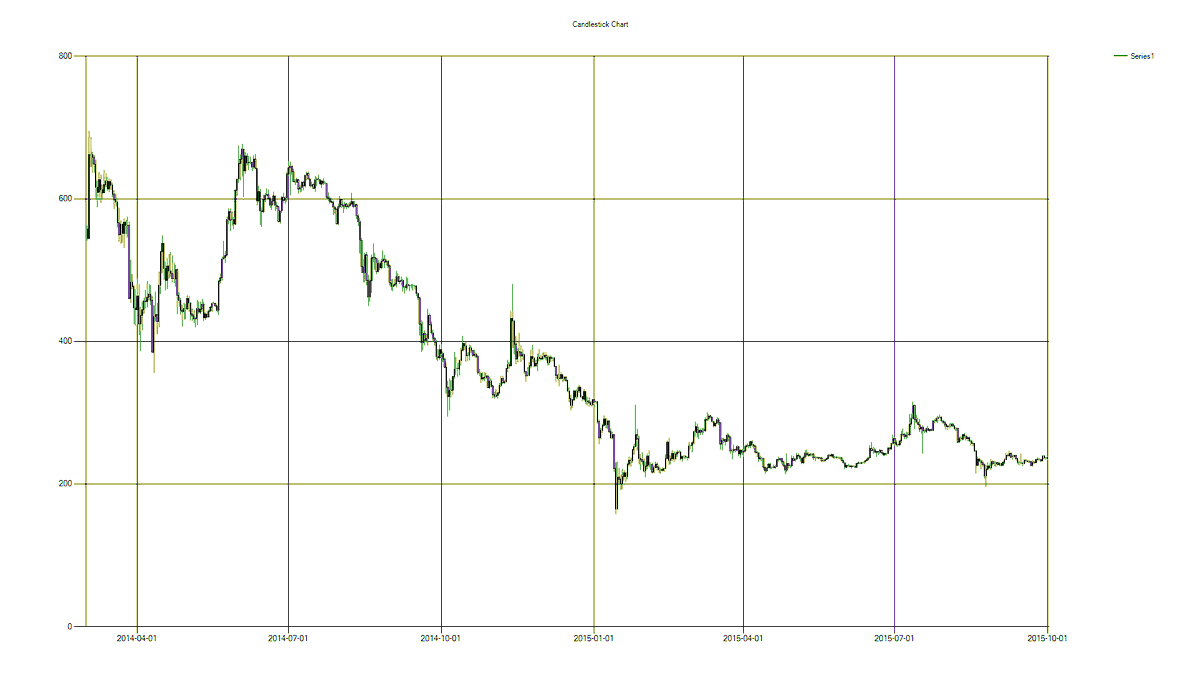
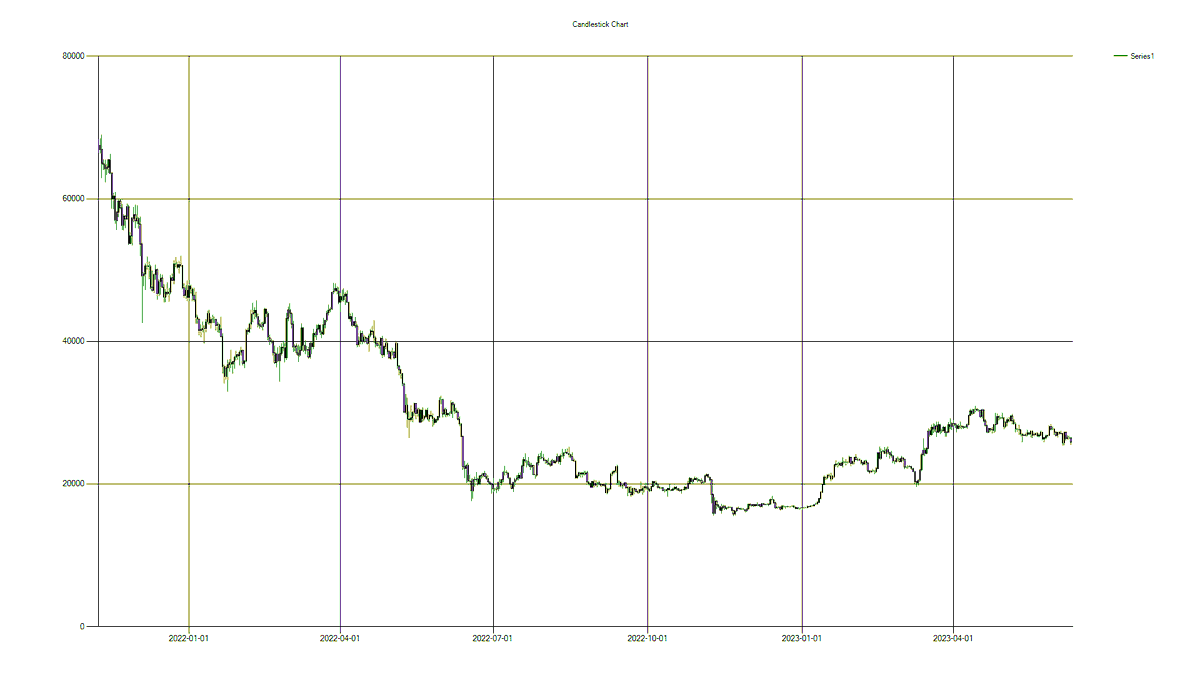
The third picture is a visual comparisons of the moving averages.
Custom indicator found:
Nov 09, 2021 - Jun 10, 2023 - 124.695890701
Mar 02, 2014 - Oct 01, 2015 - 124.369352195
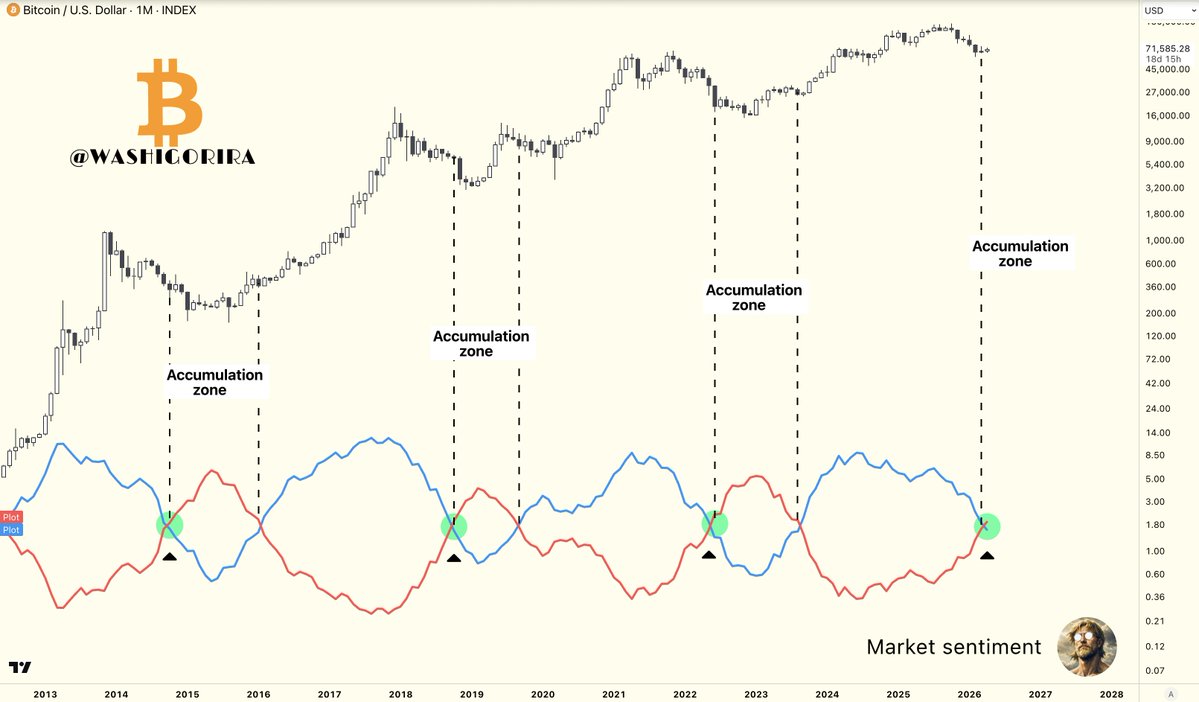
#Bitcoin
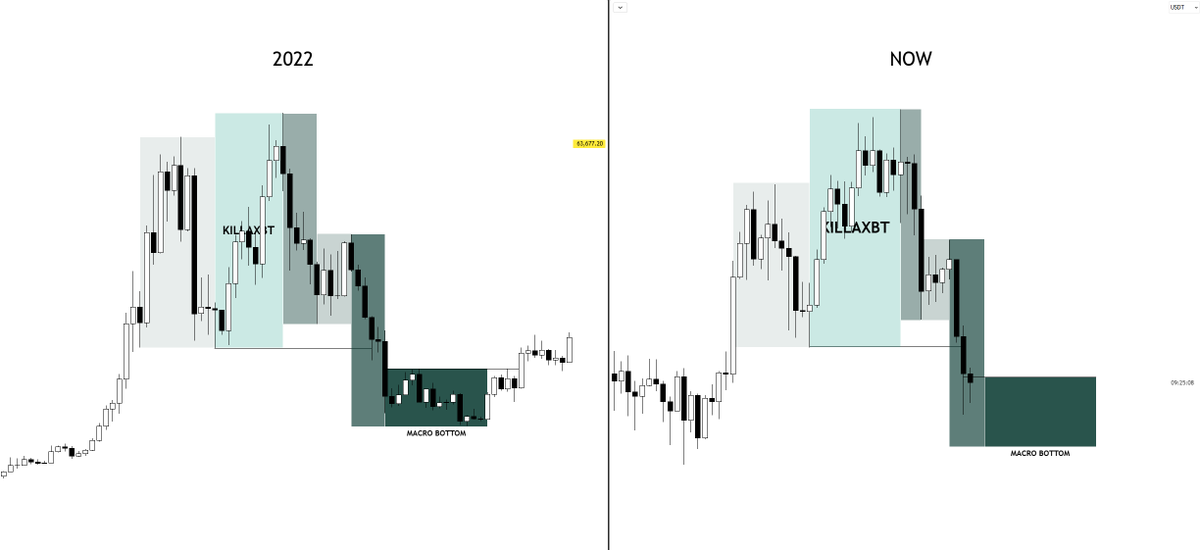
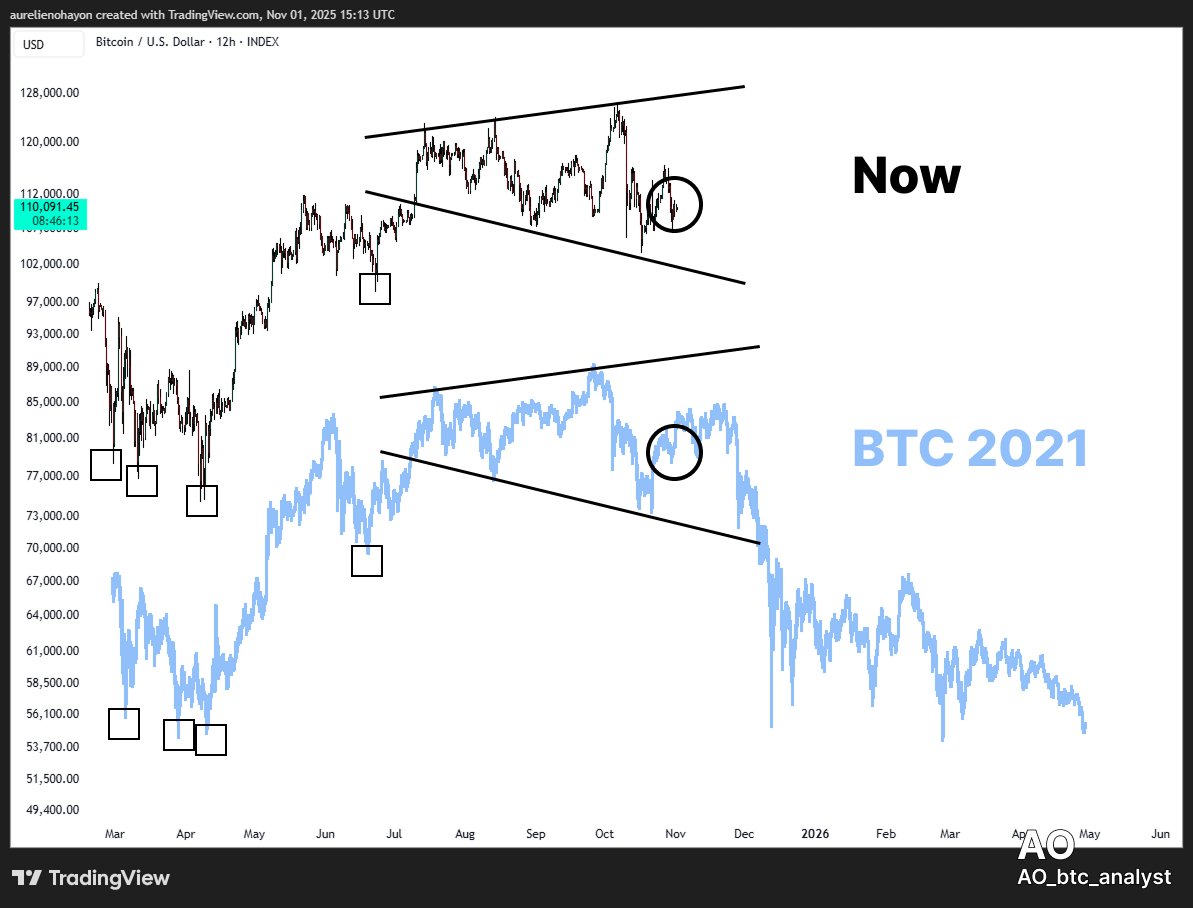
$MSTR has been the canary in the coal mine for Bitcoin bear market since 2021.
2024 is running the same 2021 playbook.
Lower low -> bullish divergence -> reversal.
Blue circle =where we are now.
Ready @BitcoinArchive ?
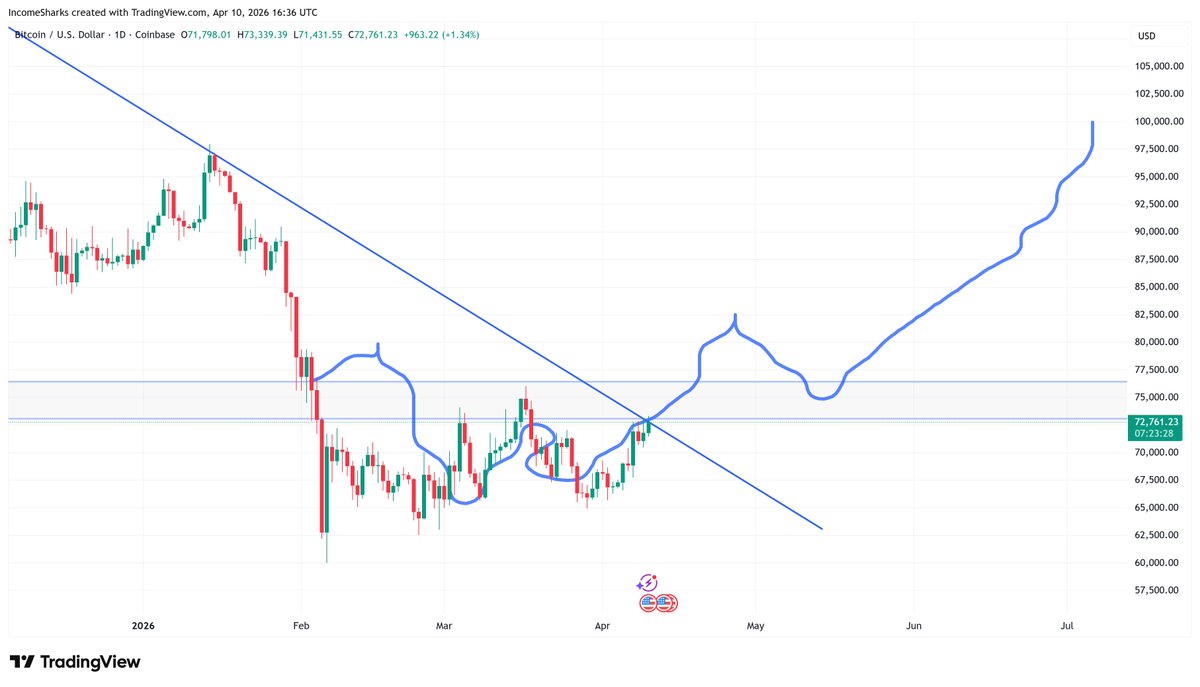
MACD bullish crossover on Bitcoin's weekly chart. (pending)
Most will call this the bottom.
Chart history says otherwise. When this crossover fires in deep bearish territory, divergence typically follows.
Translation: price goes lower first.
The crossover is the setup, not the signal. Wait for confirmation.
#BTC
The short term is highly uncertain. A sharp correction may occur. This is a POSSIBILITY.
That said, the medium term is bullish (economic cycles are starting a new bullish cycle for risky assets).
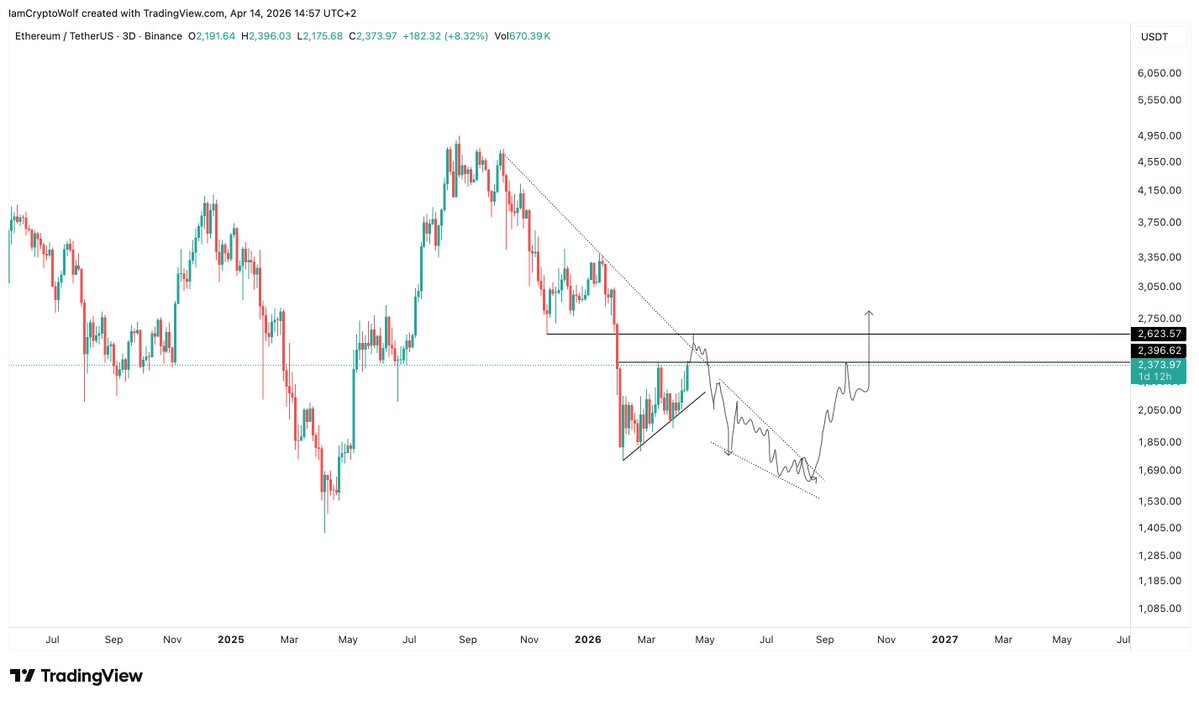
Ethereum Update
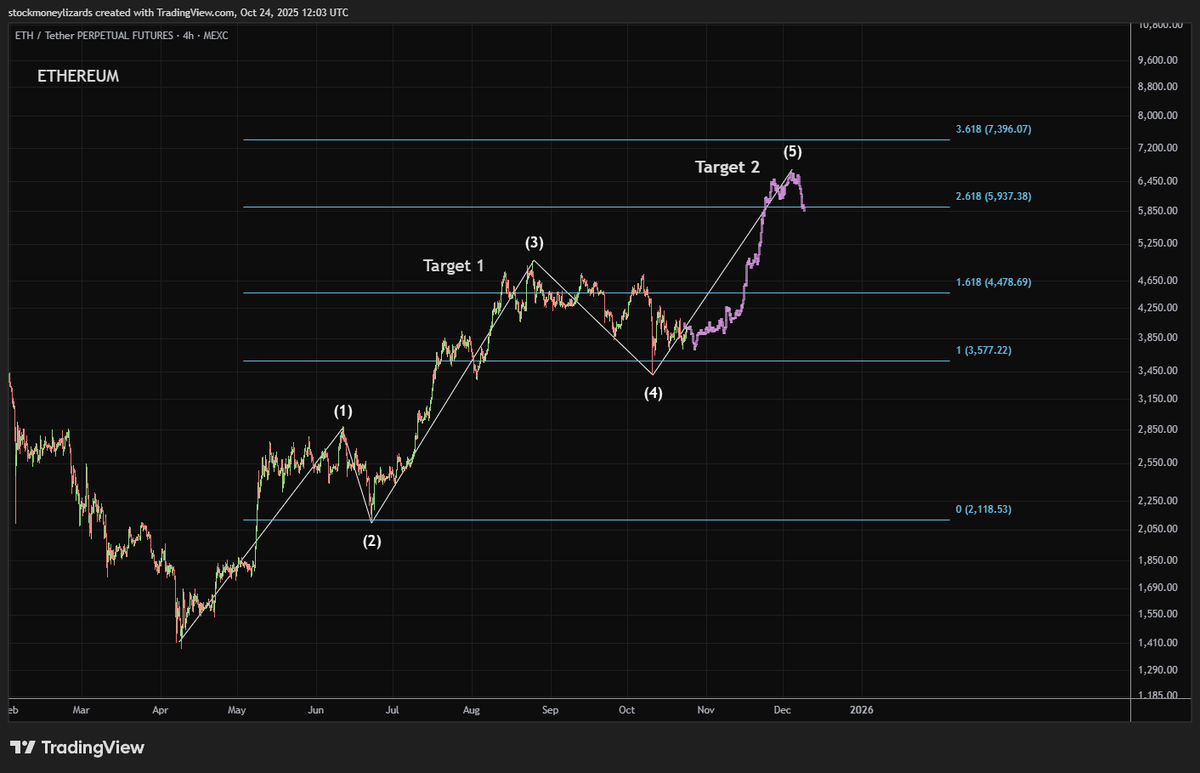
ETH’s current move looks like a textbook 5-wave impulse structure, with the ongoing correction likely forming wave (4).
Wave (4) corrections are usually shallow and time-consuming, shaking out late entrants before the final push higher. Based on Fibonacci Extensions (FE), the projected targets for wave (5) are:
Target 1 (Wave 3): 1.618 FE ~4,480 (we reached that in August)
Target 2 (Wave 5): 2.618 FE ~5,940
Extended target (upside): 3.618 FE ~7,400
Wave (5) would typically align with renewed optimism, higher retail participation, and overextension across momentum indicators, classic late-cycle behavior.
For now, structure remains intact, as long as the current correction holds above the prior (4) base.
Just look at this beauty 😍
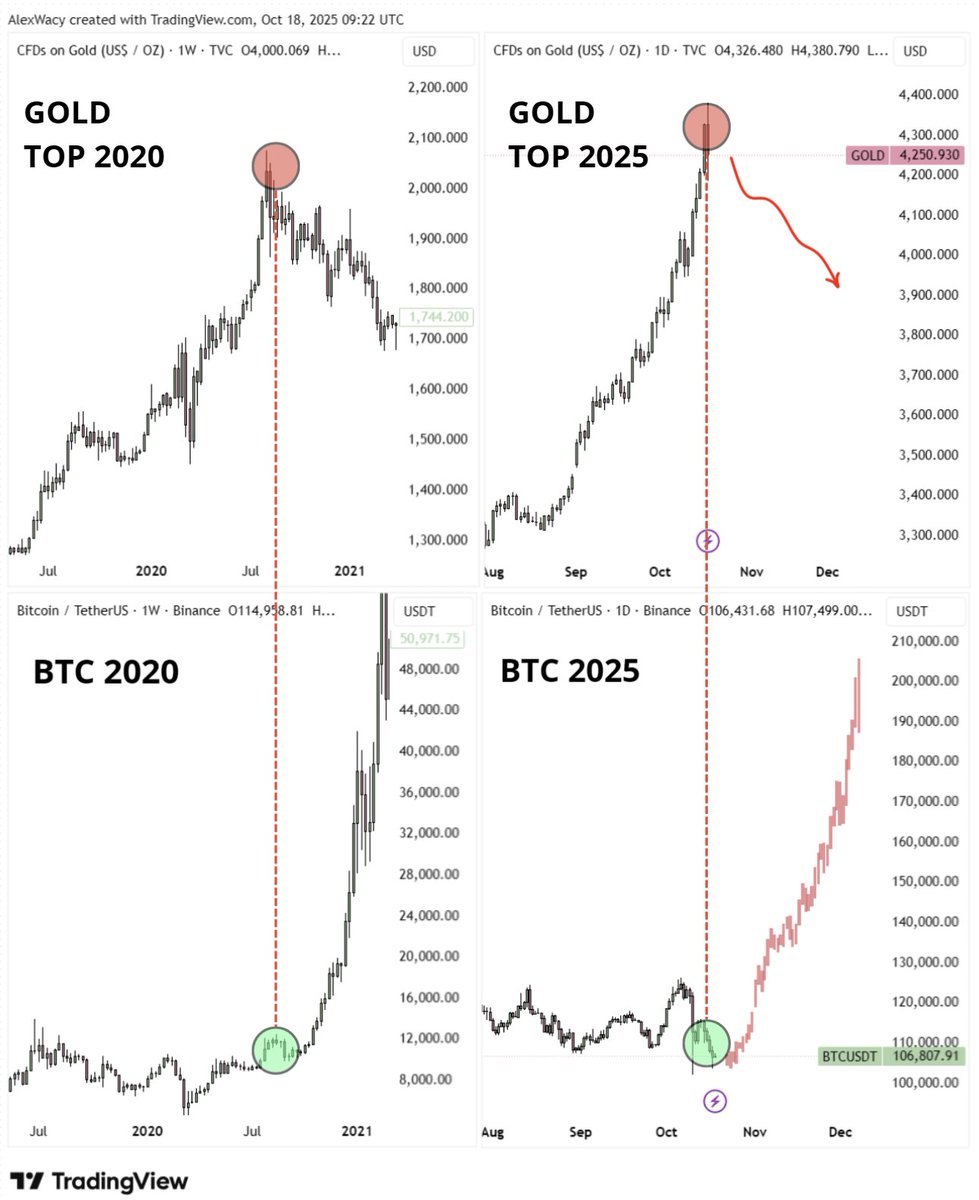
$ETH is perfectly following the February-December 2024 $BTC Fractal 👌
Even the August 5, 2024 Crash coincides with the October 10, 2025 Crash!
#Ethereum New ATH 🔜 📈


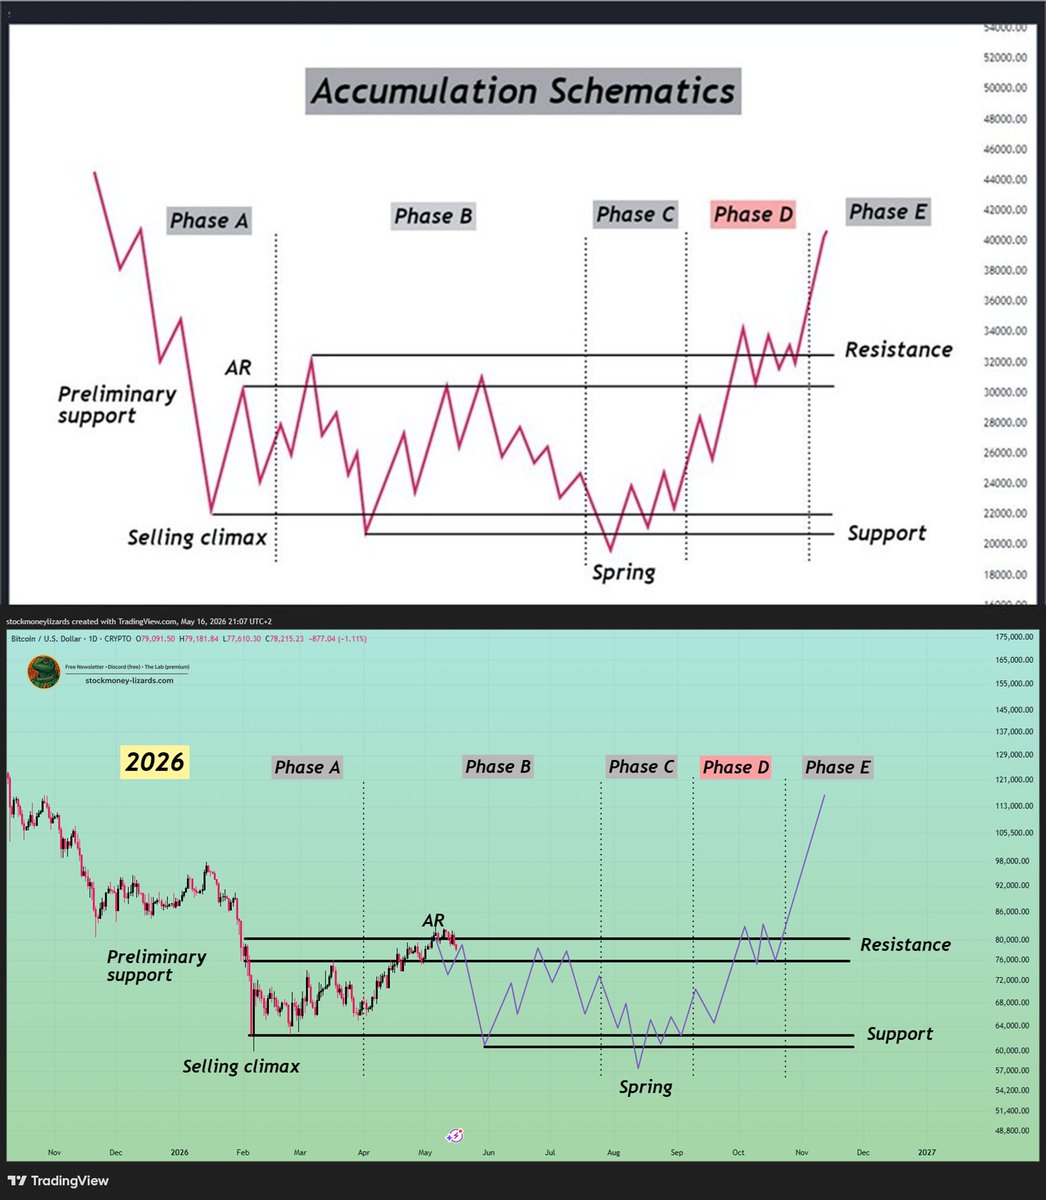
![StockmoneyL's tweet photo. Bitcoin
Phase: [██████░░░░] B of E
The part nobody has patience for. https://t.co/aNMdd2dTOz](https://pbs.twimg.com/media/HHf9ShxXsAAeYD0.jpg)