If I had to retire with just two REITs, I would pick Agree Realty ($ADC) and W.P. Carey ($WPC). Both offer attractive dividend yields, strong balance sheets, predictable cash flows, and long-term growth potential. That's exactly what I want from my retirement investments.
REITs ($VNQ) are trading at historically low valuations because investors expect higher interest rates to persist. Even blue-chip REITs like Camden ($CPT), Mid-America ($MAA), and Public Storage ($PSA) trade at substantial discounts to NAV. If rates eventually decline, the upside could be enormous.
At $39.59, $BN Brookfield is priced for 6-11% annual growth in per-share earnings, depending on how well it reinvests, while the core business grew 14-15% in each of the last two quarters. The market doubts that pace will last because the full-year record is closer to 9%, and the return on recently retained capital looks thin, and the gap closes only if the next few quarters show otherwise.
Are you a buyer at current levels?
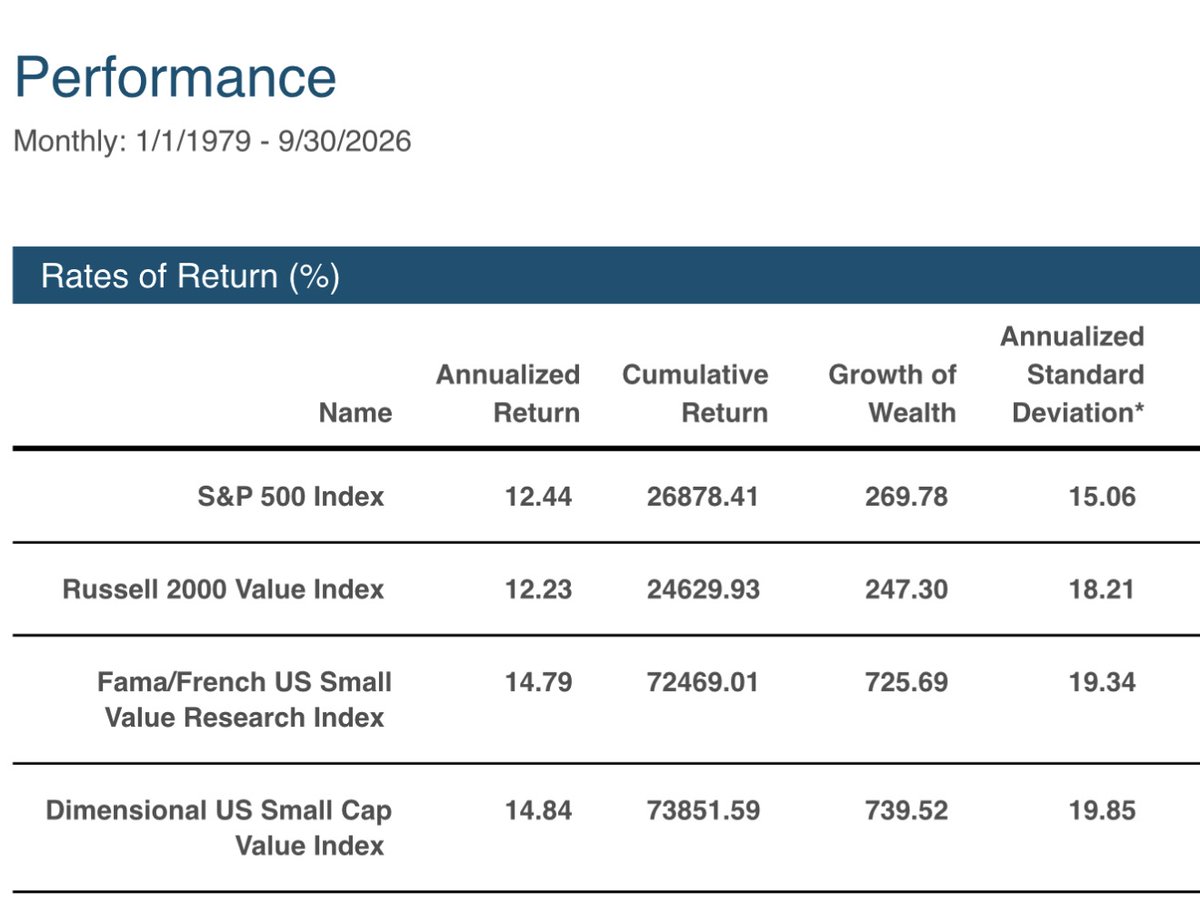
Style-based indexes like the Russell 2000 Value were created to mirror the universe of stocks that active managers pick from (seriously!), not to deliver asset class or factor premiums.
Anyone who uses the Russell 2000 or R2k Value to represent a particular asset class is not a serious or knowledgeable investor.
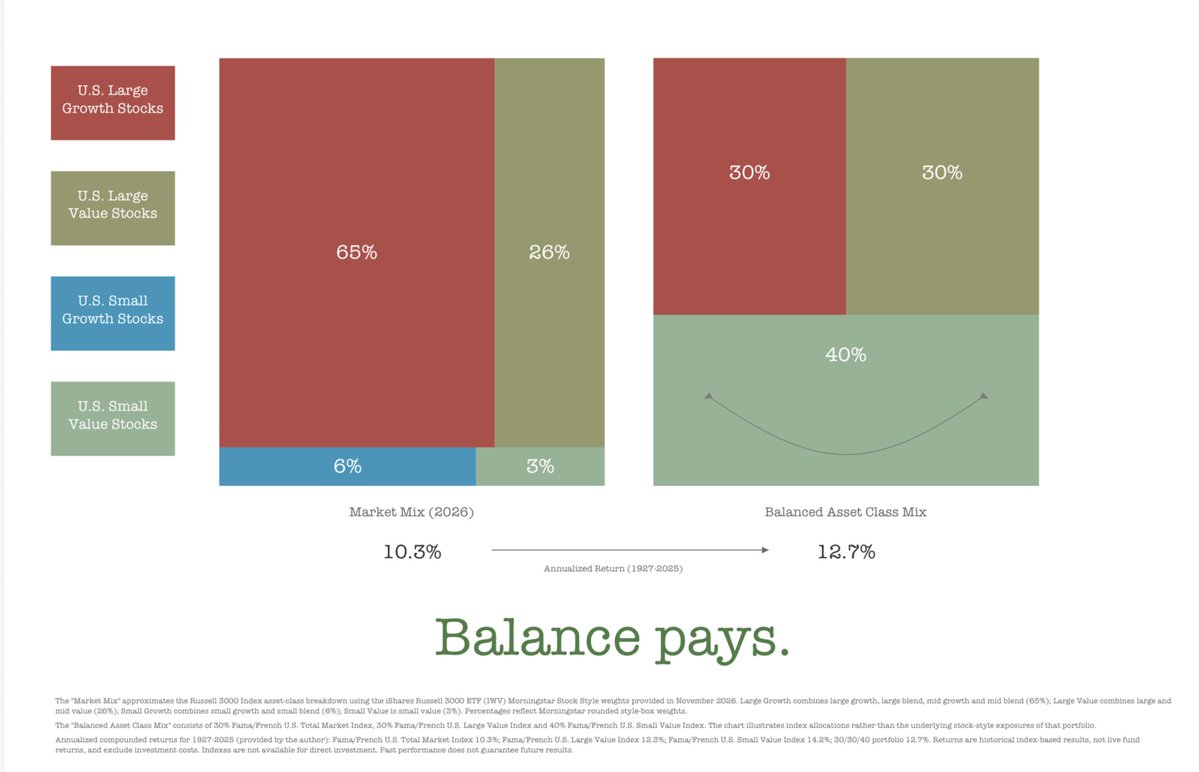
My favorite investing graphic and one of the smartest investing moves you can make—from just putting all your $ in the stock market index to holding a more balanced asset class stock index.
Instead of using the market index as your “total” portfolio, use it as the large cap/large growth fund it really is, and add asset class diversification in the form of large & small value.
”Balance pays” in the form of > 2%/yr higher historical returns and better long-term consistency.
Can you afford the risk of a Total Market Index? If you knew better, you wouldn’t want to.
27% of 10-year periods have seen a real return of 4% or less (including 11% negative!) for the market.
What’s the fix? A more balanced stock allocation—30/30/40 market/large value/small value had only 14% of 10-year periods returns < 4%, and only 2% negative.
A balanced stock portfolio is significantly less risky in the long run, and has had over 2% per year higher returns.
Why would you invest any other way?
The Alpha Architect U.S. Quantitative Value ETF ($QVAL) has outperformed its US Value peers over the past 5-, 3-, 1-year horizons, and year-to-date. But why?
One guess is that our portfolio managers got better at picking stocks. Another is that we changed the process to gain an edge. Neither happened. QVAL is an active ETF, but its stock selection is rules-based, and the process has been largely the same since inception over a decade ago. See the Fund’s website for complete holdings information.
Let’s cut to the chase: We believe QVAL's deliberate construction has allowed it to outperform in times when value investing is in favor.
Join us LIVE on November 19 at 12pm ET as we make the case for why investors looking for capital efficient, potentially higher performing value exposures should consider QVAL.
Sign up here: https://t.co/LXVXyDB8K2
Standardized Returns as of 09/30. Returns are average annualized returns, except for those periods of less than one year, which are cumulative.
Period | MKT | NAV
YTD | 33.80% | 33.96%
1 Month | 10.59% | 10.71%
3 Month | 10.84% | 10.84%
6 Month | 19.55% | 19.41%
1 Year | 42.16% | 42.22%
3 Year | 24.28% | 24.29%
5 Year | 14.48% | 14.52%
10 Year | 12.92% | 12.92%
Since Inception | 9.96% | 9.95%
The performance data quoted represents past performance and does not guarantee future results. Investment return and principal value of an investment will fluctuate so that an investor’s shares, when sold or redeemed, may be worth more or less than their original cost. Current performance may be lower or higher than the performance quoted. For performance data current to the most recent month end, please call (215) 882-9983 or visit https://t.co/txojTCEteE
Inception Date: 10/21/2014
Expense ratio: 0.28%
To learn more about QVAL, holdings, and to see standardized performance head to https://t.co/txojTCEteE
Investors should carefully consider the investment objectives, risk, charges, and expenses of the funds. For a prospectus with this and other information about the Fund, please call (215) 882-9983 or by visit https://t.co/fldtGoMUBi. Read the prospectus or summary prospectus carefully before investing.
Investing involves risk, including possible loss of principal. QVAL invests in value stocks, which may not rise if the market fails to recognize their value or favors faster-growing companies, and may underperform for extended periods. It may invest in small- and mid-cap companies, which can be more volatile and less liquid, and may have significant exposure to the healthcare, consumer discretionary, industrials, energy and materials sectors. Its quantitative model may not perform as intended, and monthly reallocation and high turnover may affect returns and taxes. Shares trade at market price, which may differ from NAV. The Fund is actively managed and may not meet its objective. For a complete description of the Fund’s principal investment risks, please refer to the prospectus.
Source: YCharts, Alpha Architect. 9/30/2021 – 9/30/2026. Daily returns at NAV. PAST PERFORMANCE DOES NOT GUARANTEE FUTURE RESULTS. Investing involves risk, including the potential loss of principal. Small Value and Large Blend are represented by a category average. Categories are derived by Alpha Architect from categories determined by YCharts. Comparisons to category averages are inherently limited and may differ materially from a particular investment in its objectives, strategies, risks, liquidity, volatility, expenses, and return characteristics. The correlation between a particular investment and a category average may change over time. Category averages are not available for direct investment. Returns derived from sources believed to be accurate but are not guaranteed.
Nearly every value-oriented investor, hedge fund, and value ETF winds up underperforming the benchmark - Vanguard's small cap value ETF $VIOV.
(Growth investors similarly underperform $QQQ)
Avantis $AVUV stands out as an ETF that's beating the benchmark. Impressive.
I'm slightly disappointed in the $NBIS Q3 results and Q4 guidance but the stock doesn't deserve to be down -16% today, I believe this is just investors overreacting to a couple short term hiccups...
Q3 revs up +571% YoY
Q3 revs up +68% QoQ
Q3 ebitda of $465M, up from -$5M a year ago
Q3 ebitda margins were 47%
Here are some of the reasons why the market might be overreacting today:
1) Q4 revs and 2026 exit ARR will be lighter than expected because of construction / power delays, pushing those revenues into early 2027.
~These revenues didn't disappear, they just got pushed back a few months... looks bad but doesn't change long term thesis/opportunity. This just proves how hard it is to build these large data centers with so many potential delays across construction, power, and permits.
2) 2027 revenue guidance starts at $12-13B, perhaps a little lower than some were expecting
~Management said this is very conservative guidance and I believe they need to start low in case they run into additional construction delays next year. I believe there's meaningful upside to this range if schedules in 2027 stay on track and $NBIS is able to deliver capacity on-time to customers.
3) 2027 capex guide of $40-45B
~This capex guide looks big compared to the $12-13B revenue guide which is why I think it's a mistake for $NBIS management to stop giving ARR guidance. ARR guidance gives us an idea of the capacity ramp throughout the year and helps us model out when power gets connected and when revenues start to get collected. There's going to be a disconnect between revenues and ARR... especially in a business like this where capacity is ramping fast but those revenues don't come for a few months after the power gets connected.
Look at Anthropic... they're expected to do $50-52B revenues in 2026 however their exit ARR is expected to be ~$100B. I think it will be similar for $NBIS although perhaps even more dramatic based on when their 1GW of capacity gets connected in 2027. I think it's very likely that $NBIS does $15-16B revs in 2027 but their exit ARR is $30-32B
Here are my 2027 exit ARR predictions that I shared yesterday... https://t.co/pukXkdUOek
I'm sticking with these ARR predictions because management has confirmed they expect to add another 1GW of capacity in CY2027 which should generate ~$25B of ARR across short, medium, long term deals/pricing. The long term deals are with the hyperscalers at $12-13M per MW. The medium term deals are 1-3 years at $20-35M per MW. The short term deals are under 1 year and could be $35-50M per MW.
That $40-45B capex number should not surprise anyone because we've known for months that it costs $40-50B to bring on 1GW of capacity -- Jensen and multiple CEO have said this. It's just the capex vs 2027 revenue guidance is scaring some investors and it shouldn't because ARR is the more important number to model with and exit ARR in 2027 will be ~2x higher than the CY2027 revenue number
Okay, now to the more positive nuggets from the call because there were lots of them...
1) demand is still extremely high, 2027 is basically sold out and starting to sell capacity for 2028
2) will keep adding 1GW per year... still targeting 5GW of connected/contracted power
3) asset light business model is starting to generate meaningful revenues
4) prepayments are getting bigger... covering 50-100% of capex with access to asset backed loans when needed
5) payback periods keep getting shorter... coming into 2026 they were 24+ months... with Q2 earnings they said it was down to 22 months and now the payback period is down to 19 months... I suspect this number keeps going lower as MW prices keep going higher while shifting more capacity to short term deals at higher rates.
6) continue to sign more medium term deals (1-3 years) at above $25M per MW
I'm going to read through the transcript in a little bit to make sure I didn't miss anything. Wiil add more comments below if needed.
Fwiw, $NBIS did bounce today off that trendline going back to the April 2025 lows
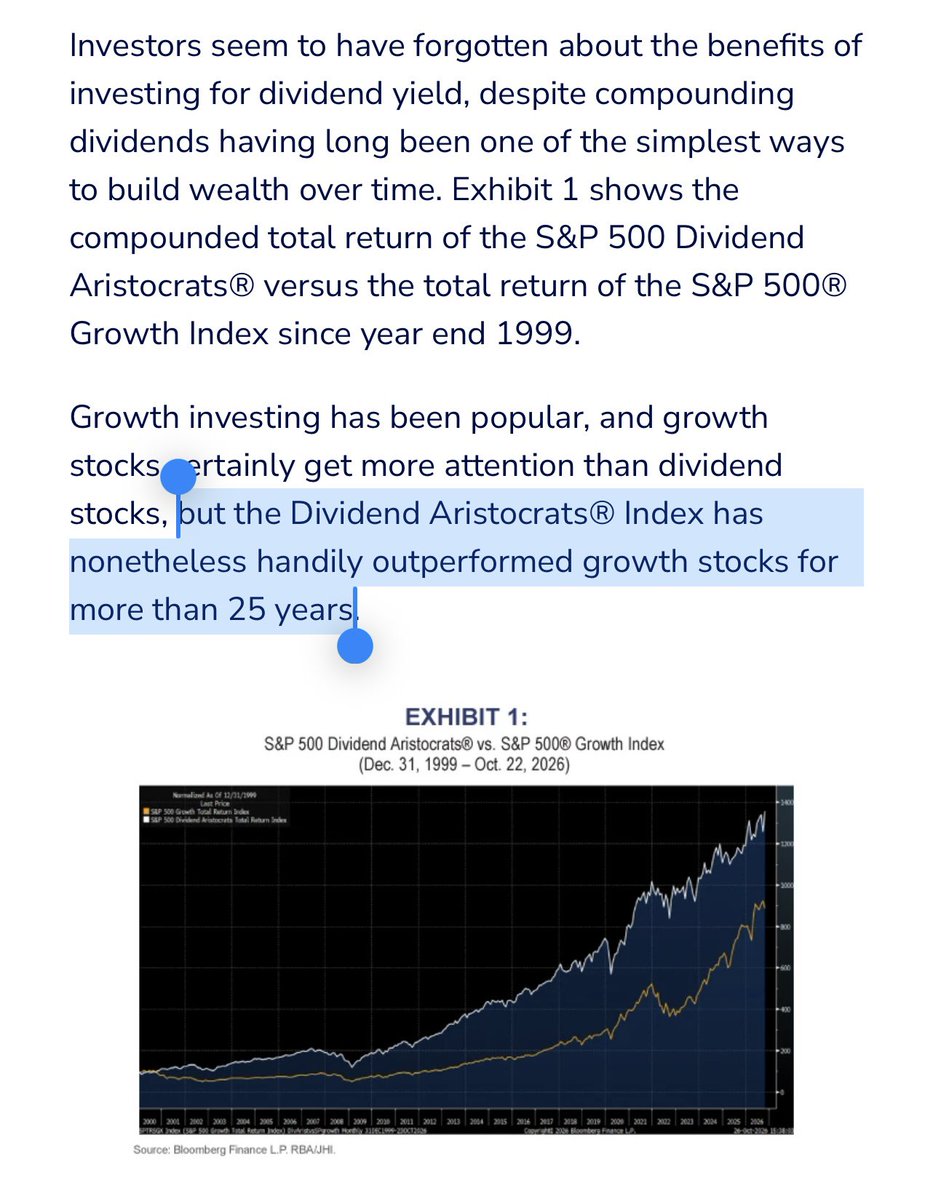
“Dividend-focused stocks have outperformed growth stocks over the past 25 years, underscoring the long-term role of compounding dividends in building wealth.” - @RBAdvisors
Blackstone Digital Infrastructure Trust ($BXDC) trades at around $16 per share, versus its $20 IPO price. Once its capital is deployed, I estimate it could generate roughly $1 per share in AFFO, implying just 16x forward AFFO. That's considerably cheaper than established data center REITs like $DLR and $EQIX.
@BanderOnTwitch@acheronix@elaifresh@pk_kenzie Go back to school and take economics 101. Minimum wage causes massive inflation. In fact it’s one of the main reasons everything is so damn expensive in California.
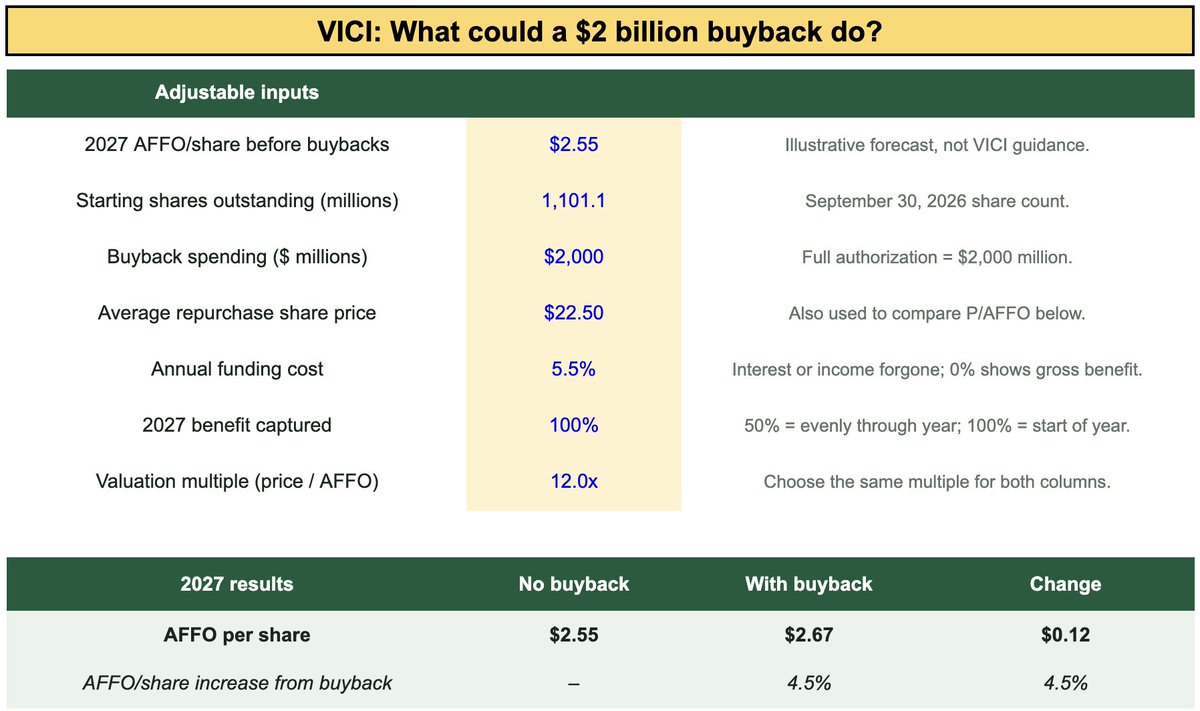
$VICI recently authorized up to $2 BILLION in share buybacks.
REITs like VICI almost never buyback shares, so this tell you just how suppressed management believes the share price has become.
Here's the math we MST understand:
If we take the liberty to make a few assunptions:
• 2027 AFFO/share before buybacks: $2.55
• Average repurchase price: $22.50
• Buyback spending: $2 billion
• Annual funding cost: 5.5%
• Full-year benefit from the repurchases
At $22.50 per share, VICI could retire approximately 88.9 million shares, reducing the starting share count by about 8.1%.
After accounting for $110 million in annual interest expense or income forgone, AFFO per share would rise from $2.55 to approximately $2.67.
That’s roughly 4.5% accretion from the buyback alone.
Higher AFFO per share could creates additional capacity for future dividend growth.
BUT-
That doesn't always mean repurchasing shares is the best use of that capital.
Using these assumptions, buying shares at $22.50 means buying back an estimated $2.55 of annual AFFO for every share retired.
That’s an implied forward AFFO yield of approximately 11.3%.
That 11.3% becomes an important benchmark when evaluating acquisitions, development financing, and other investments.
If VICI can deploy capital elsewhere at a higher return, after considering funding costs, risk, and future growth, that investment may create more value than repurchasing shares.
The repurchase price matters substantially of course as well..
As the share price rises, the AFFO yield falls and buybacks become less attractive, all else equal.
The model assumes the entire authorization is used at the start of the year, but keep in mind the authorization runs through September 2029 and does not require VICI to spend the full amount.
I want management to pursue whichever opportunity creates the most long-term value per share, with buybacks competing for capital alongside every other investment.
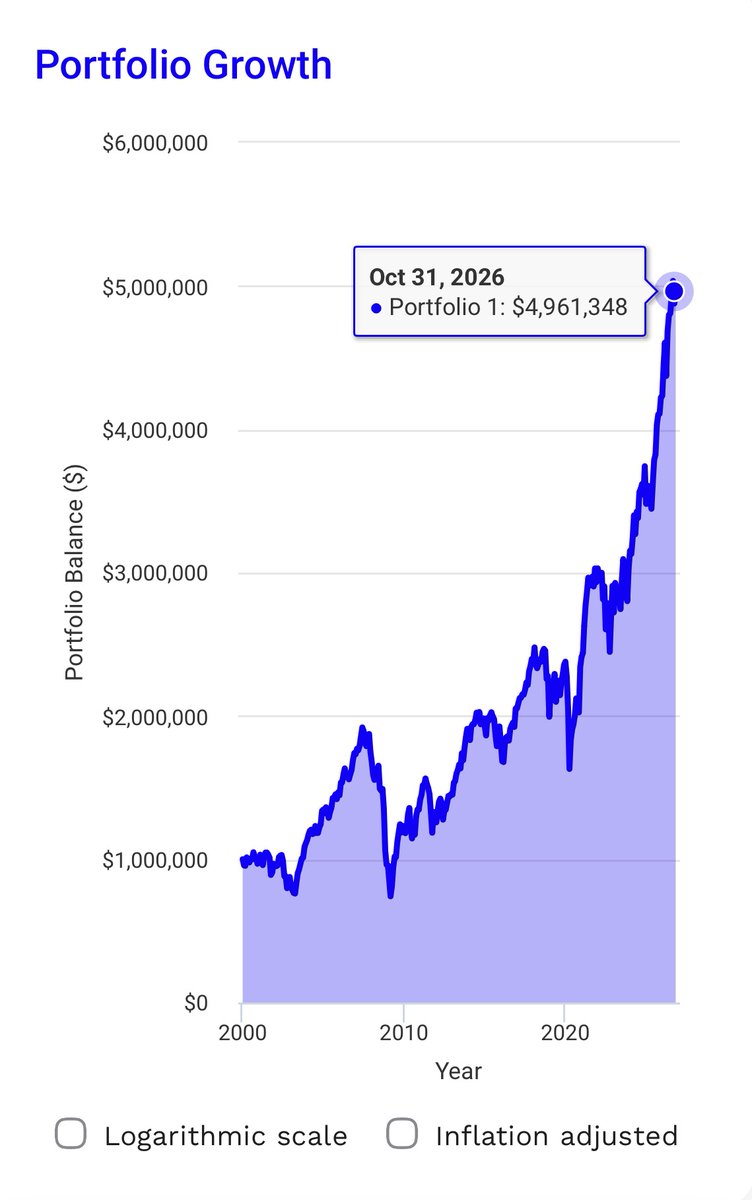
Less scary—owning the market but also diversifying into large/small value stocks (US & int’l), the 4% rule has worked 100% of the time (1 other time) from current valuations.
$1M -> $4M+, net of withdrawals!