Our confirmed version of a new standardized questionnaire for perceived website clutter has separate measures of Overall Clutter, Content Clutter, and Design Clutter. https://t.co/QpXRZuT0LI
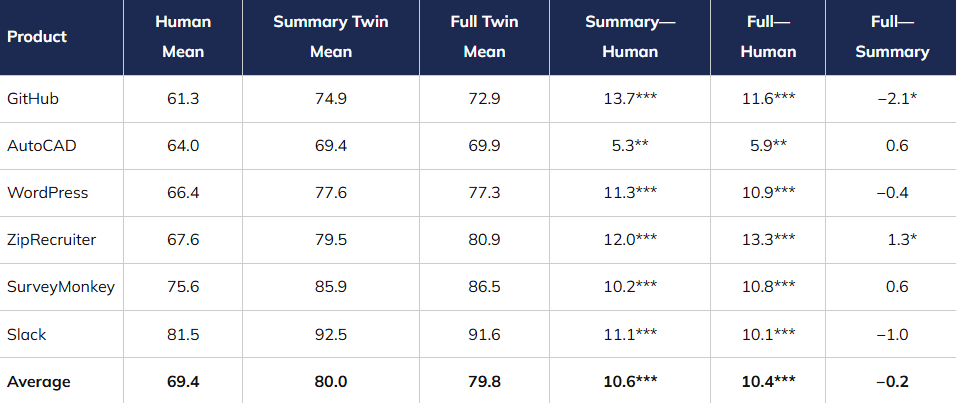
Unlike our previous research, we found no significant differences in predicted SUS scores from two types of digital twins (summary and full)—but both were very different from human scores. https://t.co/Uur22t2tCw
Math and empirical data indicate that the first few users in a formative #usability study will uncover most of the common problems that are available for discovery, but how can this help when planning these types of studies? https://t.co/IpE9knqwNF
In an experiment with digital twins predicting SUS scores for business software, we found similar standard deviations for humans and AI but very different shapes (skewness and kurtosis). https://t.co/Uur22t2tCw
The Product Market Fit item score is the percentage of respondents who would be very disappointed if they could no longer use a product that they have been using. https://t.co/R3M1eoUH8i
As a #UX researcher, have you ever worried about using the wrong rating scale format? Would it surprise you to learn that it often doesn’t matter? https://t.co/uKS8ZFkd4t
Our analyses of three versions of a technical activity checklist indicate that a list of 16 activities is too much, 9 isn’t quite enough, and 10 is just right. https://t.co/BBeeEWpsBH
Our study of clothing websites found that they provide experiences that are above average (collectively, at the 82nd percentile in the SUPR-Q). Individually their SUPR-Q percentiles ranged from the 50th percentile (H&M) to the 98th (Banana Republic). https://t.co/yIsT1kBJ2O
Most surveys contain a mix of closed-ended (e.g., rating scales) and open-ended questions. Here are five reasons to use open-ended questions. https://t.co/qhUfWokyfX
Some variables cannot be observed directly. Trust is one example; it can only be measured through inference. Such variables are hidden (latent). https://t.co/ANRNSk9hZp
We found digital twin prediction of SUS scores for six software products inflated by ~10 points with radically different human/AI distributions. https://t.co/Uur22t2tCw
Analysis of a Wright map of the 16-item SUPR-Qm revealed opportunities to streamline the questionnaire by removing redundant items. https://t.co/hFCsdncyQz