⚠️ Project Update
OceanFund rebrands to WhaleAI.
Same mission: discover 100x gems and invest.
☑️ WhaleAI Focus
Gem discovery and vault investment.
Improved vault system (alts, stables, Alt Index timing).
New token will be deflationary with profit share as usual.
Enhancing WhaleAI platform for whale tracking and alpha detection.
☑️ For $OF Token Holders
Send $OF to deployer: 0x23d1c8E32Abedd7cf23431Dcb30429B8444d3175
Deadline: April 30, 2025.
Tokens bought after April 1, 2025, not accepted.
☑️ WhaleAI Group
Present users kept in group, regardless of token holding, until new token is launched.
☑️ New Token Launch
Launch at the beginning of May 2025.
Airdrop (1:1) over May.
Massive marketing and KOL campaign.
7/ 🧠 Final Oz Take:
You’re not trading CPI anymore. You’re trading the point where the system either snaps, or the Fed gets dragged to the fire exit.
Watch:
HYG
VIX
2Y/10Y
BTC reaction
Fed language
We’re at the edge.
—Oz
#Macro#LiquidityCrisis#VIX#HYG#FedTrap#Bitcoin
Levels to monitor if Bitcoin maintains its HTF bullish structure and proceeds forward to a new ATH:
- BTC : 87/109K
- TOTAL 2 : 2/2.5 T
- OTHERS : 600/685 B
- BTC D : 43.87%
- USDT D : 3.80%
If I'll find confluences between those charts I'll cut 80/90% of the positions, keeping a little portion "just in case".
Raven Calls 420 shilled #SPX2 on their channel
They have 9,147 subscribers
#SPX2 TG community is 1700 and growing
If you are watching & waiting, I would be careful how long I watch & wait.
This is HUGE
#SPX2ARMY is about to grow dramatically
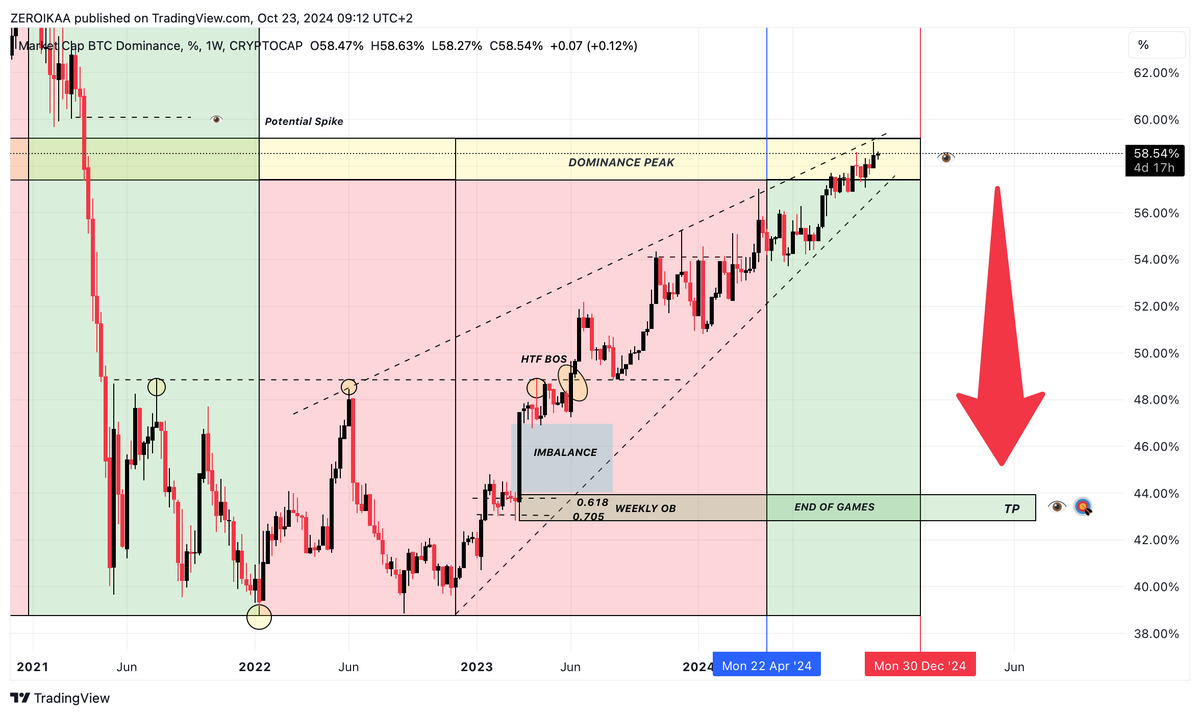
Over the past year, we’ve witnessed Bitcoin's dominance steadily climb, and the most anticipated question is undoubtedly: "Will it ever stop rising, leading to this altseason?"
While this is a logical question, it’s not the most important one.
The key question to ask is: "What is the area to keep an eye on to secure a solid take-profit level and avoid round-tripping all the gains?"
The 42-43% range. And let me explain why.
If we go back to June 2023, I pointed out how BTC dominance had broken above the swing high at 48.90%, confirmed by a weekly close, and was poised to reach my final target of 56-58% -> https://t.co/L518bLiMf0
The target has been hit, and while I could still see a spike upwards, I believe the reversal is near, "ushering" the much talked altseason (in its most primitive form, of course).
So why 42-43%?
Because it corresponds to the weekly order block that triggered the impulse, which then broke the range to the upside and this is highly significant for the overall structure and price action.
But that's not the only reason.
We also have the weekly imbalance created by the impulse of March 13, 2023, which will be filled 99.9% of the time, as per classic AMT.
Additionally, if we apply Fibonacci to look for confluence with this level, we can find the 0.618 and 0.705 levels, which are among the most important in Fibonacci retracement and thus add more "spice" to the theory.
Don't forget the overall dilution and diminishing returns that play a key role and sustain this thesis.
I already know that when we hit those levels, the majority will be euphoric, with “to the moon” tattooed in their minds (and maybe even on their skin), but if you're rational and smart, you'll use that area to say “Adios” with a smile.
Otherwise, I’m almost certain that with what’s left in your bags, you’ll be buying tissues to wipe away the tears.
Many people ask me: "Mate, how do you chart? How is the process if I want to start from a naked chart?"
Time to drop the whole framework with the hope that you may find interesting ideas to apply to your journey.
Disclaimer: Before starting, it's important to remind that everyone has his own style and the crucial aspect is being able to find a methodology that offers the highest statistical probability over time, aka backtest, contextualized to goals/time horizons and time that an individual can commit.
(Quite long post, so if you're lazy "TLDR" skip it, this isn't for you -> but if you're drinking a Mojito 🍹on the beach, you have time to read)
- First step -
The first thing way before everything else is understanding the macro structure in order to have a clear view where the price is trending and thus being able to work on a strategy.
To do so I'm gonna directly switch the chart to HTFs, mainly weekly and daily which are my favorite TFs (monthly also, but after having made a "first touch-analysis") as they have more relevance than LTFs, of course.
From those TFs, the process is identifying:
- HHs/HLs for the bullish trend
- LHs/LLs for the bearish trend
Nothing difficult, this is the first and necessary step that leads to build up the main strategy.
- Second step -
Now that I know if the price is in a bearish or a bullish trend, I start to identify strong supply & demand areas where the price can be rejected or bounce.
S&D zones are more powerful than support and resistance levels as they provide wider areas, but this doesn't mean that S/R should be ignored but instead utilized as "2nd layer" once you grasped the bigger picture.
There are S&D zones that are stronger than other ones and they usually match historical and significant points in which the price has violently wicked or strongly rejected/bounced.
Take note as additional info that the more a S or D zone is touched, the weaker it becomes as orders on one side or another get absorbed -> this can change your overall perception and operational activities.
S&D zones together with S/R levels contribute to create the "main dish" which is completed by the "dessert" called Order Blocks.
OBs are zones where significant buying or selling from smart money, offering extra but valuable areas in which the price can reverse.
Bearish and bullish OBs can fail, there are no certainties, but being to properly contextualize them in an overall analysis can make a huge difference leading to profitability.
Not every OB plotted on the chart has the same relevance, most of them are weaker as they have already been tested multiple times, therefore increasing the likelihood of being melted like butter.
The process of finding good OBs doesn't only depend on looking at HTF ones, but also switching to multiple timeframes in order to find the best ones.
Weekly? Yes. Daily? Yes. But very often you can find good levels by switching to uncommon TFs like 2D/3D as there's liquidity contained in candles that are invisible to classic TFs.
Identifying and drawing these areas on a chart adds more clarity which is strengthened by the application of trendlines.
Trendlines are drew by taking into consideration at least 2 SHs/SLs but for my attitude 3 is the perfect number that validates a correct TL.
The 🔑aspect here is to not force a TL (don't chain yourself in finding one if conditions aren't met) + understanding that horizontal S/R are more powerful than diagonal ones.
- Third step -
Finding the liquidity.💧
This is one of the most important steps as everything turns around the concept of liquidity (more here if you're interested -> https://t.co/AIibrw2QM0)
Fair value gaps play an important role in my strategy, especially the ones who have never been tested, thus boosting the probabilities of seeing the price catching the liquidity 💧toward those areas.
Untested ones that find confluence with historical PA (especially areas in which the price has strongly reacted) are more powerful than "naked FVGs" that have less relevance.
As per the OBs, even FVGs might be evaluated on multiple TFs to find the best ones, meaning that if you find multiple confluences, those gaps become stronger.
In a strong trend, FVGs could act as supports if the body of the candle closes inside of them or the price wicks toward those areas, leading to continuation.
As a general rule, I tend to look for HTF FVGs in opposition of the trend meaning that, if we consider a reversal, the higher ones in a bearish trend and the lower ones in a bullish trend, will likely be more powerful contributing to attract the price over time.
FVGs alone don't tell you about the liquidity, they need to be contextualized to candle bodies in order to be effective.
- Fourth step -
The study of price action.
Once the chart starts to appear clearer as it incorporates the concepts we mentioned above, I start to monitor all the factors involved in the PA.
This includes:
- The candles (big or small bodies and when they appear)
- The wicks (where they spike and how long they are)
- Momentum & Dominance
- Closures above/below significant areas or SHs/SLs
The dominance is extremely tied to the concept of S&D, with SHs/SLs as points to overcome in order to see continuation/reversal.
Momentum, instead, refers to the "speed" of sellers and buyers.
The less it takes for a price to reach a specific level, the stronger the momentum from buyers or sellers.
The more it takes, the weaker the momentum for one side or another.
When the price closes HTF above SHs/SLs I know that could be a trigger for future continuation, usually preceded by a pullback, it's not "an instant shot".
I know, there are dozens of candle types (marubozu, hammer, hanging man, etc) and they surely help, but I prefer to move my focus on the bodies and on the wicks, as they can be enough to understand what is happening/about to happen.
Patterns?
Yes, the ones that have the highest probabilities like H&S/IH&S + 3 drives + ABCD correction.
Triangles? Sometimes, but more specifically to see if the price is compressing and can lead to a breakout.
- Fifth step -
Adding Fibonacci retracements.
I apply them on a macro scale and on HTFs, both to calculate retracements and potential targets for the future.
I use them also on lower timeframes as they help me to calculate small retracements on uptrends and assess where I could potentially take profits and reload lower.
Areas of interest are usually 0.786 + 0.618 + 0.5 (equilibrium), both for uptrends and downtrends especially if they match with S&D zones or FVGs as they become more powerful.
Extensions to calculate targets are another crucial part of my strategy, with the area of 1.618 + 1.454 + 1.272 that often helps me to find amazing 🎯
- Sixth step -
Finding confluences with external "noise" like news or announcements as they often happen when the price reaches a significant 🔑level.
Bullish news +🔑 HTF upside level -> sell
Bearish news + 🔑 HTF downside level -> buy
Price action always moves first, then the news comes out to "justify" the impulse and to 🪤 retails.
- Seventh step -
The add of potential indicators.
I don't use common indicators if not the Volume Profile that helps me to spot volume voids that matched with gaps contribute to attract the price or see areas in which there was substantial trading activity.
I often utilize Velodata for OI, Funding rate, CVD spot volume, Premium & Perp which help me to sustain the main thesis led from the price action alone.
The other indicators, for my strategy/idea aren't helpful.
That's basically the whole framework of my strategy and how I setup my charts.
If you found this helpful, the like 👍and repost buttons are just few centimeters below.
LISTEN TO ME,
I’m not trying to scare you,
I’m just here to give you the truth.
Take it or leave it.
You cannot afford to fuck this cycle up.
You just can’t.
You won’t get another chance like this.
NEVER.
So take it seriously.
I’m going to teach you shit most people won’t.
It’s straightforward.
Just focus on these 3 metrics:
~ ON-CHAIN TRANSACTION VOLUME:
This measures the total value of transactions on the blockchain.
Increasing transaction volume = BULLISH
Decreasing transaction volume = BEARISH
Watch for spikes as they occur just before big move.
You’ll find this here https://t.co/br0mbxSxnu
~ EXCHANGE INFLOWS AND OUTFLOWS:
Track the movement of coins to and from exchanges.
Rising inflows to exchanges = SELL PRESSURE
Whales are withdrawing from cex exchanges.
Rising outflows from exchanges = BUY PRESSURE
Whales are depositing to long term bags on dex’s
Look on https://t.co/geDV1S6S7W for this data.
~ NETWORK VALUE TO TRANSACTION (NVT) RATIO:
This ratio compares the market cap to transaction volume.
It tells you if the market is over or undervalued.
High NVT ratio = MARKET OVERVALUATION
Low NVT ratio = MARKET UNDERVALUATION
HERE’S THE REAL SECRET:
Monitor these metrics closely for signs of market shifts.
When transaction volumes spike but NVT ratios stay low,
It’s a signal of strong market activity.
This means the market is heating up and a top is near.
Keep your eyes on exchange flows; heavy inflows usually precede sell-offs.
These are the advanced indicators the pros use.
Just LIKE this tweet if you want more REAL knowledge.
I am going to make many of my followers millionaires this cycle,
How?
By sharing all my knowledge.
Follow me or you will stay poor.
🔸Extra tips/considerations:
• Many will convince you to hold forever expecting huge and “bazooka” gains.
Don't believe them, we will see gains but diminished since the institutional flow doesn't need “100xs” to multiply the gazillion of money in its power.
• The concept of CBDCs is worrying a lot of people because it will likely be implemented in the next years, leading to even less privacy and control from institutions, I know.
But we cannot change that, we can only adapt to it + try to reduce their impact on our lives. Those assets will do a partial work.
• Don’t waste your money on material stuff, the modern “flex” is freedom.
Buy assets, invest in yourself, travel the world, raise a family (if you want/have luck) and live in peace.
• Do everything in silence, don't speak too many words about what you're doing since people are tremendously envious.
You don't need external approval.
Read it carefully.
During these 7 years, I analyzed the charts in the most absurd ways possible.
And the only approach that had a severe positive impact on my journey was and is the study of smart money concepts.
SMC base their essence on the key concept of liquidity 💧, which is the only real trigger for the market.
Michael Huddlestone, Chris Lori, Sam Seiden etc all of these people have contributed to bringing to the general public these trading principles that come from the institutional niche, making a superb work.
Through the predominant law of the Auction Market Theory ⚖️, these mechanisms have personally been proven the most accurate and powerful ones for actually understanding where the price can be headed by having a highly favorable statistical result.
All of the other notions proposed on the internet don't provide the same edge but on the contrary, do nothing but create confusion.
We already talked about this, but I think it’s important to strengthen the concept.
You see me charting without the use of the RSI, MACD, MAs or any other oscillator because, in reality, their utility is very limited since they’re lagging indicators.
Everything turns around the pure price action which respects the laws of liquidity 💧, nothing else and nothing more.
Those mentioned above can be used as confluences, not as primary methods.
Despite the multi-million dollar investments that institutions make to improve trading algorithms, SMCs continue to play a 🔑 role in building up the most rewarding and powerful strategies.
This doesn't mean that if you master these concepts you'll be able to make millions with 100% accuracy as the discretionary component in retail trading can subvert for the good or the bad the main strategy.
But starting from these theories will make you 10x more advanced than all the guys that compulsively press “buy” and “sell” based on widely-known methodologies. 👁️
The magical ✨ recipe doesn't exist and you must contextualize your leading strategy depending on your attitude, goals, timeframes and emotional mastery.
However, I believe that the vademecum for anyone who approaches trading/analyses on a different scale should be this one: 🔖
• Market structure (classic HH/HL + LH/LL)
• Supply and demand zones (more relevant) + order blocks/breaker blocks
• Fibonacci levels, which help you to individuate premium discount and equilibrium areas
• Volume profile (LVN, HVN, VAL, VAH, POC)
• Auction Market Theory and then moving to Fair Value Gaps (FVGs) and Imbalances
• Closures above/below key areas
•Candles size (bodies for gauging strength of the move, wicks for gauging manipulation)
• Statistically effective reversal patterns (H&S/IH&S/Double Top|Bottom/Engulfing)
These are the ones to utilize on HTFs because, as we saw, these are the timeframes that SM look the most.
Then, for my operativity, I added extra data as confluence like:
• Open interest
• Funding rate
• Perp/premium
• Liquidation levels
• Spot CVD
All of these are “just” potential validations/confluences that add more “sauce” to my primary vision/analysis.
This is how I find my style and what helps me to look at the market from a more analytical and cold approach as I backtested it over time.
So, to conclude, find your own method of analyzing but please, avoid the classic methodologies promoted by 90% of the people and start studying smart money concepts.
I may sound like a broken record but is because that’s the truth.