@Mark_IKN Happy to hear you are with us, Mark. I’ve had a similar near death when I was younger. The hard truth is that it was not your time…Now what are you going to do ?!?!
SILJ/XLE ratio
Looks like a multi-year cup pattern, with the right side of the cup having formed into a broadening wedge. The ratio touched support at a gap fill, the edge of the cup, and down sloping support. If the current downsloping wedge breaks out, the measure move would be to the previous all-time high, which would be about a 100% outperformance of silver juniors over the next year or so.
$silj
$xle
I followed you for a while, Mark. I find your negativity helpful as it keeps balance with all the BS out there. In this situation, however, you’re missing part of the point. MSA does a very good job at helping us out. I’ve had many services I’ve paid for. None of them are perfect. And neither is MSA. But they do a good job. Assuming that all they do is point to $300 targets is not accurate.
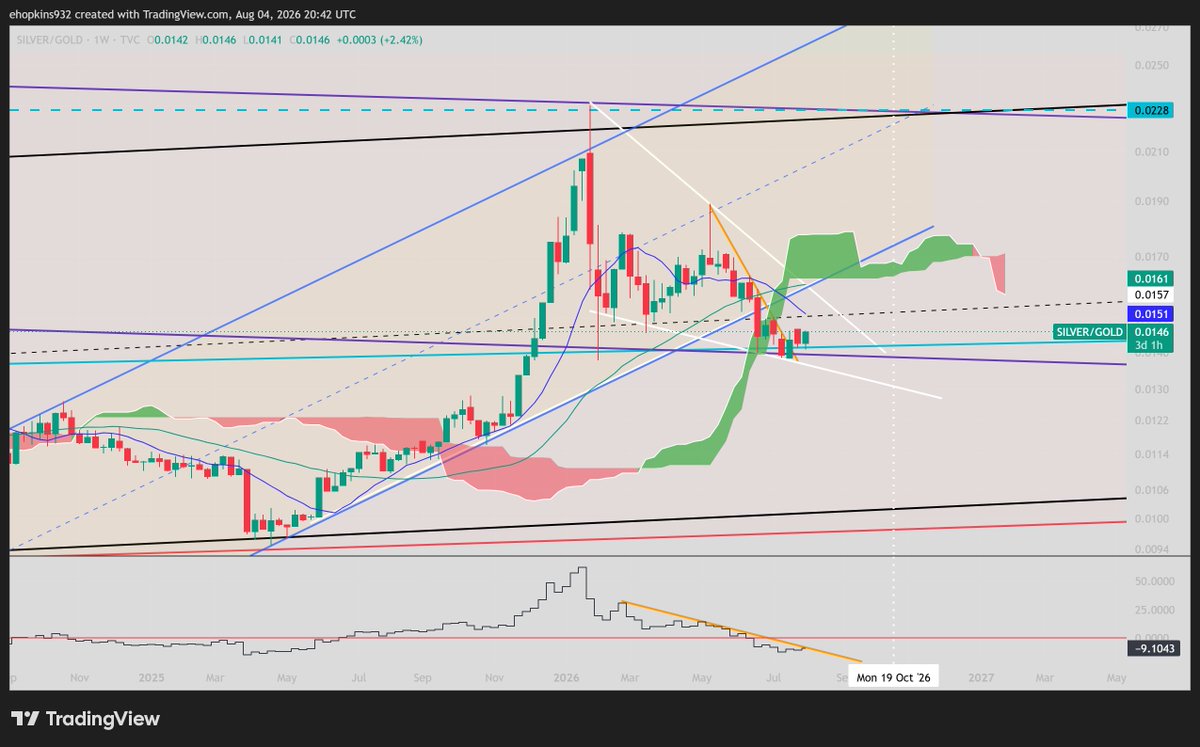
Silver vs Gold Ratio
White descending wedge forming on the weekly. Starting to look positive, with a breakout over the orange resistance line. Also a back test of support holding (purple line).
Zooming out on the quarterly for the more macro structure. The ratio is in a big rounded basing pattern since the 1980 peak. Price is currently trading within the black and also the larger white parallel channel. The white channel looks to be validated by touch points respecting the 50% line. Any touch again to the top of this white channel could be the secular peak for this bull run in silver. For this one to match the 1980 peak, a touch of the upper white channel would occur sometime in Q4 of 2031 or Q1 of 2032.
But first, price needs to break out of the wedge on the weekly time frame, and then the next major resistance will be the downsloping purple line that has marked major peaks so far, as well as the black parallel channel.
$slv $gld
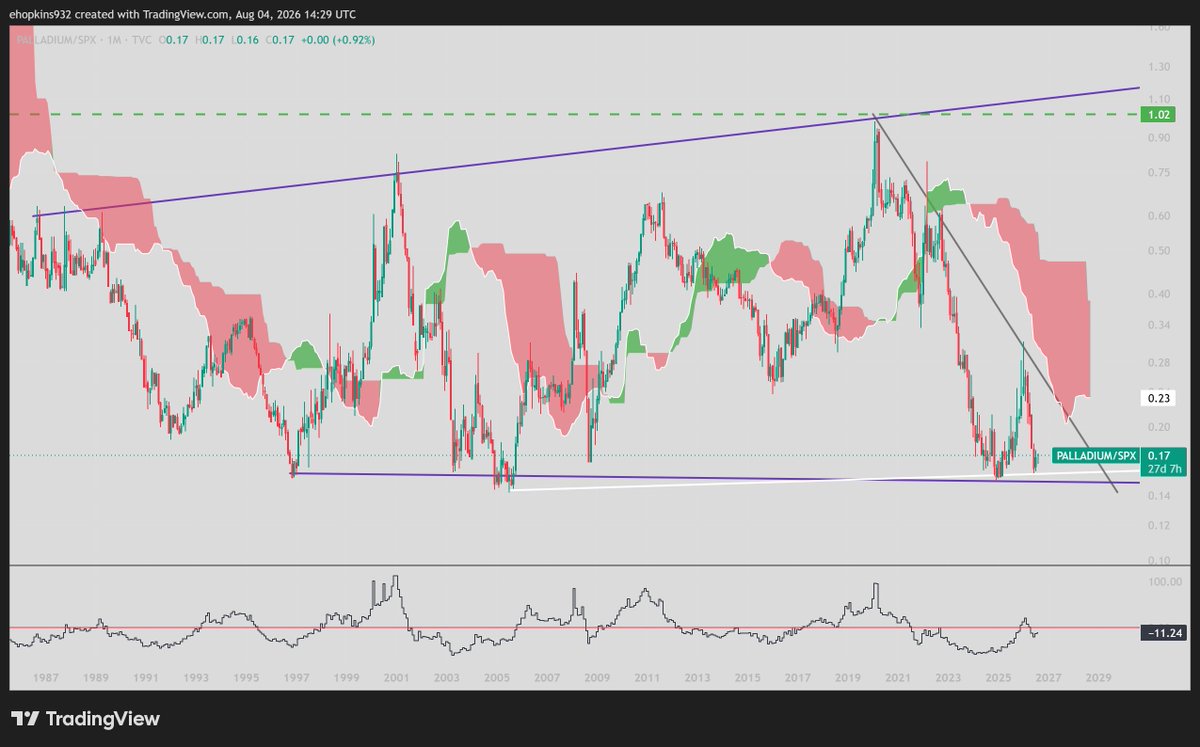
Palladium
Breaking out of a descending wedge after having topped off a cup pattern and backtested long-term support. Targets are about 2400 and 3000.
Note the ratio charts versus gold, silver, and SPX respectively. It's at the bottom of long-term structures at the ratio chart, while showing a bullish breakout on its own chart.
Long-term target for $4,500 (maybe take until 2030 or early 2030s).
$PALL
OIL +SILVER
On the monthly-close line chart, consolidation and continuation move patterns are clearly shown for the past 100 years. The current consolidation and measure moves, as well as Fibonacci confluences, put a target of a monthly close of $530. Target on the candle chart points to $570 intramonth.
Given previous trending moves, this target could be hit sometime in late Q1 or early Q2 of 2032. Possibly looking at something like $360 silver and $200 oil, more or less.
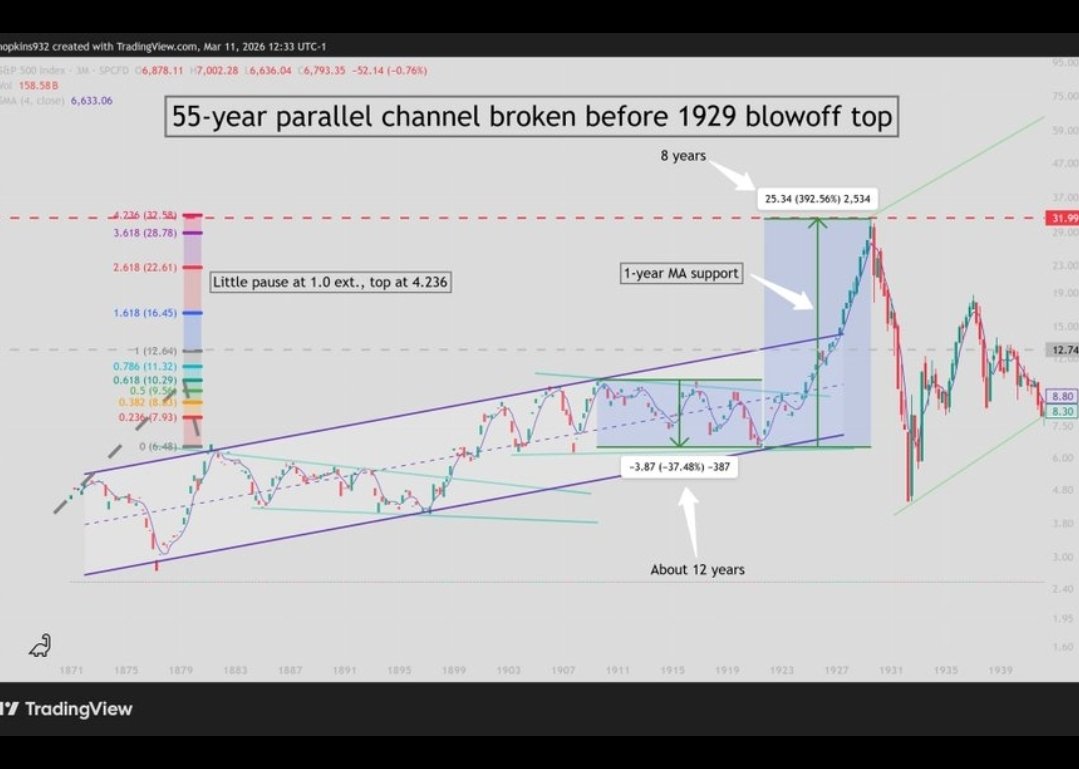
There is a strong analog here to how the SPX traded prior to the 1929 blowoff top (chart attached). Prior to the 1929 peak, the SPX formed a pair of bull flag/pennants that spanned 50 years, setting the stage for the blow off top. We're seeing a very similar (and extremely rare) setup in oil + silver.
$uso $slv