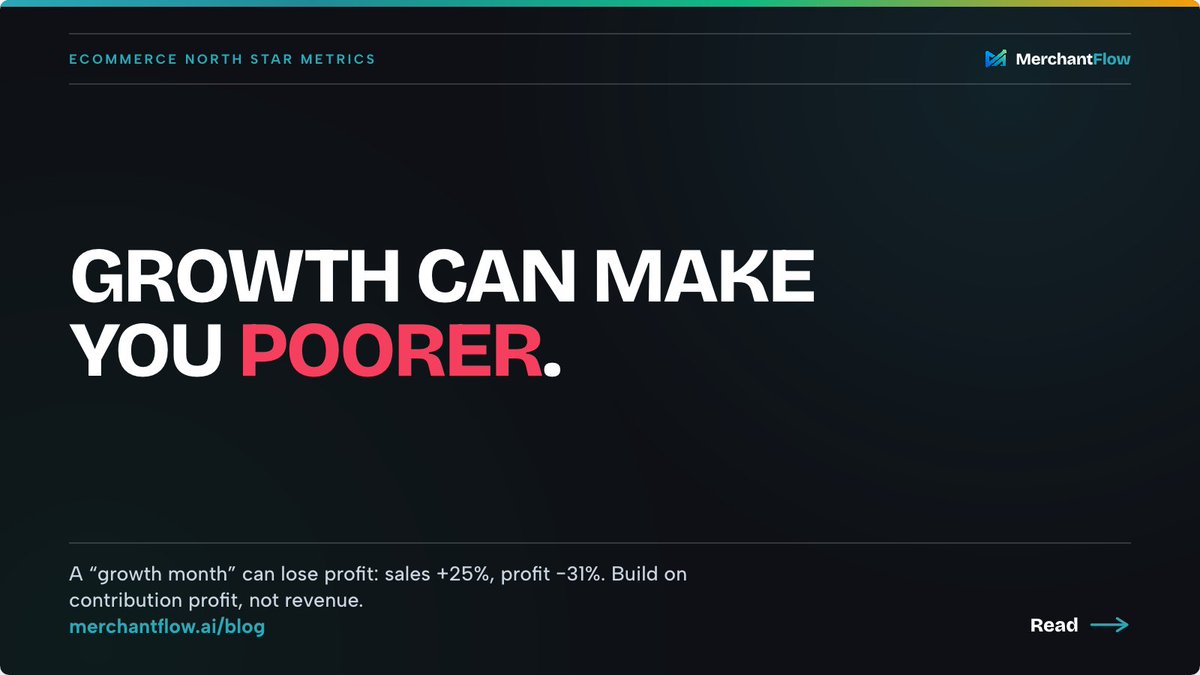
Growth can make you poorer.
A real month: sales +25%, profit -31%.
Revenue and ROAS reward activity. They do not tell you what the sale left behind.
The fix is one North Star: contribution profit.
= net sales - COGS - fulfillment - fees - returns - ad spend
Full guide: https://t.co/yS0ZGqhVKo
Revenue is not what your store is worth.
Adjusted profit x multiple = value.
The formula is simple. The inputs are where founders get it wrong:
→ outdated COGS
→ ad spend split across platforms
→ refunds left out
→ best-sellers that are not profitable
Full guide: https://t.co/ndAnIvuh6F
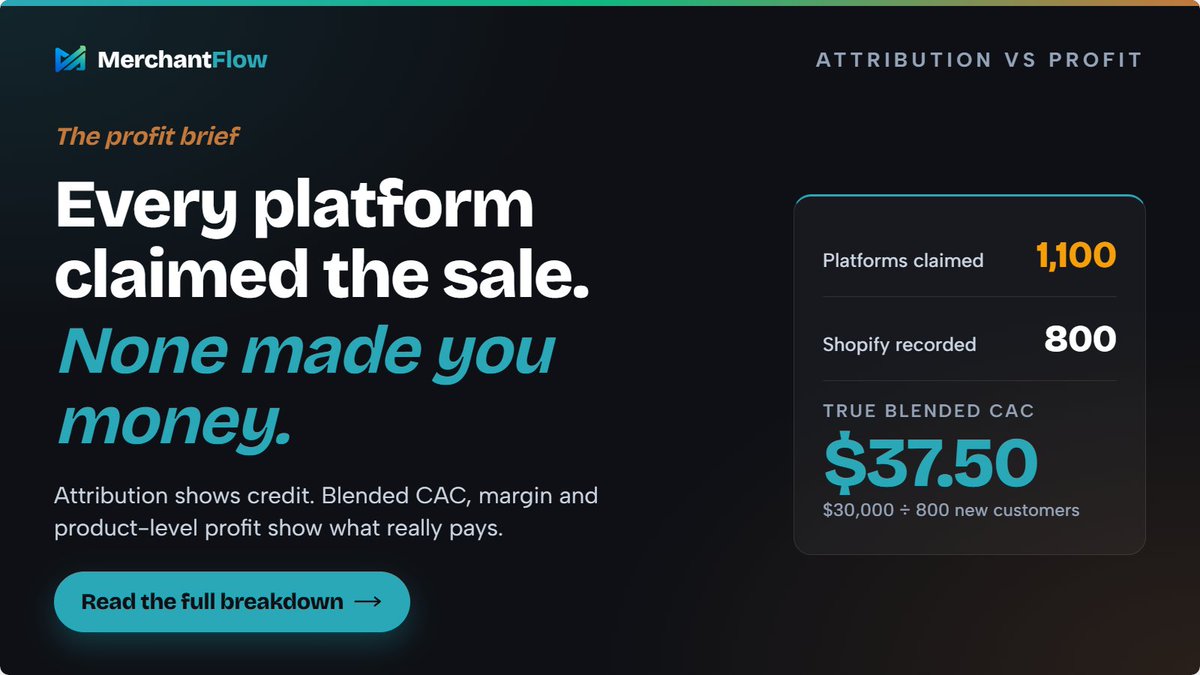
Every platform claimed the sale.
None of them made you money.
3 platforms claimed 1,100 new customers. Shopify recorded 800.
True blended CAC: $30,000 ÷ 800 = $37.50
Attribution shows credit. Blended CAC shows profit.
Read the full breakdown on our blog 👇
https://t.co/F0LgjR8mFI
Every platform wants the credit.
Your business needs the profit.
Attribution is directional. Blended CAC, live P&L, COGS, fees, refunds and ad spend tell you whether growth is actually working.
Stop chasing platform-reported wins.
Measure what the store actually keeps.
A 7% cut to product cost on an $80 SKU:
$32.00 → $29.76
Saved per unit: $2.24
Across 3,000 units/mo: +$6,720
Better COGS is the margin lever most brands skip.
New blog: how to negotiate it (and where to start).
https://t.co/lvxKqPpI86
Your highest-revenue country may not be your most profitable.
US: $65,000 revenue → 6.1% margin
AU: $40,000 revenue → 25.8% margin
The biggest market isn't always the one keeping money.
Margin by region. New on the blog ↓
https://t.co/wpshCf3m8d
That "verified live" part? That's us.
MerchantFlow is the connection that turns a revenue claim into a revenue fact. @TrustProfit_ is what happens when we point that at the whole market. 👇
Anyone can claim $2M/mo. Almost nobody can prove it.
TrustProfit ranks ecommerce stores by revenue that's actually verified - live, through @MerchantFlowAI's connection to Shopify & WooCommerce.
Real stores. Real numbers. Open to offers.
https://t.co/oROPPL0x4X
We’re live on Product Hunt today.
MerchantFlow helps ecommerce brands answer the question most dashboards avoid:
“Which products are actually making money after ads, fees and COGS?”
We'd really appreciate your feedback on the launch:
https://t.co/e8jzCyNdbN
#ProductHunt #Ecommerce #Shopify
Blended ROAS = Total revenue ÷ Total ad spend.
One number. One question:
Is your ad spend creating profitable growth?
Platform ROAS manages campaigns.
Blended ROAS manages the business.
New blog post: how to use it (and where it misleads).👇
https://t.co/WWoc8MQo83
MerchantFlow is officially live on the Shopify App Store!🎉
A huge thank you to every beta tester who helped shape the platform with real stores, real feedback and real operating questions.
During beta, MerchantFlow tracked 120k+ orders and processed $25M+ AUD in Gross Merchandise Value.
Now Shopify merchants can see real profit per order, true ad ROI, COGS, and hidden fees all in one place.
Install here:
https://t.co/NlEXYtL6dG
#Shopify #Ecommerce #MerchantFlow
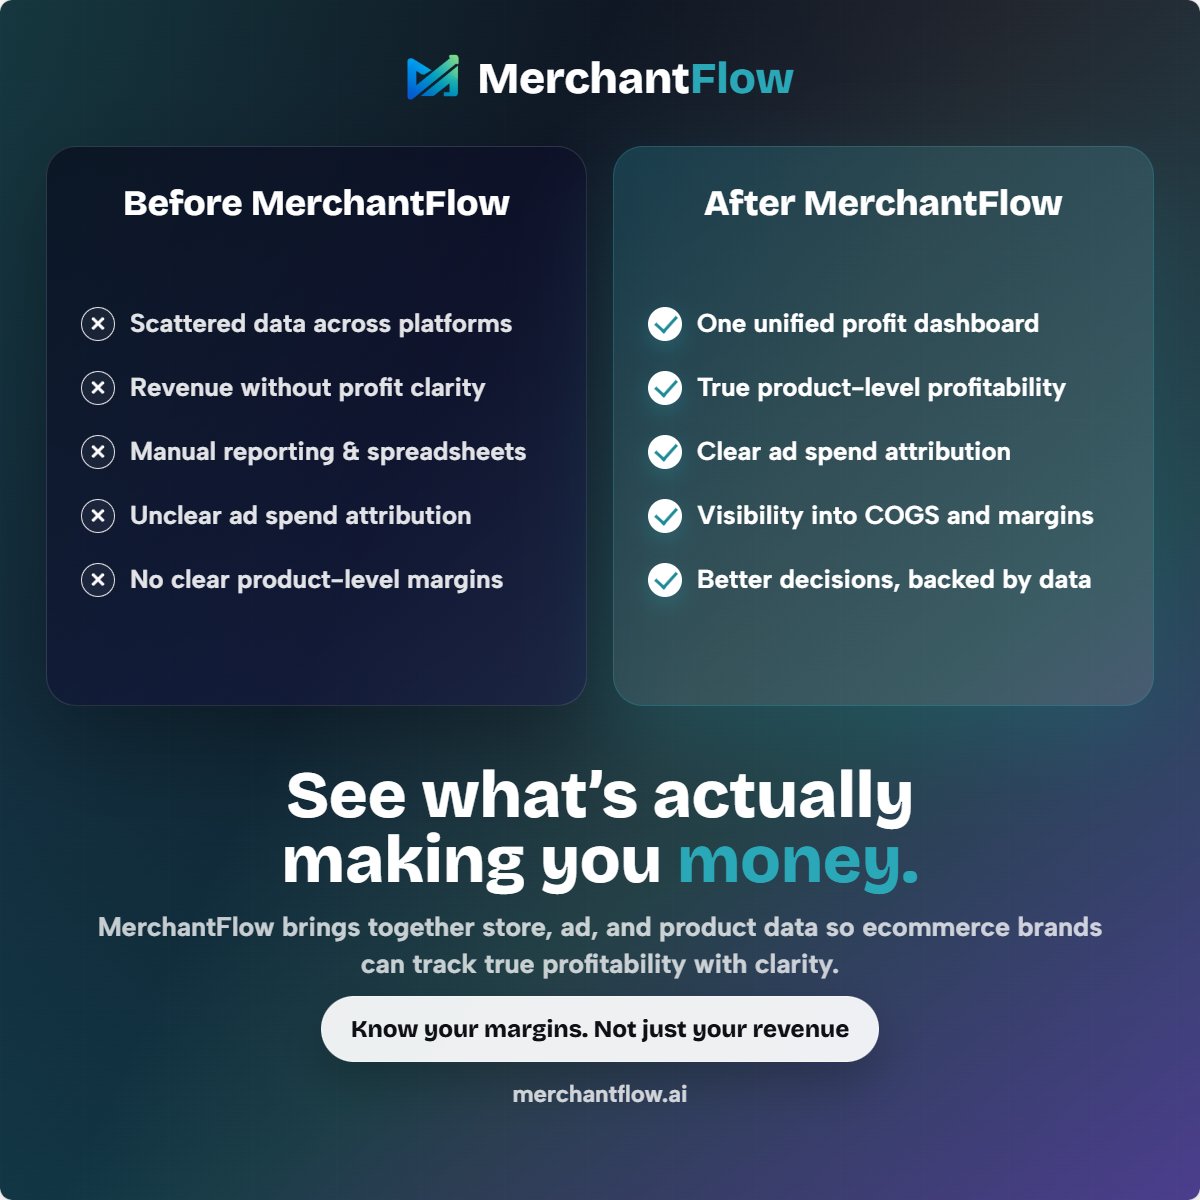
Before MerchantFlow:
Scattered tools, manual spreadsheets and revenue without real profit clarity.
After MerchantFlow:
One clear view of product-level profitability after ads, COGS and costs.
Revenue tells you what sold.
MerchantFlow shows what actually made money.
#MerchantFlow #EcommerceAnalytics #Shopify #ProductProfitability #DTC #EcommerceGrowth
Meta ROAS can look healthy while profit stalls.
Before you scale, check:
→ product margin
→ break-even ROAS
→ new customer CAC
→ refunds and returns
→ profit after ads
The real question:
What did the campaign actually keep?
read the full breakdown here: https://t.co/MSCvl3EBIl