A $55 bottle with a 65% margin.
You keep $9.80 of it.
Freight and duty turn a $16 supplier price into $19.20 COGS. Then ads ($17), shipping ($7) and fees ($2) take the rest.
COGS is where profit starts, not where it ends.
Introducing ecommerce for Muse!
Muse can finally connect to your entire ecommerce stack.
Now Muse has access to:
> Shopify + WooCommerce
> Meta Ads, Google Ads, TikTok Ads + Snapchat Ads
> Klaviyo
> Your COGS, refunds + order costs
> Fulfilment + shipping data from your 3PLs
So Muse can answer:
> What did I actually make last month?
> Which products lost money after ads + costs?
> Which channels are actually profitable?
> What should I scale?
> Where is my margin disappearing?
Muse already understands marketing.
Now it can understand the economics of your entire ecommerce business.
Connect it in 30 seconds:
https://t.co/WbC1QLEn3D
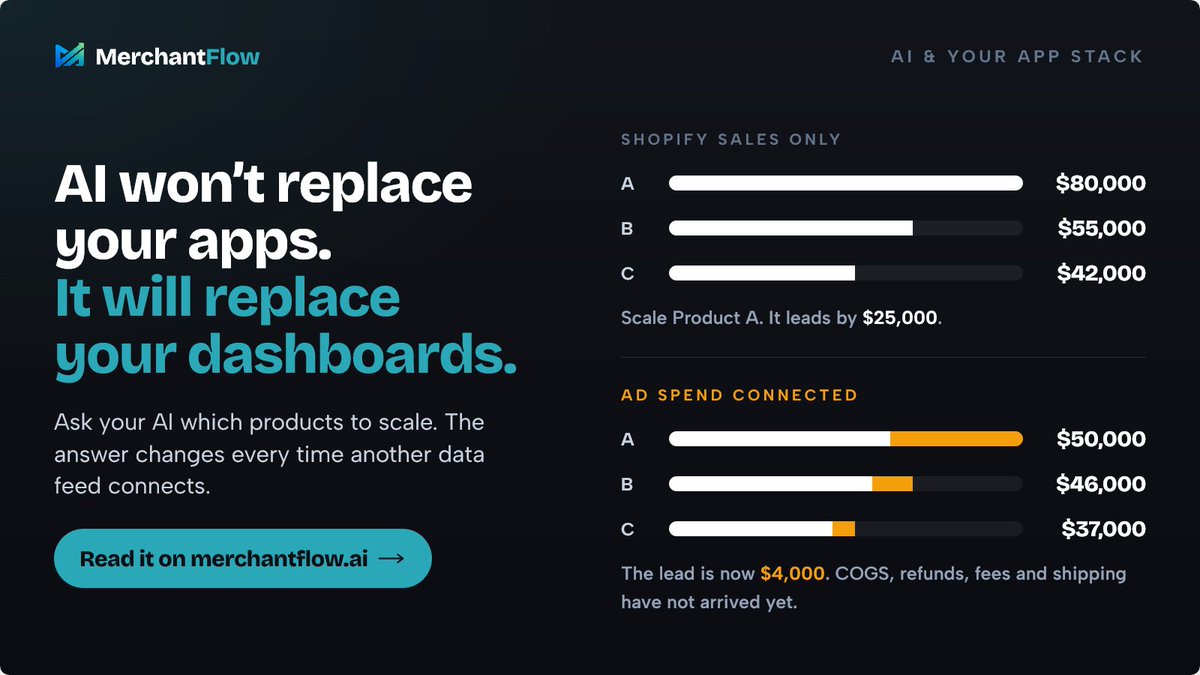
AI won’t replace every Shopify app.
But it will change which ones are still worth paying for.
If an app’s main value is the interface, AI can probably absorb more of that.
If it owns the data, integrations or calculations underneath, AI may make it even more valuable.
That is the real shift.
AI is the interface. Not the infrastructure.
We unpacked it here:
https://t.co/z7J1nIp8yI
#Shopify #Ecommerce #AI #MerchantFlow
Revenue is easy to check from your phone.
Profit shouldn't require a spreadsheet and a laptop.
MerchantFlow is now on iPhone + Android 📱
Revenue. Ad spend. COGS. Net profit. Product profitability.
Know what your store actually made, wherever you are.
Shopify says $200,000 revenue. Your products cost $72,000.
That is not $128,000 of profit. In this example the store kept $12,500.
Where it goes:
→ landed cost, not factory cost ($18 becomes $23)
→ break-even ROAS is 2.04x, not 1.54x
→ every $100 refund also burns $49 you never get back
→ gross, contribution and net are three different numbers
Full guide: https://t.co/zjv4oq9RTk
Revenue fell 3%. Contribution profit fell 55%. Same day.
→ Revenue $20,000 to $19,400
→ Ad spend $5,000 to $6,150
→ Contribution profit $5,000 to $2,250
The dashboard only reports the first line.
New blog 👇
https://t.co/mgZ0cZ7fJz
4.6x ROAS. So why is there less money in the bank?
Two campaigns, same 4x ROAS:
→ Campaign A: $6,000 contribution
→ Campaign B: $12,000 contribution
Same efficiency on paper. 2x the profit in the bank.
Report profitable growth, not platform ROAS.
New blog 👇
https://t.co/OsLGqtL4EF
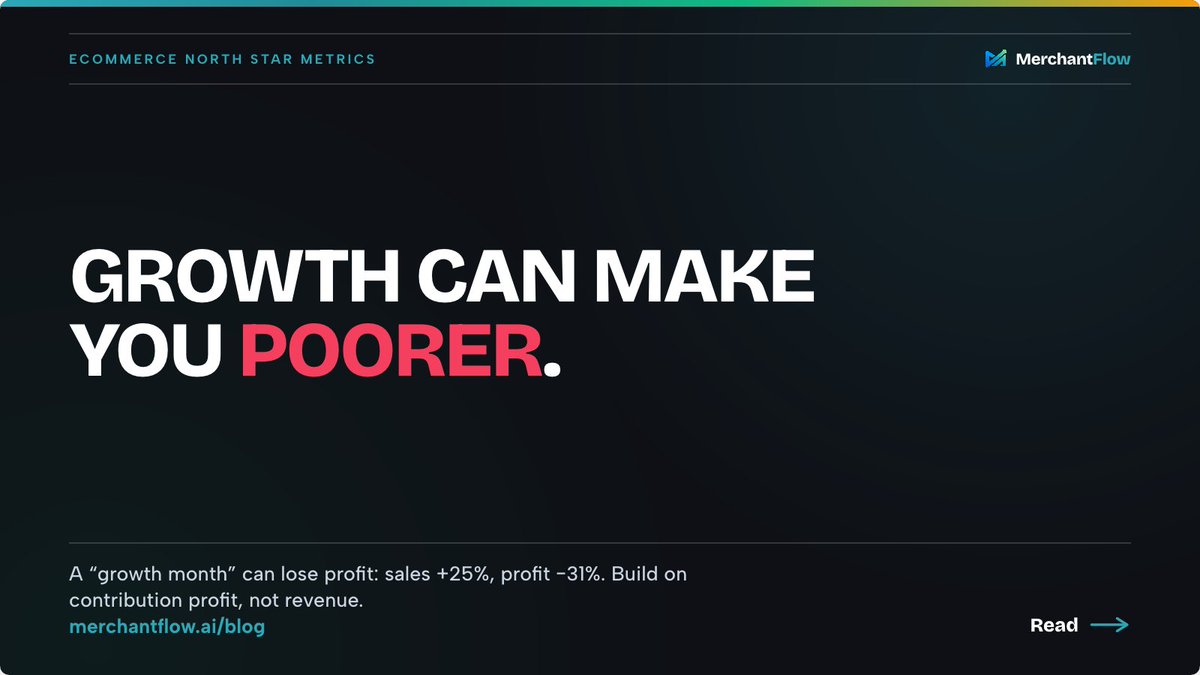
Growth can make you poorer.
A real month: sales +25%, profit -31%.
Revenue and ROAS reward activity. They do not tell you what the sale left behind.
The fix is one North Star: contribution profit.
= net sales - COGS - fulfillment - fees - returns - ad spend
Full guide: https://t.co/yS0ZGqhVKo
Revenue is not what your store is worth.
Adjusted profit x multiple = value.
The formula is simple. The inputs are where founders get it wrong:
→ outdated COGS
→ ad spend split across platforms
→ refunds left out
→ best-sellers that are not profitable
Full guide: https://t.co/ndAnIvuh6F
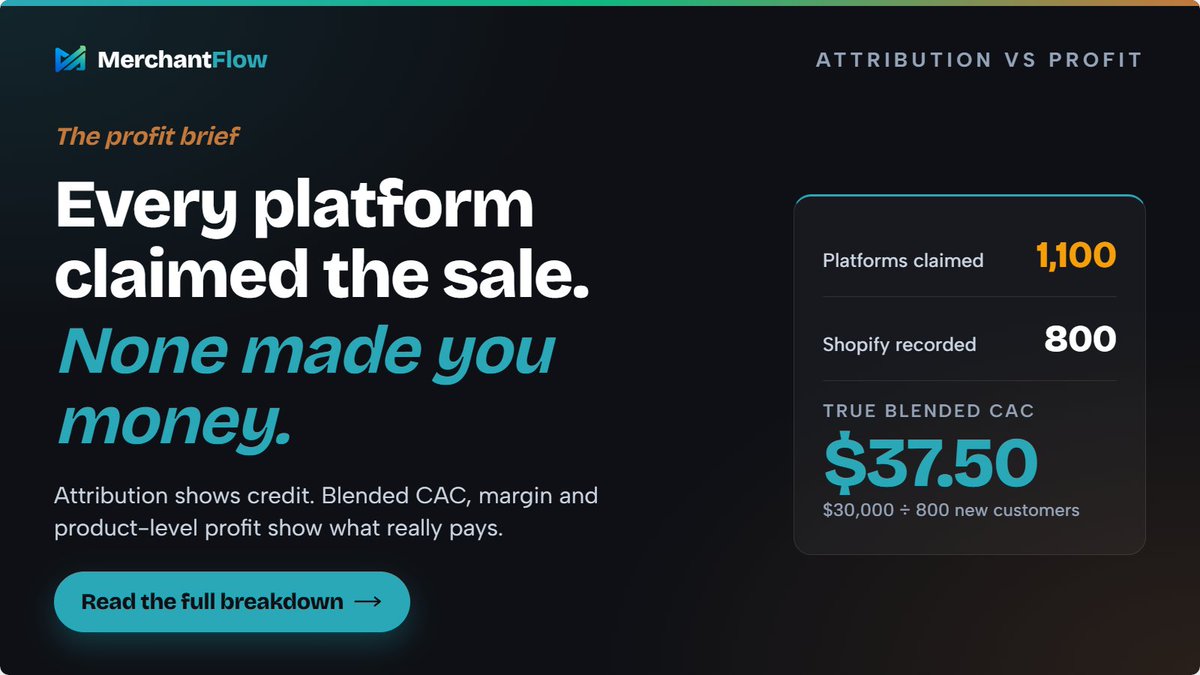
Every platform claimed the sale.
None of them made you money.
3 platforms claimed 1,100 new customers. Shopify recorded 800.
True blended CAC: $30,000 ÷ 800 = $37.50
Attribution shows credit. Blended CAC shows profit.
Read the full breakdown on our blog 👇
https://t.co/F0LgjR8mFI
Every platform wants the credit.
Your business needs the profit.
Attribution is directional. Blended CAC, live P&L, COGS, fees, refunds and ad spend tell you whether growth is actually working.
Stop chasing platform-reported wins.
Measure what the store actually keeps.
A 7% cut to product cost on an $80 SKU:
$32.00 → $29.76
Saved per unit: $2.24
Across 3,000 units/mo: +$6,720
Better COGS is the margin lever most brands skip.
New blog: how to negotiate it (and where to start).
https://t.co/lvxKqPpI86
Your highest-revenue country may not be your most profitable.
US: $65,000 revenue → 6.1% margin
AU: $40,000 revenue → 25.8% margin
The biggest market isn't always the one keeping money.
Margin by region. New on the blog ↓
https://t.co/wpshCf3m8d
That "verified live" part? That's us.
MerchantFlow is the connection that turns a revenue claim into a revenue fact. @TrustProfit_ is what happens when we point that at the whole market. 👇
Anyone can claim $2M/mo. Almost nobody can prove it.
TrustProfit ranks ecommerce stores by revenue that's actually verified - live, through @MerchantFlowAI's connection to Shopify & WooCommerce.
Real stores. Real numbers. Open to offers.
https://t.co/oROPPL0x4X
We’re live on Product Hunt today.
MerchantFlow helps ecommerce brands answer the question most dashboards avoid:
“Which products are actually making money after ads, fees and COGS?”
We'd really appreciate your feedback on the launch:
https://t.co/e8jzCyNdbN
#ProductHunt #Ecommerce #Shopify
Blended ROAS = Total revenue ÷ Total ad spend.
One number. One question:
Is your ad spend creating profitable growth?
Platform ROAS manages campaigns.
Blended ROAS manages the business.
New blog post: how to use it (and where it misleads).👇
https://t.co/WWoc8MQo83
MerchantFlow is officially live on the Shopify App Store!🎉
A huge thank you to every beta tester who helped shape the platform with real stores, real feedback and real operating questions.
During beta, MerchantFlow tracked 120k+ orders and processed $25M+ AUD in Gross Merchandise Value.
Now Shopify merchants can see real profit per order, true ad ROI, COGS, and hidden fees all in one place.
Install here:
https://t.co/NlEXYtL6dG
#Shopify #Ecommerce #MerchantFlow