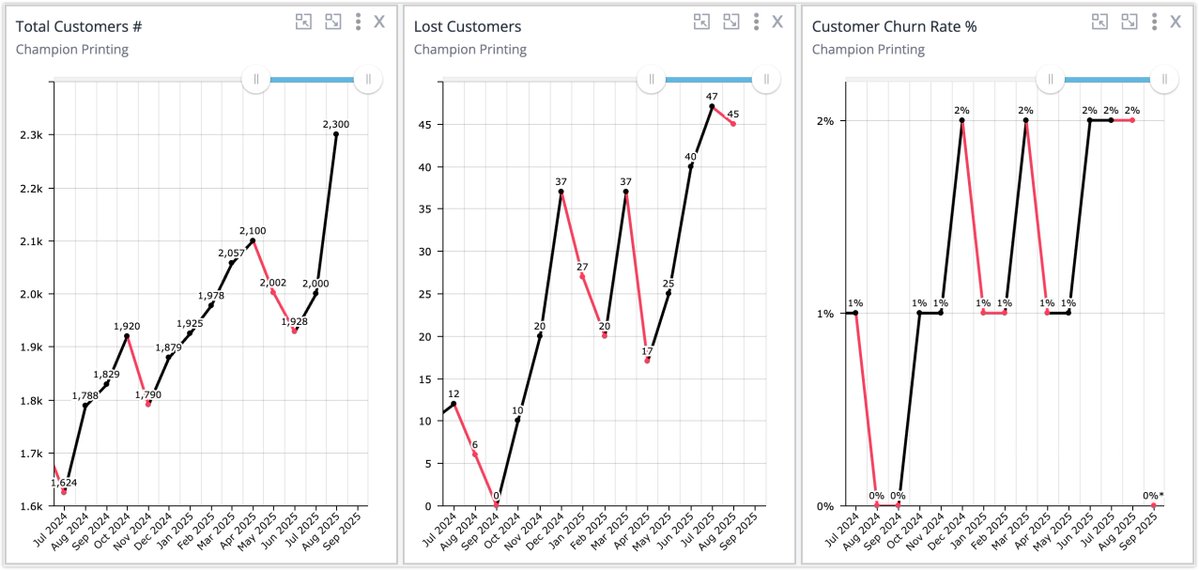
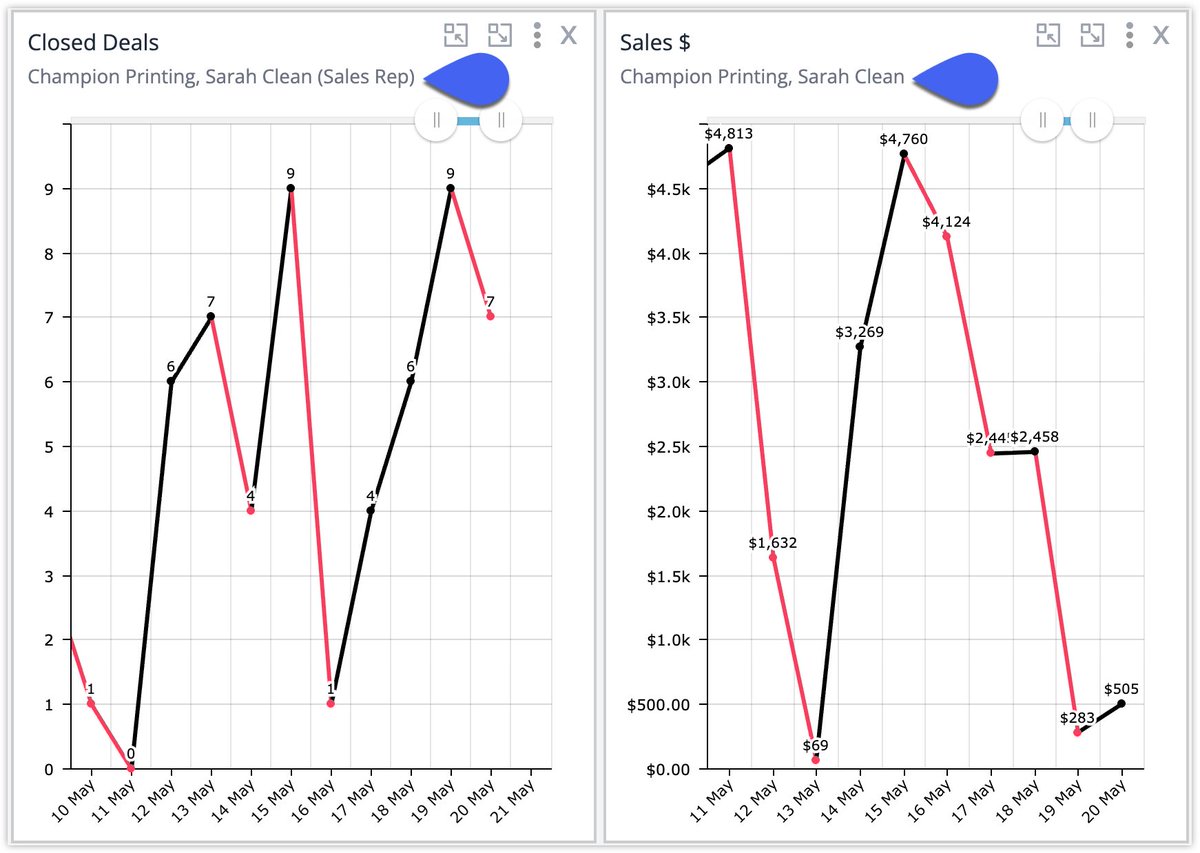
Customer Churn Rate is the percentage of customers who stop doing business with a company during a specific time period.
It’s a key health indicator for any recurring revenue or customer-centric business.
To track Customer Churn Rate, see:
https://t.co/sxWW8TDntz
#stats
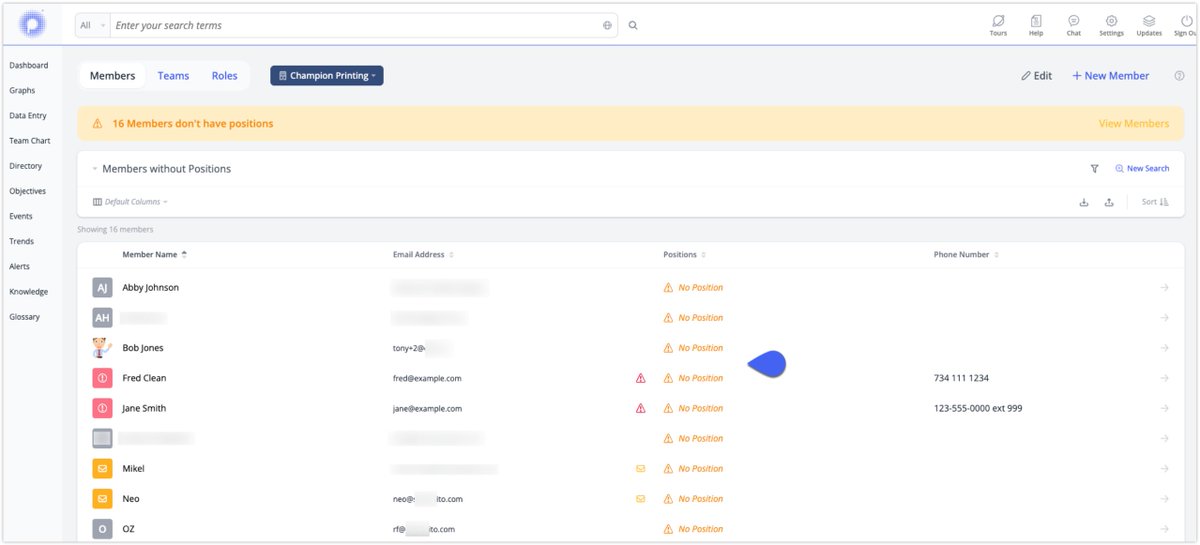
If you’ve ever gone through your Team Chart trying to find out who’s missing by counting each member, you are not the only one.
We’ve built a feature which quickly shows you the members that don’t have a position:
https://t.co/HJGOVNm2Vo
#TeamChart
How to Find Unused Graphs
It's a good practice to check every now and then if there are any unused graphs in your day to day operations.
The video below shows you how you can easily find unused graphs in the past month.
https://t.co/weSIw5U4lA
#graphs#stats
If you want to calculate the Total Sales for the last 12 months, you can do it with a Rolling graph.
To create a Rolling graph, see:
https://t.co/FDSUMki0r6
#graphs#Stats#Statistics
🚀 Turn your network into recurring revenue!
With the MetaPulse Affiliate Program, earn 30% recurring commission for the lifetime of every customer you refer.
No caps. Just an opportunity to grow with MetaPulse.
👉 Learn more: https://t.co/OLDDojzVGW
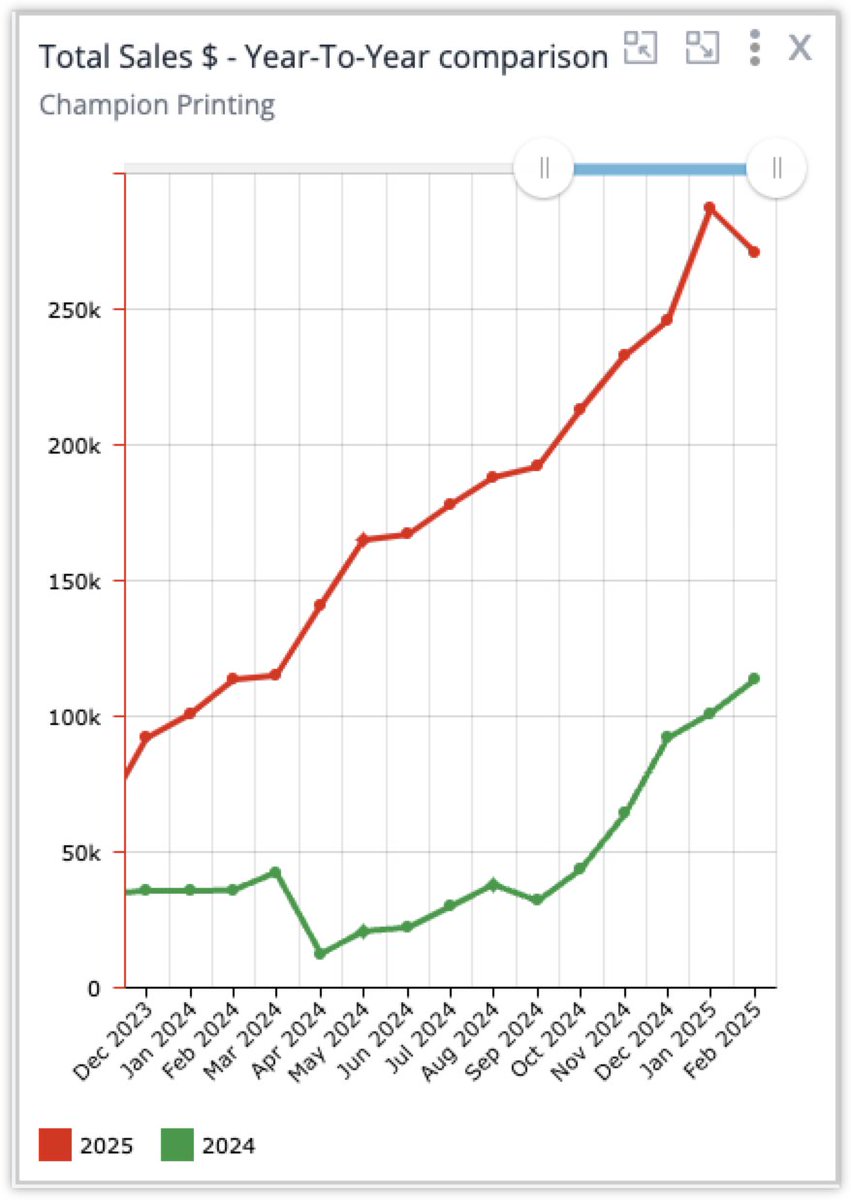
If you are measuring Sales in your business, it's useful to compare this year's Income with the last one. In MetaPulse, this is possible with the help of Comparison graphs.
To create a Year-To-Year Comparison graph, see:
https://t.co/IikSMwICLy
#graphs#Stats#Statistics
Markdown is a user-friendly way of formatting a text on web pages.
In MetaPulse, most input fields accept markdown. For example, you can make a text bold or italic in specific fields on the Team Chart.
To use Markdown, see:
https://t.co/cSEva1Jdx8
#team_chart#org_chart
NEW in MetaPulse 🚀
You can now import multiple quotas & targets onto your graphs using a CSV file.
Set up multiple periods at once instead of entering them individually.
See how to format your CSV 👇
https://t.co/Jwus2qipAo
Are you interested in achieving hypergrowth (extremely rapid growth) in your business?
If you are not using OKRs (Objectives and Key Results) in your business, it's never too late to start.
To create an OKR in MetaPulse, see:
https://t.co/ST9IYuegwF
#OKR#Objectives
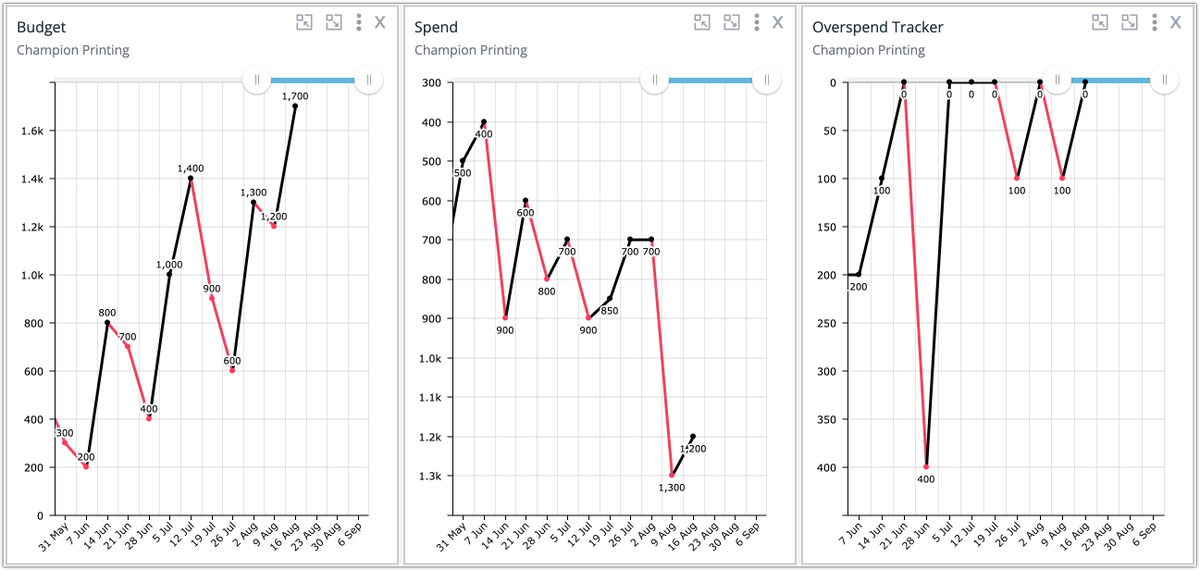
Stop finding out you overspent after it's too late.
Our Overspend Tracker flags it automatically, in real time. 📊
For more info, see:
https://t.co/7IKVduZA54
🎯 Quick MetaPulse tip:
Set a target for the current period directly from any graph.
Just right-click → Set Current Target → enter your target → Save.
Your target appears right on the graph, making progress easy to track.
👉 https://t.co/7qRrcrk5qo
You can hide a graph in MetaPulse.
The hidden graph doesn't show up in Search but can be used as part of the formula in a calculation graph or as the Key Result of an Objective.
To hide a Graph, see step 14: https://t.co/VRv1o9GOas
#graphs#stats
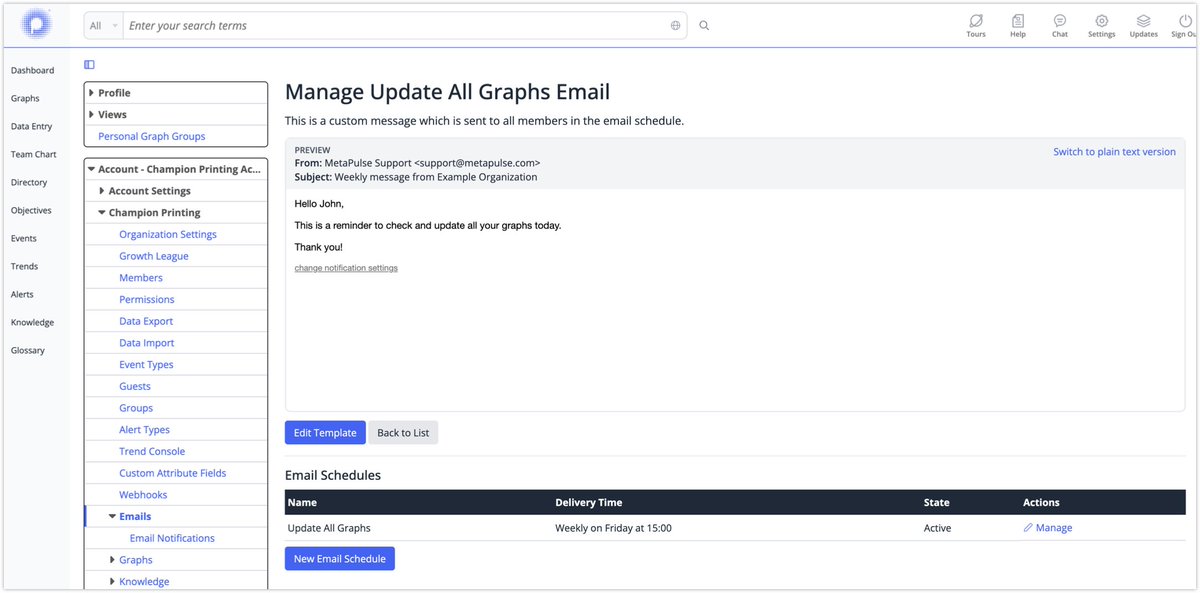
Stop sending weekly reminders manually.
📊 Create a Custom Email Template and schedule it to all or specific emplyees.
Example: “Enter your weekly stats” every Monday at 9 AM.
Set it once. Done.
https://t.co/huxkNjdlO1
Clear roles = fewer misunderstandings.
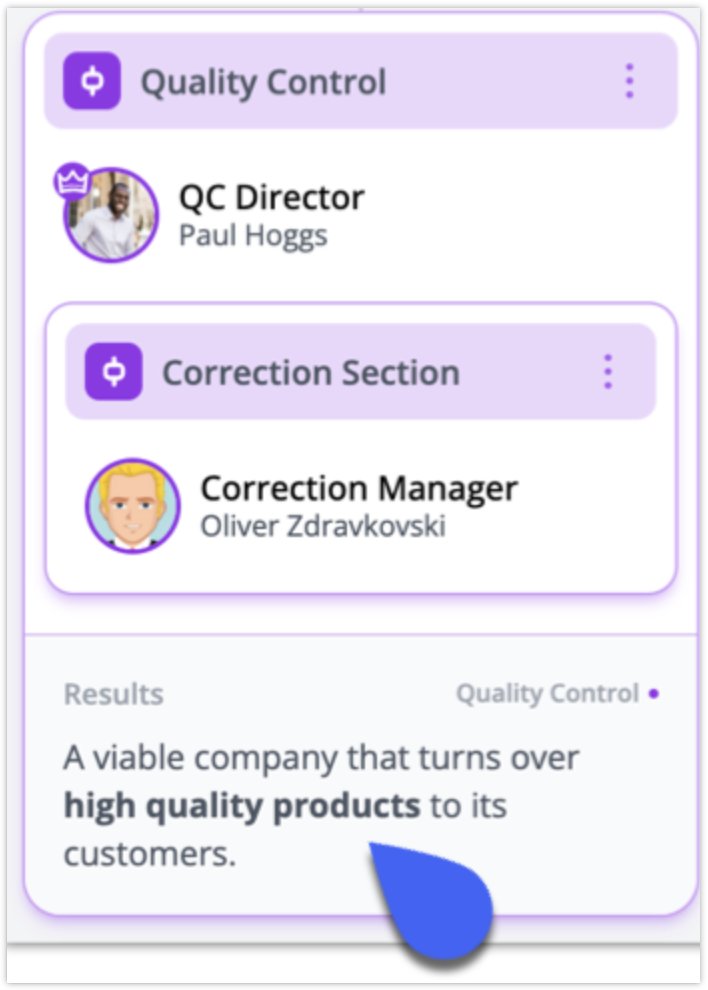
Add a Purpose, Function, and Results to every role in your Team Chart so everyone knows exactly what they're responsible for.
Less overlap. More accountability.
Learn more 👇
https://t.co/B3q9TL88VE
Know someone who'd love MetaPulse?
Earn 30% recurring commission for every customer you refer.
Start here 👇
https://t.co/OLDDojznRo
#AffiliateMarketing#SaaS
Need to store extra information for your Graphs, Members, or Positions?
🏷️ Custom Attribute Fields let you create your own fields using text, numbers, dates, Yes/No, time, and more.
Learn more:
https://t.co/50KT3Qmcma
#MetaPulse#BusinessGrowth#Productivity#Management
Avoid rumor, hearsay, and gossip. Get everything in writing and evaluate it against your actual statistics with Alerts.
Discover a simpler way to identify positive actions, eliminate the noise, and focus on what matters most. 📉➡️📈
Learn more: https://t.co/lZPmLRUzdu
Adding custom terms for your team Chart allows you to rename the default terms, such as:
Team Chart
Team
Role
Position etc.
If you replace "Team Chart" with "Company Chart", "Company Chart" will be displayed in the app.
To add custom terms, see:
https://t.co/OPBQVR4Kob
Created the perfect Graph View?
Don't let everyone recreate it from scratch.
Share your View with your teammates so everyone can access the same group of graphs in seconds.
Learn how:
https://t.co/8CQz1rqBIl
#MetaPulse#Dashboard#BusinessIntelligence#Productivity
Keep graph ownership clear.
Assign graphs to positions or members so the right people can update and monitor performance metrics.
Using a Team Chart? Assigning graphs to positions helps preserve ownership even when team members change.
Learn how:
https://t.co/tkIVVRaBgb