This account uses a custom model to forecast daily ridership on the Washington Metrorail and then compares to actual figures when published. Created by @dcadamb
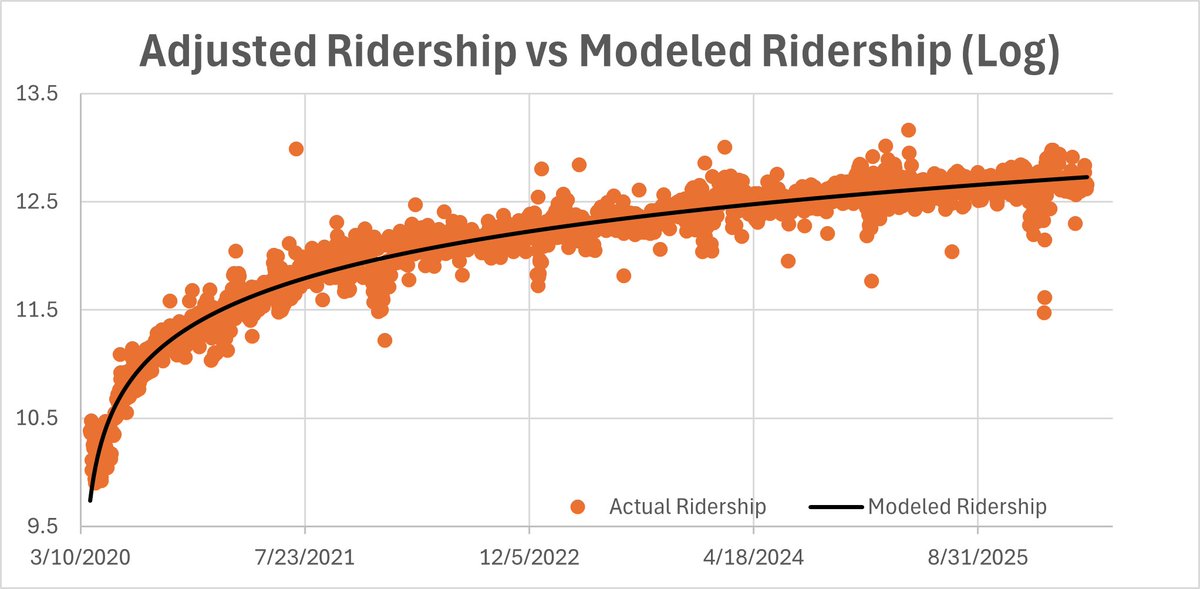
Not sure how many people would be interested in this, but figured I'd share: I made a regression model to forecast ridership on the DC Metrorail. And I am pretty pleased how it turned out! If you want to see how the model is designed and learn some fun discoveries, 🧵 below:
I am developing Version 2.0 of the Metrorail Ridership Model — now’s your opportunity to share your ideas: what new parameters would you like to see added to the model?
Share below 👇 ✍️📝
@Aden_Yacobi@dcadamb … for historic rail & bus headway data. Population and employment numbers might not be available as frequently, but could be updated quarterly/annually if possible
@Aden_Yacobi@dcadamb I like these suggestions a lot! As you recognize, each of these are macro factors that will shape the long term trends, although possibly drowned out with day-to-day factors. Maybe worth measuring a 28-day moving average? Data could probably be acquired thru MetroHero/MetroPulse
Also, I will add parameters to account for weather. There will be dummies for temperature high, amount of rain, amount of snow, and any snow depth (some of this, especially snow, might already be accounted for in the “OPM status” parameter, but it can’t hurt to break it out)
Currently, I am planning on adding a new parameter for events at the RFK parking lot. Events are huge traffic drivers to 🔵⚪️🟠Stadium-Armory, but this is unaccounted in the model. Days without events are slightly overestimated, while days with events are extremely underestimated
The most accurate station prediction was ⚪️Innovation Center (0.01% error🎉🎉🎉) & the least accurate station prediction was 🔴Medical Center (-903% error). The station with the highest ridership was 🔴Union Station (18,948), as predicted
The actual systemwide ridership on Monday, July 20, 2026 was 447,714, a -15.10% error from the forecast. This is the 60th most accurate forecast since the model began on 5/2/2026 (75th percentile)
On Monday, July 20, 2026 there are no special events in the Washington region and the Summer 🔴Red Line construction continues 🏗️. The Metrorail Ridership Model forecasts that there will be 515,318 passengers systemwide & the most used station will be 🔴Union Station (23,237)
On Monday, July 27, 2026 there is a home Nationals game and the Summer 🔴Red Line construction continues 🏗️. The Metrorail Ridership Model forecasts that there will be 545,182 passengers systemwide & the most used station will be 🔴Union Station (23,281)
The most accurate station prediction was 🔴Farragut North (0.11% error) & the least accurate station prediction was 🔵⚪️🟠Smithsonian (-153% error). The station with the highest ridership was 🔴NoMa-Gallaudet U (9,544)
The actual systemwide tapped ridership on Sunday, July 19, 2026 was 249,122, a -8.51% error from the forecast. This is the 43rd most accurate forecast since the model began on 5/2/2026 (54th percentile).
On Sunday, July 19, 2026 there are no special events in the Washington region and the Summer 🔴Red Line construction continues 🏗️. The Metrorail Ridership Model forecasts that there will be 249,122 passengers systemwide & the most used station will be 🔴🟢🟡Gallery Place (11,865)
On Sunday, July 26, 2026 there are home Nationals and Spirit games and the Summer 🔴Red Line construction continues🏗️. The Metrorail Ridership Model forecasts that there will be 269,428 passengers systemwide & the most used station will be 🟢Navy Yard-Ballpark (16,673)
The most accurate station prediction was 🔴🟢🟡Fort Totten (0.02% error) & the least accurate station prediction was 🔵Arlington Cemetery (-224% error). The station with the highest ridership was 🔴🟢🟡Gallery Place (10,400), as predicted
The actual systemwide tapped ridership on Saturday, July 18, 2026 was 256,353, a -34.13% error from the forecast. This is the 78th most accurate forecast since the model began on 5/2/2026 (100th percentile😰😰😰).
On Saturday, July 18, 2026 there are no special events in the Washington region & the Summer 🔴Red Line construction continues 🏗️. The Metrorail Ridership Model forecasts that there will be 343,837 passengers systemwide & the most used station will be 🔴🟢🟡Gallery Place (16,721)
On Saturday, July 25, 2026 there are home Nationals & DC United games, wrestling at CareFirst Arena & 🔴Red Line construction continues. The Metrorail Ridership Model forecasts that there will be 374,609 passengers systemwide & the most used station will be 🟢Navy Yard (26,215)
Exciting new project!
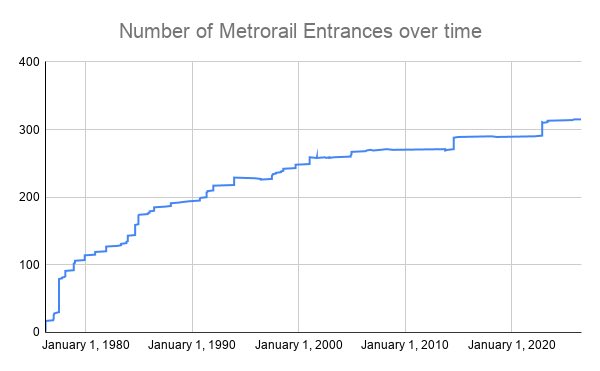
I spent the last couple weeks cataloging every Metrorail entrance, mezzanine, elevator & escalator (including former and future infrastructure)! If this is the type of thing that interests you, browse the comprehensive database here: https://t.co/RHktWmmZ6d
The most accurate station prediction was 🔵⚪️Morgan Boulevard (-0.66% error) & the least accurate station prediction was 🔴Medical Center (-846% error). The station with the highest ridership was 🔴Union Station (15,581), as predicted
The actual systemwide ridership on Friday, July 17, 2026 was 411,081, a -30.23% error from the forecast. This is the 76th most accurate forecast since the model began on 5/2/2026 (99th percentile 😰).
On Friday, July 17, 2026 there are no special events in the Washington region but the Summer 🔴Red Line construction continues 🏗️. The Metrorail Ridership Model forecasts that there will be 539,391 passengers systemwide & the most used station will be 🔴Union Station (22,393)
On Thursday, July 23, 2026 there are no special events in the Washington region and the Summer 🔴Red Line construction continues 🏗️. The Metrorail Ridership Model forecasts that there will be 393,650 passengers systemwide & the most used station will be 🔴Union Station (25,282)
On Friday, July 24, 2026 there is a home Nationals game and the Summer 🔴Red Line construction continues 🏗️. The Metrorail Ridership Model forecasts that there will be 570,651 passengers systemwide & the most used station will be 🟢Navy Yard-Ballpark (24,717)