It’s not Republican vs Democrat, it’s the people versus the state.
Pronouns: Sir/yessir/milord.
ACTUAL Liberal (look it up).
Used to be a true Democrat.
If you realize that in DC_ they see that they are our "farmers," and we are the livestock- it makes plenty of sense.
They bring in dumb, lazy, dependent illiterate sequestered clanned-up unassimilated fools . . . to crowd out & breed with we gun and ammo folks (who hate handouts and prefer to grow our own food).
Almost makes you feel bad for those DC farmers.
They have lost control and they know that the gig is up.
New waves of dummies are their only hope, just like introducing a virus into a healthy population, to keep us separated and weak. (Hmmm who has done that lmao!)
GOOD NEWS IS WE WILL WIN.
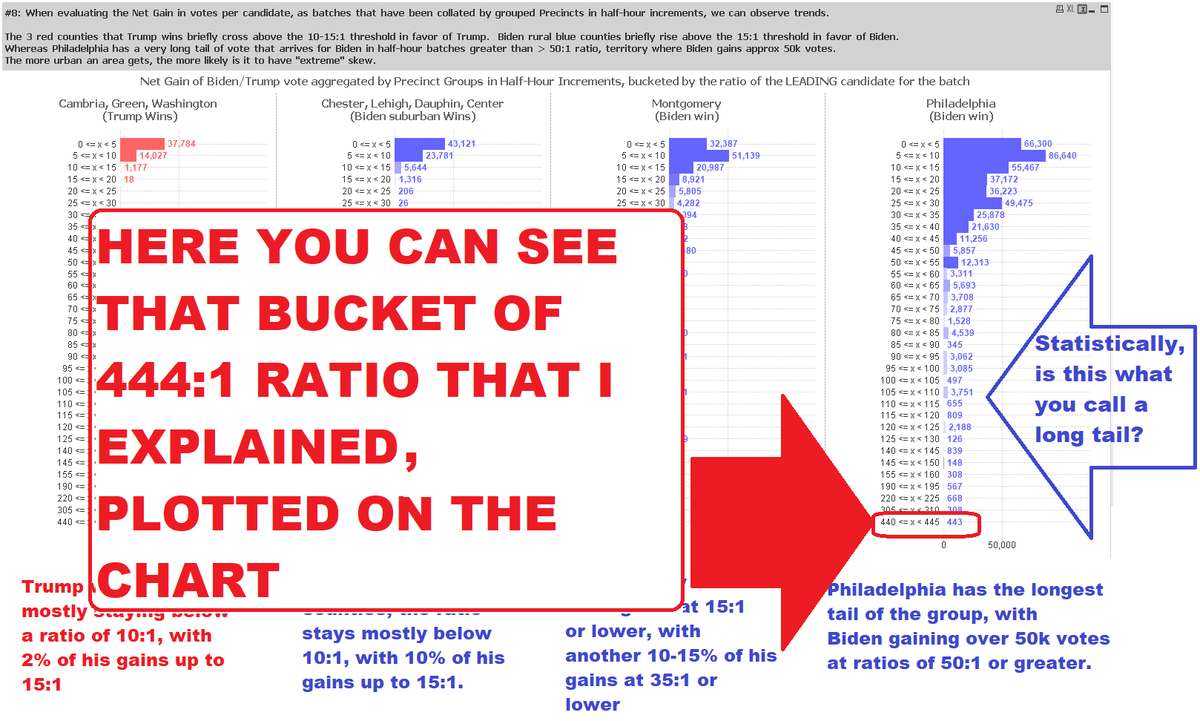
There's been several instances where people have challenged or inquired about the analysis I performed on the Philadelphia 2020 election data, findings that were conveyed via a series of frequency distribution charts shown here. (see attached images)
This analysis was constructed off what is considered the "real" data, there's no claims of an alternative set of ballot numbers. This premise is based off what was reported in the media & certified. It is notable for what analysis reveals inside this data set.
I've often cited the most extreme outlier of this analysis, a situation that revealed the Philadelphia 59-##'s series of precincts (25 precincts combined), that in the half-hour between 15:30-16:00, collectively reported a ballot update of 444 votes Biden : 1 vote Trump.
A 444:1 ratio. This represented the most extreme skew in how votes were observed arriving in heavily lopsided batches for Biden.
It is expected Biden would have significant advantages over Trump in Philadelphia, but how pronounced can those advantages tilt, before credibility is strained?
There's the "integrity premise" that once votes start arriving at ratios greater than 50:1 for a candidate, there is something off, that the election data is behaving like that of a dictatorship or 3rd world country.
Furthermore, in geographies where Trump wins (and solidly), the Trump advantage cannot go more than 19 votes for Trump before a Biden vote must appear in the same grouping and interrupt a Trump streak.
Whereas Biden regularly and frequently reports ballot updates that skew > 100:1 in his favor.
In the aggregate, Biden gains over +50,000 net votes in Philadelphia territories, from batch updates reporting ratios of >50:1 in favor of Biden.
What are conclusions to be drawn from such observations? It has convinced me there is something questionable about results reported for the Philadelphia area in 2020, enough to have changed the outcome. The details are not vague, but rather specific enough that would give genuine investigation a good starting point.
~~~~~~~~~~~~~~~~~~~~~~~~~~
Here's a forensic explanation of how that most extreme outlier of a 444:1 ratio was perceived.
~~~~~~~~~~~~~~~~~~~~~~~~~~
There are two .json logfiles from a series of logs covering Philadelphia 2020 Presidential election data. The logs in question are named the following:
NOVEMBER_04_2020_204112.json
NOVEMBER_04_2020_204722.json
In these two files are snapshots of vote totals covering Philadelphia and surrounding county precincts.
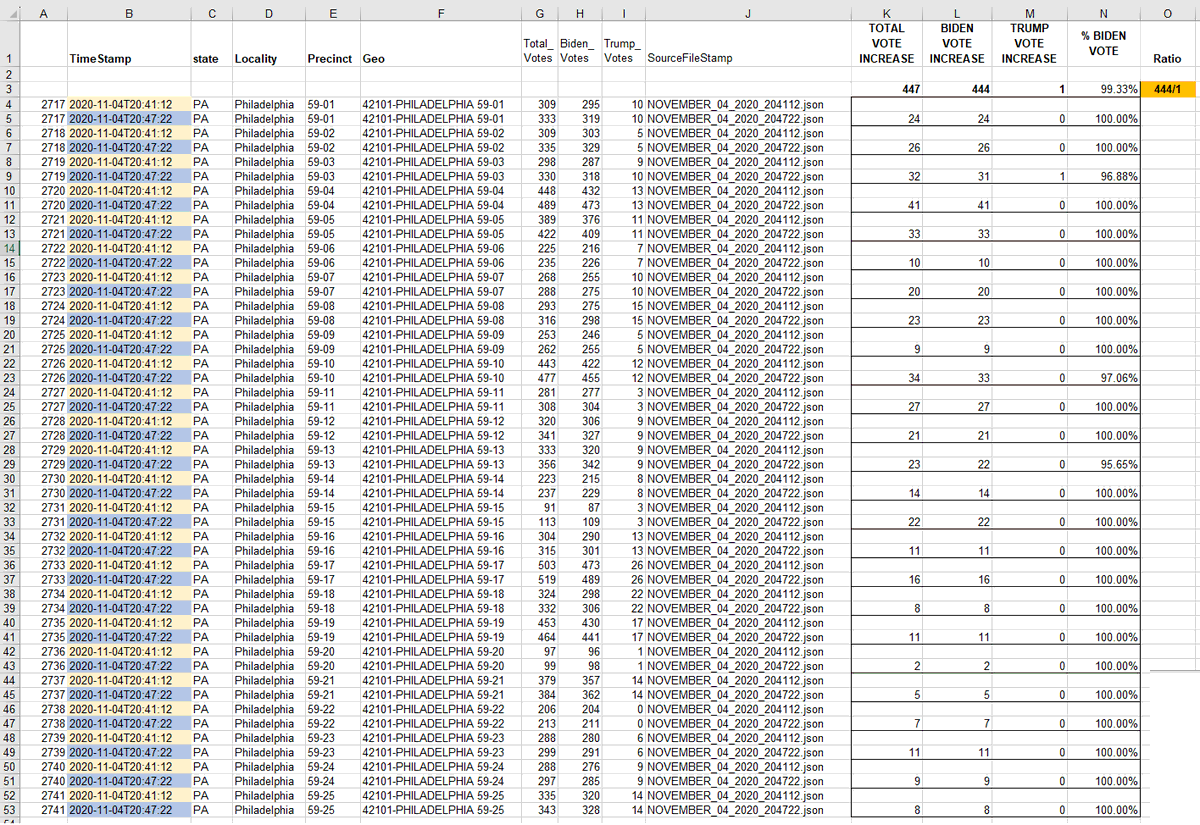
Each log entry has columns which report Total_Votes, Biden_Votes, Trump_Votes (shown in the image, opened up in a spreadsheet)
These specific log files cover the series of 59-##'s precincts being proofed, 25 total precincts, sequencing from 59-01 all the way through 59-25.
The vote tally snapshots are timestamped, if you take the difference in vote totals between two timestamps for a given precinct, the difference between the before/after counts are how many votes were recorded in that time interval.
The Timestamps that were used here to make the before/after comparison snapshots:
2020-11-04T20:41:12
2020-11-04T20:47:22
This means these vote changes were observed arriving 5 minutes apart at 20:47 UTC (which to convert to Philadelphia local time is -5HRS), therefore this vote change is assigned a local time of 20:47 UTC / 15:47 EST
For analysis, since vote is being bucketed in 1/2 hour increments, this timestamp that was observed at 15:47 EST will be assigned the '15:30 - 16:00' bucket.
When the two snapshots in isolation are compared, they show vote changes exactly as I indicated in the prior post:
The vote total increases by 447
The breakdown of those 447 votes is: 444 Biden Votes / 1 Trump Vote / 2 Independent Votes
The ratio of Biden to Trump vote for the Philadelphia 59-##'s precinct series during the 15:30-16:00EST interval is 444:1.
Once you've calculated the vote increments between all the different timestamped snapshots included in the series of log files, you then have a data set that can be analyzed/visualized in a variety of ways.
In my example I went with frequency distribution charts along a vertical axis showing 'ratio of vote'.
The length of the horizontal bar plot is determined by the sum of NET gained votes for that given ratio of support.
In this visualization example the bar for ratio between '440 <= X < 445' has a value of +443, because the NET gain of votes for Biden is what is plotted.
(this represents how that bucket of 444:1 vote from the 59-##'s district would plot on the distribution chart)
Congratulations @GaryHeinlein1 you are getting closer to one party totalitarianism- and then they won’t need you any more.
It will be YOUR turn to shut tf up and get back in line, or you will pay w everything you thought you owned.
@JustJenRX@WeTodidd Too long ain’t listening.
If she said :
“he a fucking low class money-grubbing stone-cold murderer with a room temp IQ” …
then I am with her.
@WeTodidd@SHEEPSLIVE@CovfefeSally You’re the dumbest mfer on the face of this planet. You couldn’t think your way out of a wet paper bag. You put the um in dumb. When you think people call you stupid they are actually saying stooopid.
@DeD_aC3tA7e@BlackMajikMan90@joerussotweets Yeah or vote for the Communist anarchist who built bombs to take out congress who also burned down Pacific Palisades. Holy fuck you people are real.
She was in Venceremos Brigade. As part of this left-wing organization, she traveled to Cuba at least eight times,
Why am I so angry with Senate Majority Leader Thune?
He has the power to secure our elections & REFUSES to pass the SAVE America Act!
Now — a week AFTER Election Day — Spencer Pratt is in third place in the Los Angeles mayoral election.