Achtung: Neuer Milliardenbetrug im Krypto-Markt aufgedeckt?
Es geht um große Börsen, Fake-Stablecoins und vermutlich dem größten Scam seit dem FTX-Drama.
Ein Thread 👇 (1/15)
Gm friends and happy Wednesday! ☀️
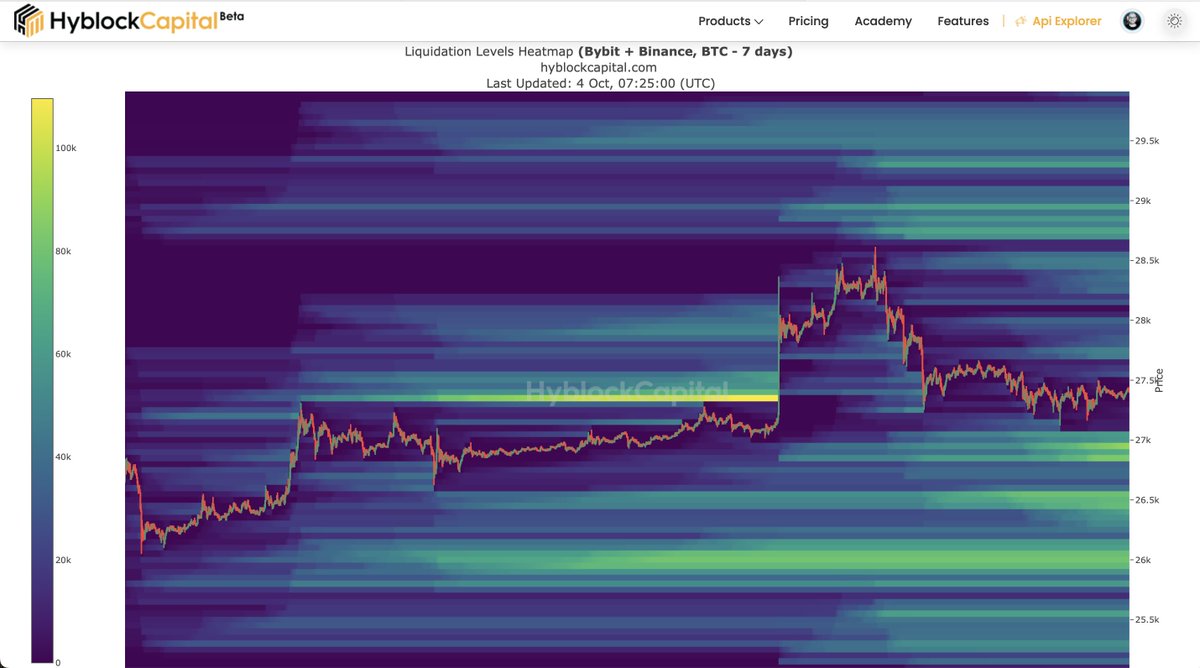
Updated Hyblock & DCT Heatmaps and Liquidation Levels for Bitcoin
I'm back. Sport & Wim Hof Meditation done, now back to the charts!
For me, the signs currently point towards the dollar rising, stocks and crypto falling. That's why I'm looking more into shorts. The targets also seem much more attractive on the downside.
There are a few smaller pools on the upside, which you can see in the 12-hour heatmap, but it only becomes really interesting above 28.7k, and I don't think Bitcoin has that much strength right now. Only if the dollar tops and stocks rise again.
Have a great day and please engage with this post to show the algorithm that more people should definitely read it 🫶
Updated Hyblock Heatmaps and Liquidation Levels for BTC, TRX, ETH, SOL, OP, and RUNE
I'm with my family today and not very active.
Nothing has changed for me anyway; I'm waiting for sub 26k Bitcoin.
Nevertheless, here are the updated heatmaps and your altcoin requests!
If you like my updates please do me one favor:
I appreciate if you like and share my content!
But most important: Leave me a comment. This is the biggest algo boost right now!
Say hello or request a coin if you like!
Thank you 🫶
Update
One day later than expected, but check ✅
Now chatch the longs?
Or further up to the big one?
Hyblock Heatmaps and Liquidation Levels for Bitcoin👇
Here's the first move, and the first pool has been emptied!
This means a new update of Hyblock Heatmaps and Liquidation Levels for Bitcoin!
If it's a typical Monday false move, it will soon be fully retraced.
As I mentioned, I expect volatility in both directions!
Please like and share 🫶
Gm and happy Sunday! ☕️
Updated Hyblock Heatmaps and Liquidation Levels for Bitcoin
To clarify two things that are often asked:
1. Liquidation levels exist only in futures. If there is no futures contract for a coin, there can't be any liquidations, and therefore, no Liquidation Levels.
2. Why do different timeframes for BTC display varying liquidation levels in the heatmap?
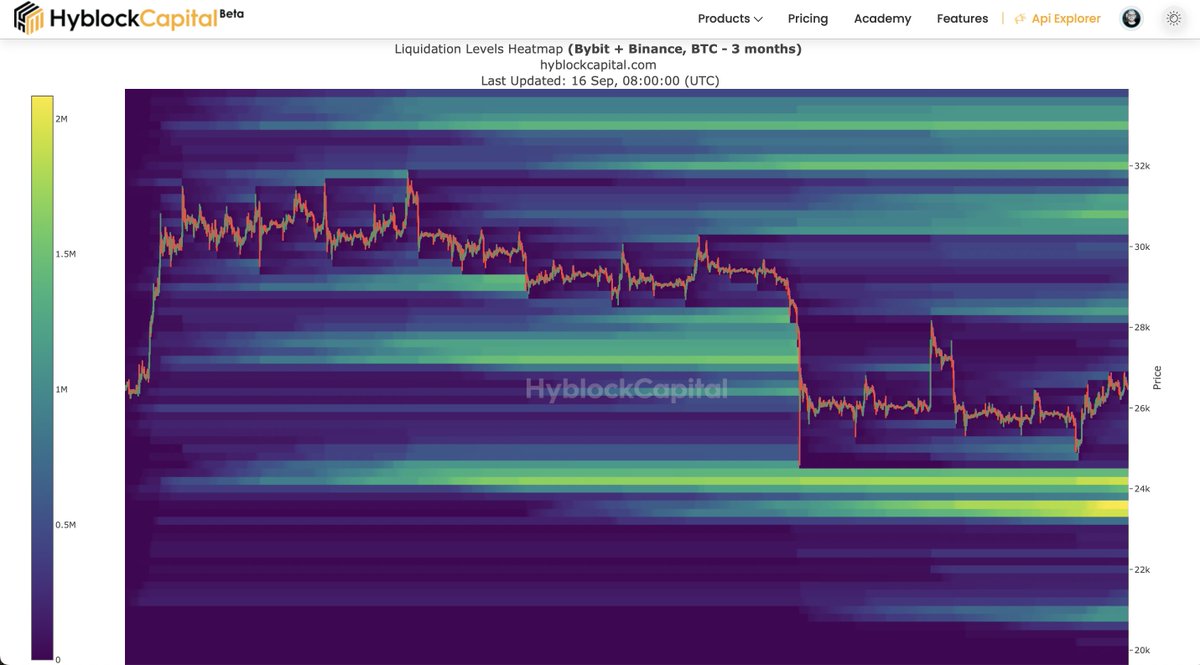
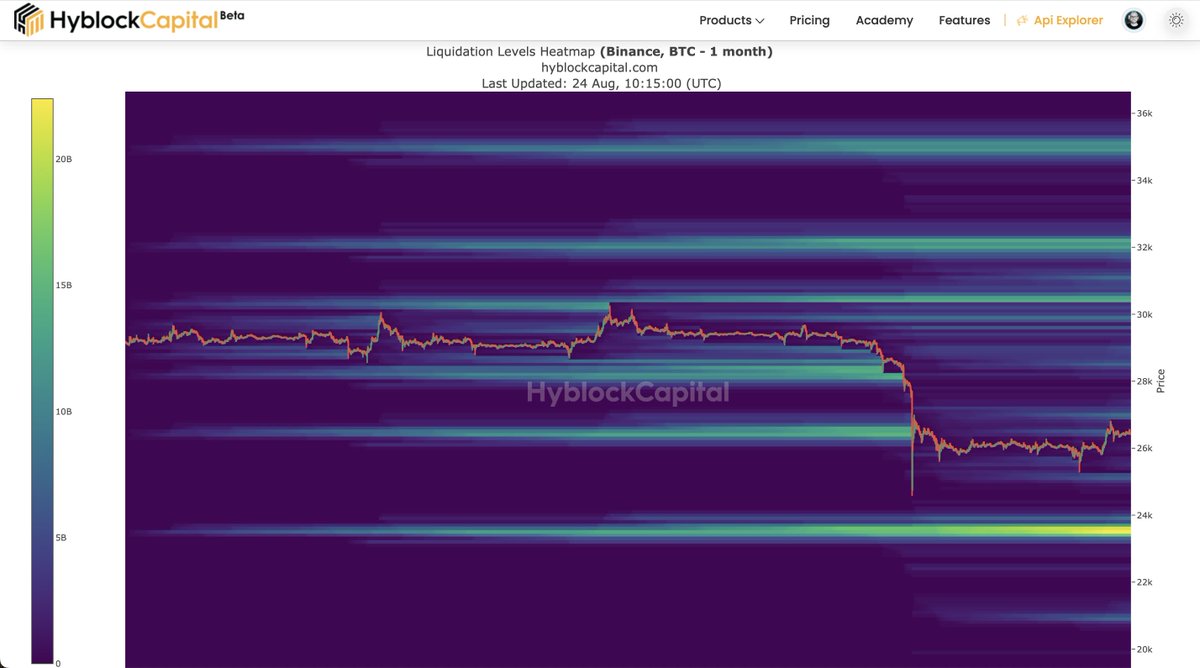
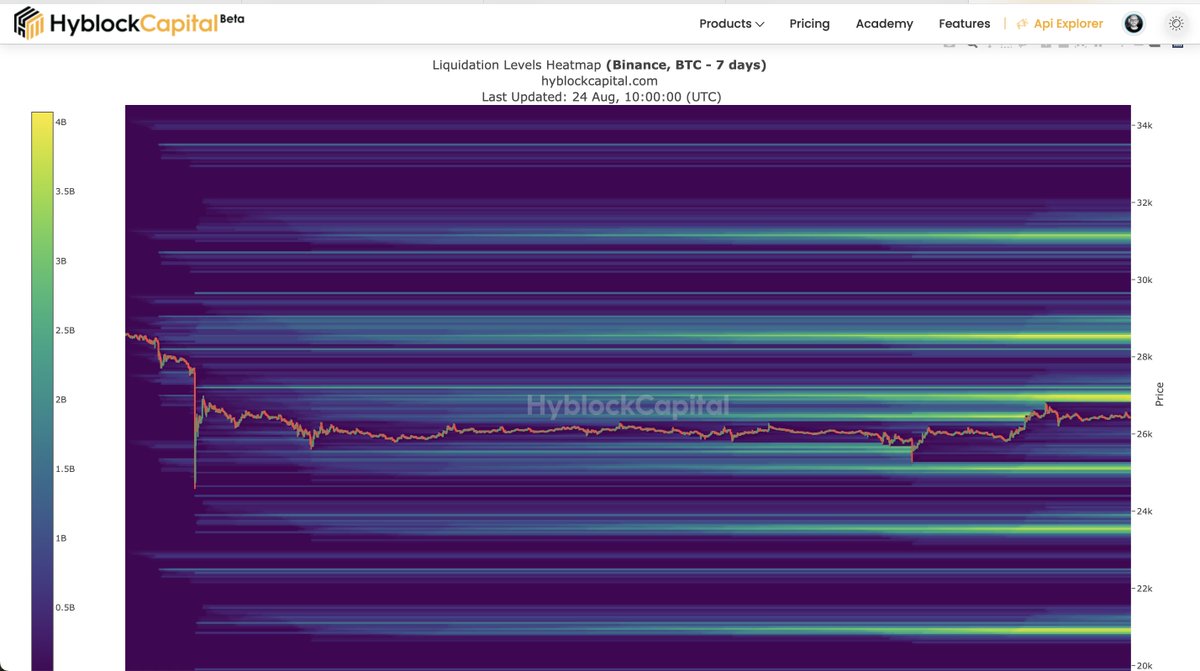
In the 12-hour heatmap, you can see the liquidation levels of positions opened in the last 12 hours. In the 7-day heatmap, you'll find data for the past 7 days, and in the 1-month heatmap, you'll see information for an entire month.
Of course, the price evolves over time, and consequently, do the positions with their respective liquidation prices.
Firstly, changes over time are of interest, and secondly, shorter timeframes are useful for short-term developments, while longer timeframes are informative for assessing developments over a longer period of time.
Have a great Sunday!
Updated Hyblock Heatmaps and Liquidation Levels for Bitcoin
On the 7 day, you can beautifully see how the first shorts got trapped a few hours ago.
The move up brought in more long positions again.
Let's see what will be the next hit.
If this helped you, then help me out by giving this a like and a retweet 🤝
@hoss_crypto@hoss_crypto Hey, vielen Dank für deine regelmäßigen Updates!
Wie schätzt du Bitcoin Futures den Arbeitsmarkt Daten nach zur Folge für die nächsten Wochen ein?
Tendenz eher Short oder Long?