From how we’re framing this setup at Forms Ventures, and what we’re closely watching via @theformsfund , this is a key decision point for Ethereum.
$ETH is testing the ~$3,350 area, which has acted as firm resistance. A clean break and daily close above this level would likely open the path toward the Daily 200MA.
Until that happens, this zone remains resistance by definition. The signal will come from acceptance, not the intraday wicks.
Daily closes here matter more than anything else.
In recent desk discussions at Forms Ventures, and what we’ve been flagging via @theformsfund , spot market signals are starting to soften.
Over the past one to two weeks, the spot premium on $BTC has been trending lower, with a notable Coinbase discount reappearing. That shift lines up with the larger ETF outflows we saw last week.
Together, these factors help explain why price has been chopping around in such a tight range. Flows are cautious, not aggressive.
This still looks like early-year rebalancing and rotation rather than a strong directional bet. Worth watching how spot demand reacts once that process settles.
In our momentum scans at Forms Venture, and something we’ve been highlighting through @theformsfund , $SUI has clearly shifted character.
SUI just delivered a strong breakout, up roughly 50% from the December lows. That kind of expansion usually resets market attention and short-term positioning.
The level that matters now is ~$1.7. Holding above that zone keeps momentum firmly in the bulls’ favor and allows continuation setups to develop.
Lose it, and this risks turning into a fast mean reversion. For now, structure says strength.
This is very unusual.
The trader who made +$800,000 profit by predicting a US strike on Iran and Khamenei out as Supreme Leader is back.
He just made a $500,000 bet that US military forces will enter Iran by the end of April.
Insider or just a lucky trader ?
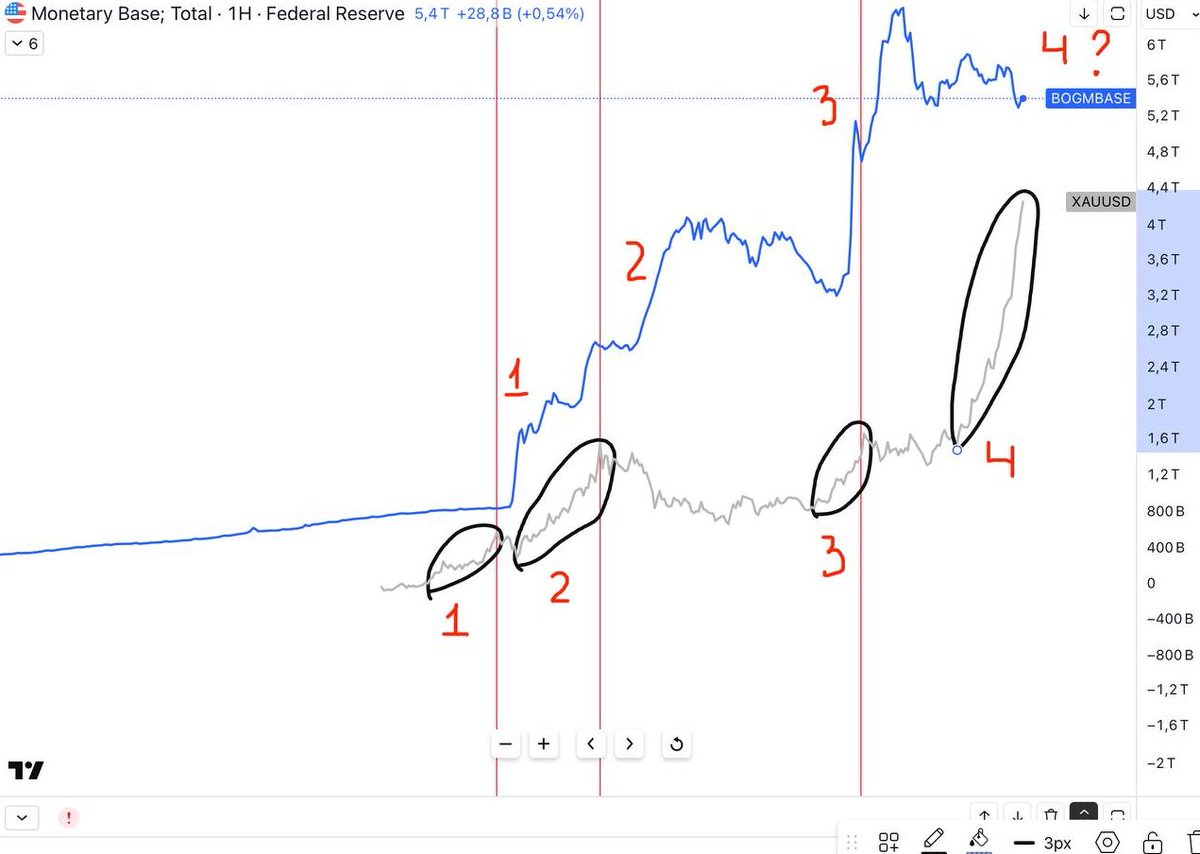
Gold is the main indicator of future liquidity entering the system!
It usually precedes liquidity by 3-8 months!
The screenshot I provided clearly demonstrates this!
Always! A sharp rise in gold prices has been a harbinger of strong growth in US liquidity!
Three sharp phases of growth in the metal were accompanied by a large influx of liquidity into the system after the growth in gold stopped!
We are now seeing one of the most powerful upward movements in gold!
Next, we can expect a move to new historical highs on the blue line (US liquidity).
We have completed QT and moved on to QE lite.
The sharp rise in oil prices is causing US bond yields to rise.
This is bad for the system!
Let's not forget that in 2026, $8 trillion in debt will be refinanced.
Let's save cash.
I am very optimistic about the market in the long term.
The analysis was conducted jointly with the @theformsfund team.
One thing that’s hard to ignore in our macro reads at Forms Ventures, and something we’ve been flagging in different ways via @theformsfund , is where capital is choosing to hide right now.
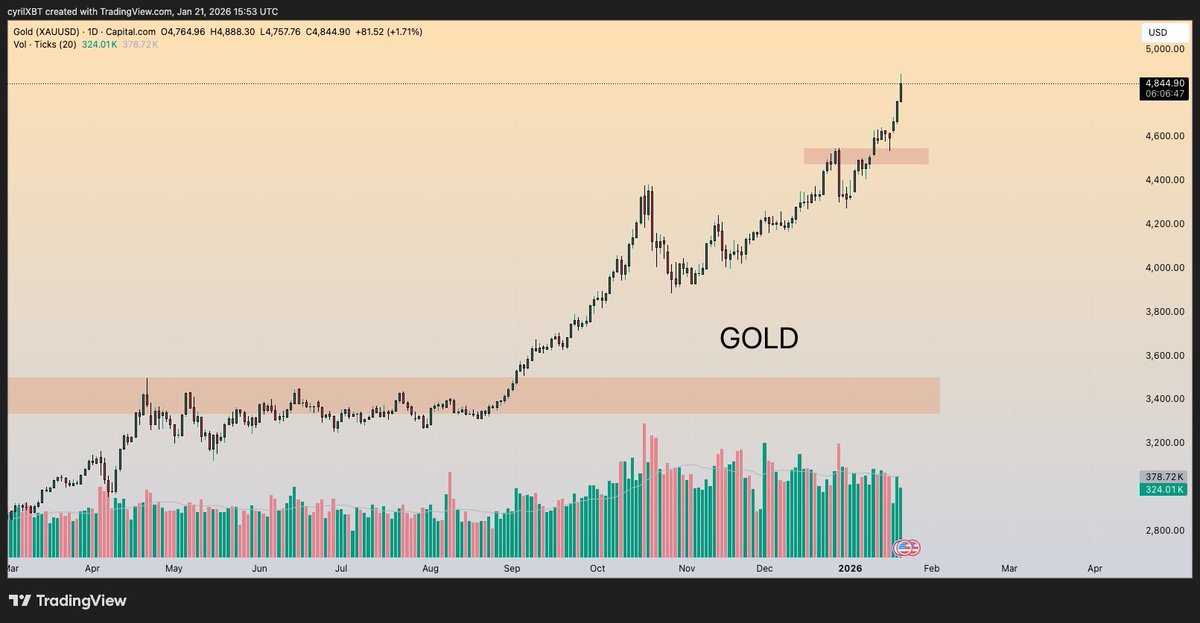
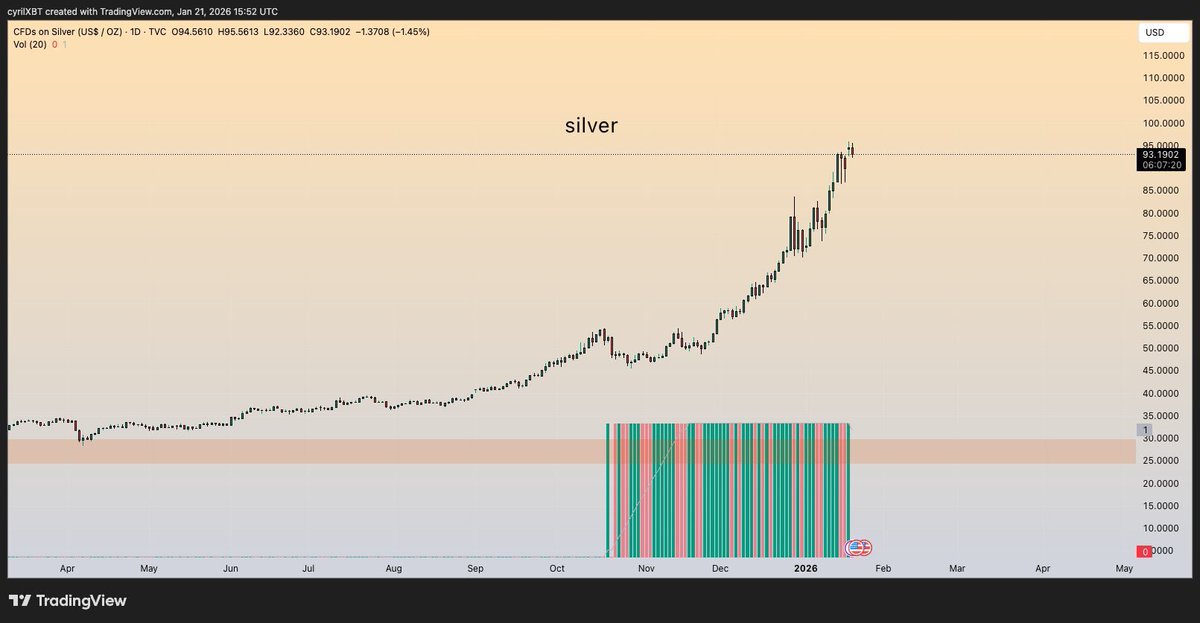
Gold and silver are putting up serious numbers. That’s usually a pretty clean signal.
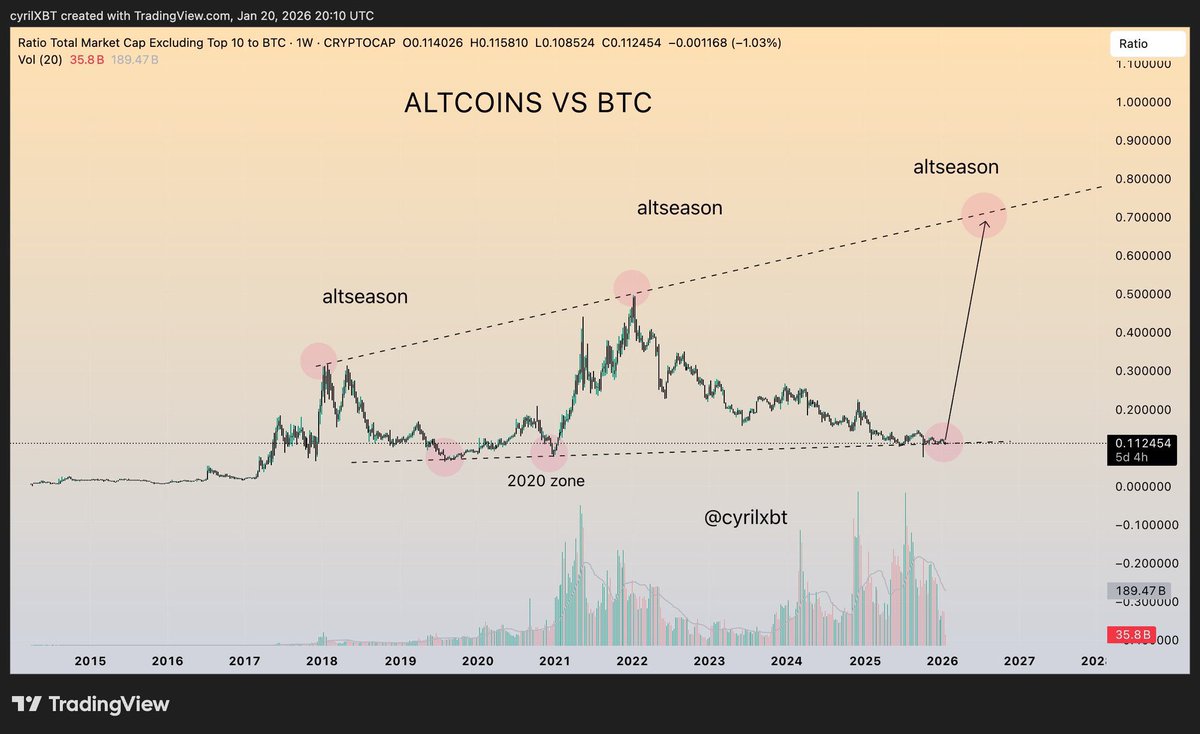
It tells me investors aren’t eager to bet on risk assets at the moment. And that bucket includes $BTC, let alone alts or any real talk of altseason.
When metals lead and risk lags, it’s less about conviction and more about caution. Rotation back into risk tends to come later, not first.
One perspective we keep coming back to in cycle discussions at Forms Ventures, and something that often gets echoed in conversations around @theformsfund , is how markets tend to exhaust emotion before they exhaust structure.
There’s still hope. Historically, markets don’t slip quietly into downtime. They peak first, sentiment stretches, conviction gets loud, and then things cool off.
If history repeats itself, what we’re seeing now looks less like the end and more like the pause before the final move.
Cycles rarely end when doubt dominates. They usually end when confidence feels justified.