This is the official account for Milton Berg EDGE — the EDGE signal from @BergMilton, built for individual investors.
Strategy: Shift from 100% Long S&P 500 in a Bull market to 100% T-Bills in a Bear market. 55 trades since 1957. Annual Return 18.5%. Follow along. https://t.co/dwrlkajcXx
(disclaimer: Results shown for periods prior to June 1, 2025 are hypothetical and backtested; they do not represent the results of any actual portfolio or investment account. full disclaimer https://t.co/YuOsJzeMvG)
A week ago the market fell, the Fed did nothing, and plenty of people started calling a bear market.
The model doesn't trade on emotion. It stayed invested, because that's what its rule said. The S&P is up 3.9% since.
That's the whole idea: fewer decisions, not better guesses. Today's report is out to subscribers.
Buy-and-hold fell 56.8% in 2007-09. The model's worst fall since 1957: 18.2%. The difference isn't return - it's whether you're still there to collect it. Hypothetical model; real money since May 2025.
"That is the most remarkable example of timing I've ever seen on this show yet." — @davidlin_TV
Milton sold his personal gold position on January 29, the day before the top. He shows the receipt, then explains how he knew.
Now live: @BergMilton's interview with @davidlin_TV, recorded before today's Fed meeting.
His read — not calling a bear market, but the corrective action may have a bit further to run, expecting higher highs later in the year.
https://t.co/tY35ay4Ked
It's a Treasury money market fund rather than an ETF. Milton's answer when a subscriber asked the same thing: most brokerages sweep cash into a fund holding commercial paper, and you can direct it into a short-term Treasury fund instead — there are many, and it's usually best to use the one your own broker recommends.
30,000+ indicators. Around 2,000 models. Five decades of @BergMilton's work, distilled into one binary signal: own the S&P 500, or own T-bills.
For the price of your morning coffee and pastry.
https://t.co/ga4BbsFGKf
Every trade is published, winners and losers. Since 1957 the hypothetical model was wrong on 5 of its 55 S&P trades, worst drawdown −18.2%. Every entry and exit is listed in the Explanation Guide: https://t.co/3qBqmciymq
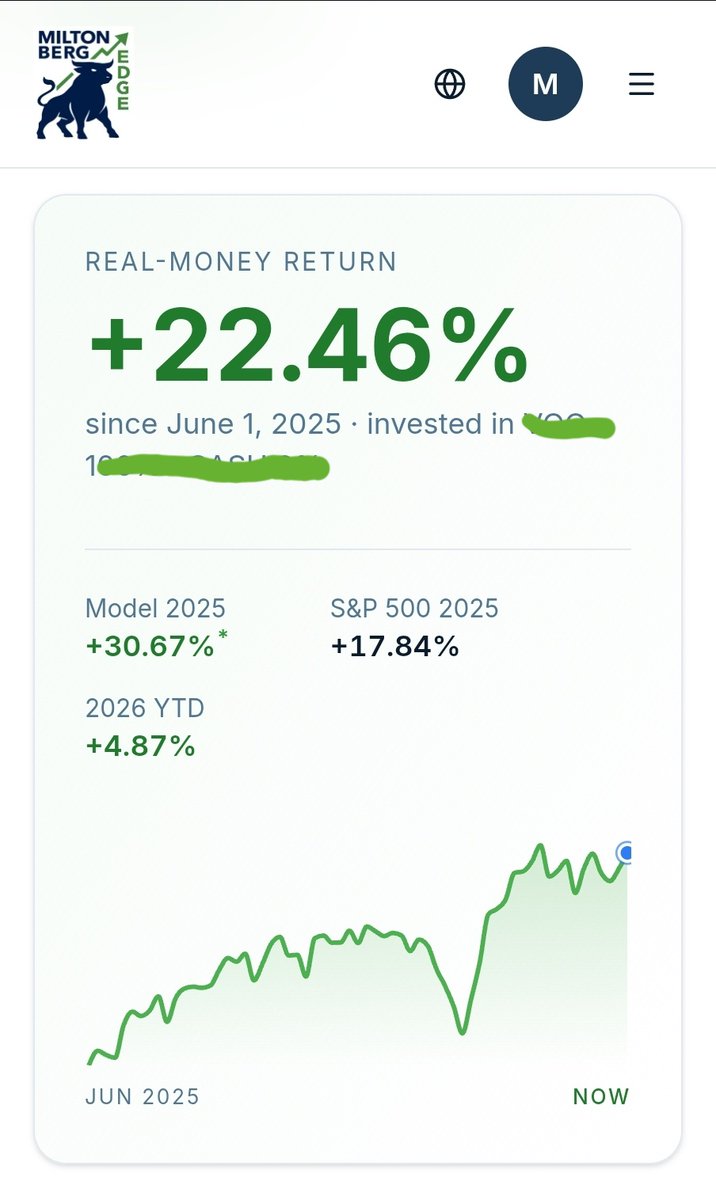
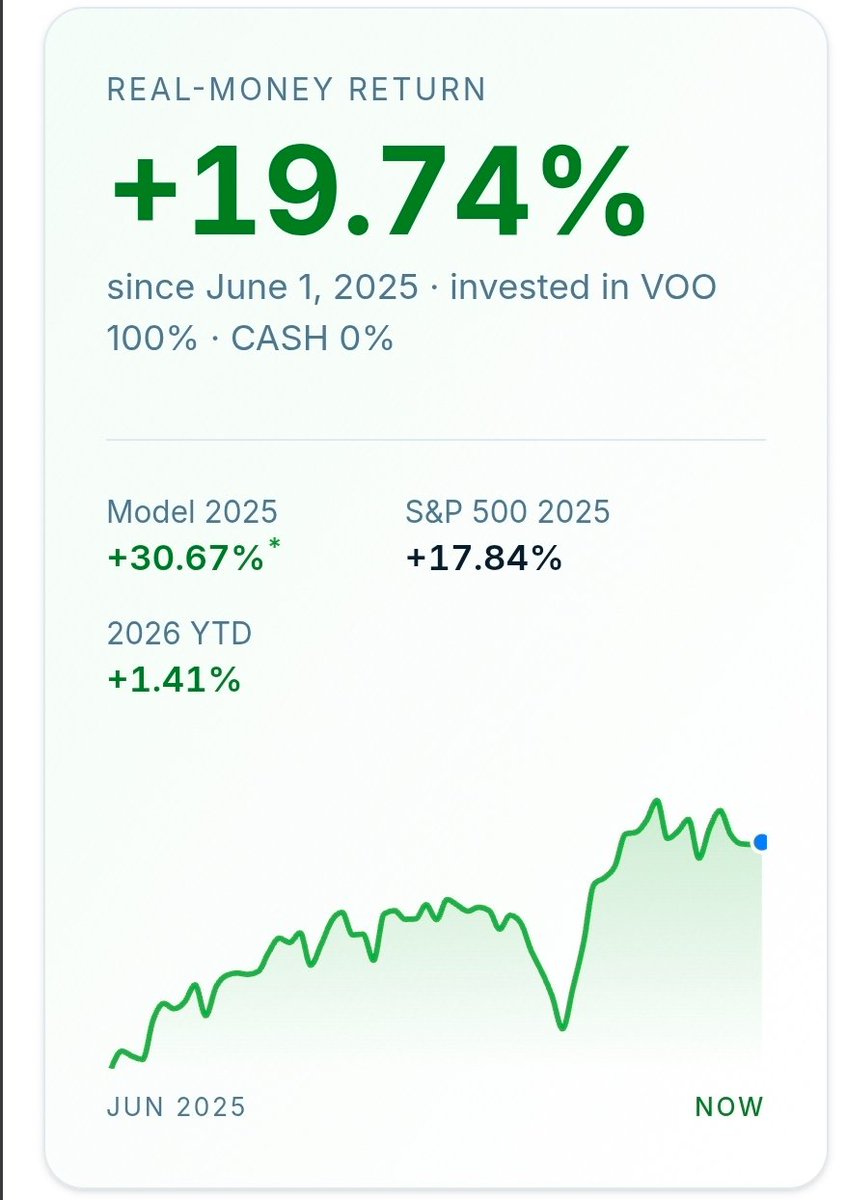
The live account is a real Fidelity portfolio connected to the site, up 19.74% since June 2025. You can watch it move live, dips included. Nothing here is cherry-picked.
Every trade is published, winners and losers. Since 1957 the hypothetical model was wrong on 5 of its 55 S&P trades, worst drawdown −18.2%. Every entry and exit is listed in the Explanation Guide: https://t.co/3qBqmciymq
The live account is a real Fidelity portfolio connected to the site, up 19.74% since June 2025. You can watch it move live, dips included. Nothing here is cherry-picked.
@garynielson@BergMilton@davidlin_TV It's being recorded on Wednesday rather than going out live, so there's nothing to tune into on the day.
When it airs is @davidlin_TV's call — we'll post here as soon as we know
This Wednesday, @BergMilton
joins @davidlin_TV
— fifty years in the markets, distilled into one simple discipline.
What do you want him to cover? Tell us below.
The chart you're after is already on the homepage — $10,000 from 1957, the model against the S&P 500 total return, built from the actual year-by-year figures. Not a smoothed average.
The calculator is a different tool: it applies the long-term average return to show what compounding does over decades. It's meant to be simple, not to reproduce the path.
If you want the underlying numbers, the Explanation Guide has the complete year-by-year table since 1957 and every trade the model has made. It's at the top of the reports page: https://t.co/3qBqmciymq
A reminder: @BergMilton has one account on X. Anyone messaging you "investment opportunities" using his name or photo is a fraud - report it. He will never DM you first, and never ask you for money.
The years that wreck buy-and-hold portfolios.
The S&P's 7 worst years since 1957. The Edge model was positive in 5 of them, and lost less than 2% in the other 2.
MB Edge is built to stay fully invested through bull markets and step aside for deep bear markets.
https://t.co/DQ9X0kdE7C
(disclaimer: Results shown for periods prior to June 1, 2025 are hypothetical and backtested; they do not represent the results of any actual portfolio or investment account. full disclaimer https://t.co/YuOsJzfkle)
@DarrelNg Milton is considering it — nothing decided and no timeline, but it's a fair point about taxable accounts.
If it progresses, we'll say so here.
Expected minimum, average and maximum gains across combined signals is institutional report territory — that work is built for people sitting at a desk all day who can trade a range of probabilities.
But 8% isn't a blunt instrument. It came out of Milton's research as the decisive sell level for a long-term retail investor. And it isn't automatic — not every 8% decline triggers a sell, and occasionally a buy signal fires on the same day as the drop and cancels it out.
Institutions and professional investors can request a quote for the institutional research at https://t.co/z95F2zwrni
Fair question. A rules-based signal only means anything if the rules hold still — the record would be worth very little if the method quietly moved around underneath it. So consistency there is deliberate, not neglect.
Where things do move is alongside it: Milton is working on a few additional products for retail investors. New capability will show up that way rather than by changing the signal you're already following. We'll post about them here, and subscribers will hear it in their own channels too.
That trade-off is the design, not a side effect of it. The model doesn't try to call tops — most sell signals either fire too early or too late to be useful. So it stays fully invested until the S&P falls roughly 8% from its closing high, gives up that first slice, and steps aside for the rest of the decline.
Being out of the way through the worst of a bear market is the point. So you've read the intent correctly.
But the real benefit is knowing when to get back in the market — that's the part most retail investors miss.