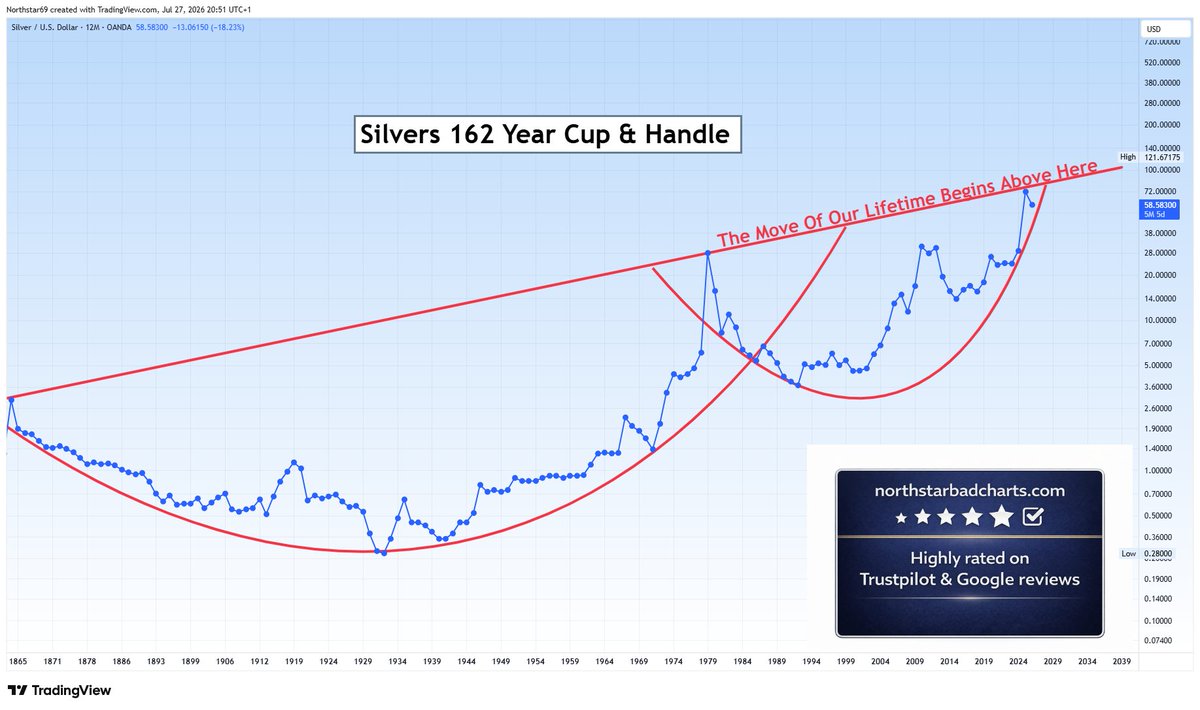
“The move of our lifetime begins above here:”
🔥SILVER’S 162 YEAR CUP & HANDLE🔥
👀Wait…
SILVER’S 50-YEAR “MOTHER-OF-ALL CUP-&-HANDLES” PATTERN WAS ACTUALLY JUST THE HANDLE OF AN EVEN LARGER 162 YEAR CUP & HANDLE PATTERN⁉️
This chart says the silver (and gold) bull eras have barely begun. The price of silver should easly approach $300, with $500+ entirely possible in the next 5-8 years.
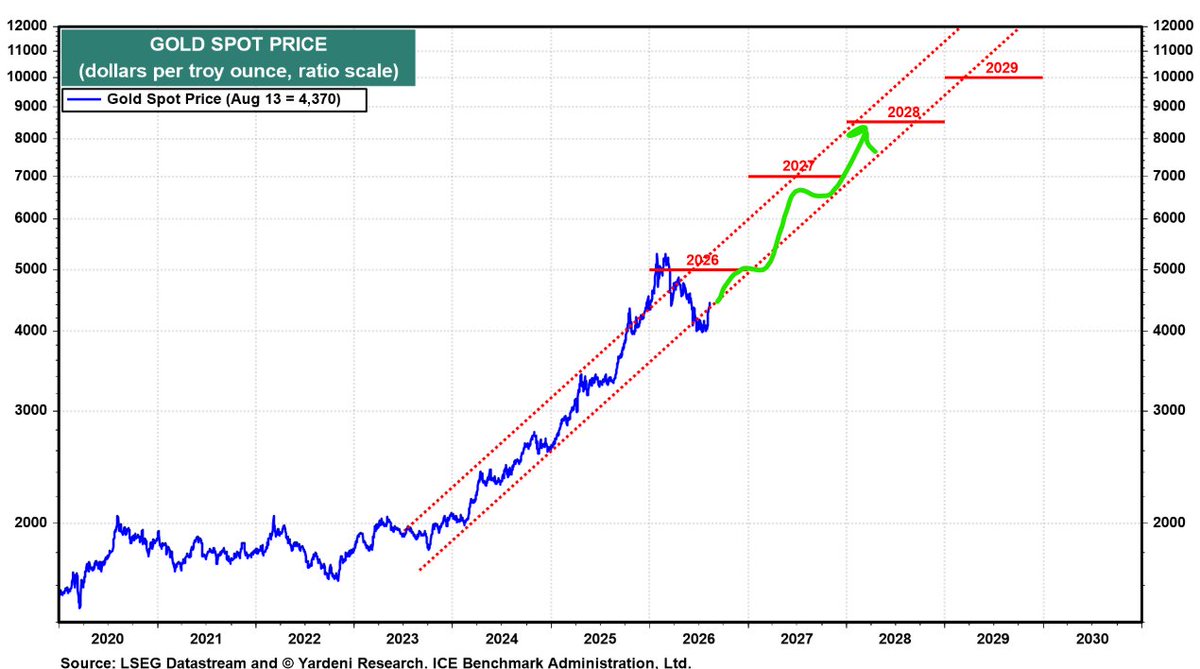
A #Bull case for gold through 2026-2040
Inverted Gold (blue) is correlated with #USDEUR
When USDEUR RSI goes to oversold, we can expect Gold to top out. Until then, I'm a perma-bull.
There will be dips in between
☝️
@silver_2261#andyhoese amazing predicted todays' bond market move yesterday! Very bullish #gold & #silver. MUST WATCH & STUDY @Oliver_MSA another one for silver $1000 +++++
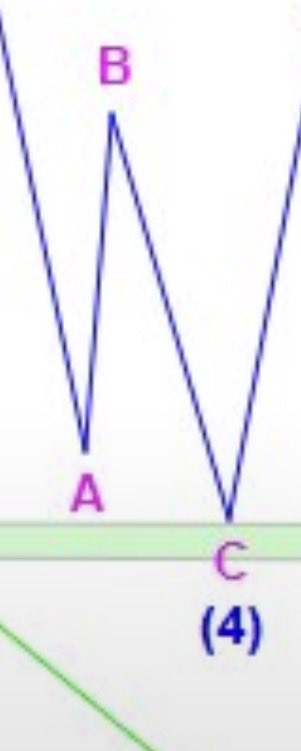
Don’t forget this insanely good #Silver Elliott Wave count from 2020! We’re just completing wave B and are about to put in the low of wave C (wave 4). After that, it’s off to new highs ✌️
Silver is struggling with a line that mattered for years 👇
For much of the past cycle
the 200-day EMA quietly followed silver higher
There were plenty of pullbacks along the way
Some shallow
Some much deeper
But again and again
price found its way back above that rising average
and stayed there
That changed on June 18
Silver finally broke below the 200 EMA
and this time the break did not immediately reverse
For the weeks that followed
the average sat above price rather than underneath it
Now silver has worked its way back
And for the past 7 trading days
price has been pressing almost continuously against the 200 EMA
No clean breakout yet
No sharp rejection either
Just a series of small daily candles clustered around a line that used to be support
and is now being tested from the other side
That helps explain why silver is struggling here
A moving average that supported price for years can become resistance once price breaks below it
especially when traders have had weeks to adjust to that change
So the next few daily closes are worth watching
A sustained move above the 200 EMA would put silver back on the stronger side of a long-term trend measure
As long as price remains stuck underneath it
this area can continue to slow the recovery
THE 15-YEAR SILVER TRAP: NEW SUPPLY IS IMPOSSIBLE UNTIL 2040
Austrian Silver expert E. Gratz: Wall Street still believes higher silver prices will magically unlock more metal tomorrow. That belief is pure fantasy. From the first discovery of a silver vein to the first finished ounce takes on average fifteen years. The physical deficit we face right now was locked in long before solar and AI demand exploded. Anyone waiting for new mines is waiting until 2040.
THE CORE THESIS: THE MARKET CANNOT REACT
➡️ Today’s silver supply was planned fifteen years ago.
➡️ Exploding demand from solar and AI hits a market that has zero short-term flexibility.
➡️ The physical deficit is already set in stone.
THE FATAL ILLUSION
➡️ Wall Street thinks a rising price simply pulls more silver out of the ground.
➡️ In physical reality that is completely impossible.
➡️ Mines do not appear because the chart looks good.
THE BRUTAL TIMELINE
➡️ Average time from discovery to first production sits at fifteen years.
➡️ Mines that started between 2020 and 2023 needed 17.9 years according to S&P Global.
➡️ Hope for meaningful new supply before 2040 is delusion.
WHO ACTUALLY HUNTS FOR SILVER
➡️ Not the big corporations.
➡️ Tiny junior explorers take the extreme risk, raise speculative capital, and drill in the middle of nowhere.
➡️ Nine out of ten projects never become economic mines.
➡️ Only one in a thousand exploration projects ever turns into a real producing mine.
THE PERMITTING AND FINANCING WALL
➡️ After discovery come years of feasibility studies, environmental reviews, water rights, and negotiations with local communities.
➡️ ESG rules and bureaucracy routinely stretch the timeline into year eight through fourteen.
➡️ Hundreds of millions are spent on lawyers and permits long before the first shovel hits dirt.
➡️ Many explorers simply go bankrupt on the way.
THE BOTTOM LINE
The silver market is trapped in a multi-decade structural lag. Demand is exploding while new supply remains locked away for another fifteen years or more.
Only physical silver you already hold protects real wealth.
HT: YouTube Ernst Gratz
#SilverTrap #15YearDelay #PhysicalSilver #SilverDeficit #MiningReality #SolarSilver #AISilver
Silver
Wave iii ended at the 121.65 high, and we are falling in a multi-month wave iv correction that has the following retracement level:
61.8% = 57.32.
Within wave iv, we cannot rule the possibly that all of wave iv is now complete at the 54.77 low, and that we have started to rally higher in wave v of 3.
The other option is that wave 3 is extending and that only wave i of 3 ended at the 121.56 high… and wave ii likely ended at the 54.77 low.
This would suggest that silver is heading well above the $300 level in wave iii of 3!
In the very long term, we completed all of wave III at 49.00 in 1980 and all of wave IV at 3.55 in 1993. We are now working on wave V and within wave V we have the following count:
1 = 49.56.
2 = 11.64,
3 projection is updated to 3 = 2.618(1) = 132.09. ~Captain Ewave
One of my friends got wrecked with silver recently.
Put in $8K, turned it into almost $100K pretty fast.
Instead of taking profits he kept pushing for $200k
Then Silver dumped hard and wiped out most of the gains.
He borrowed money trying to make it all back… now he’s $35K in the hole.
Don't use leverage, unless you know what you are doing.
🚨 BREAKING: ABSOLUTE BLOODBATH
🇨🇳 ¥1,500,000,000,000.00 HAS BEEN WIPED OUT FROM THE CHINESE STOCK MARKET TODAY!
CHINA IS NOW AGGRESSIVELY DUMPING U.S. TREASURIES IN A DESPERATE ATTEMPT TO STOP THE MARKET COLLAPSE.
THIS IS NOT LOOKING GOOD FOR GLOBAL MARKETS...
FOLLOW ME, THE NEXT DROP WILL BE SHOCKING.