If you are new to the space or would like to know more about Blockchain technology and what it can be used for, check out this video.
A shorter video explaining what Blockchain is in comments section.
Get excited people.
#Blockchain is the future.
https://t.co/14I3OTzcM0
@CryptoLegoClub Completely agree. I’ve taken the last few days away from CT because I was allowing other people’s charts affect my trading. Since the break from CT, my TA and trading has improved heaps.
@MusclesCrypto_@bulltrapped@edwardmorra_btc IH&S is usually at the end of a downtrend. We’ve just had almost a week of uptrending after a previous IH&S. Makes more sense for a H&S to form after such a big move upwards IMO.
@MusclesCrypto_ It’s interesting how everyone interprets charts differently. I’m seeing a possible H&S. Just waiting on break of right shoulder neckline.
@QubeRooster TA is not about being right all the time, it’s about finding the best probabilities. As I’ve said before, TA is never concrete and you should always be prepared to assess and reevaluate should your predictions become invalidated. Btw, lots of people saw an ascending triangle.
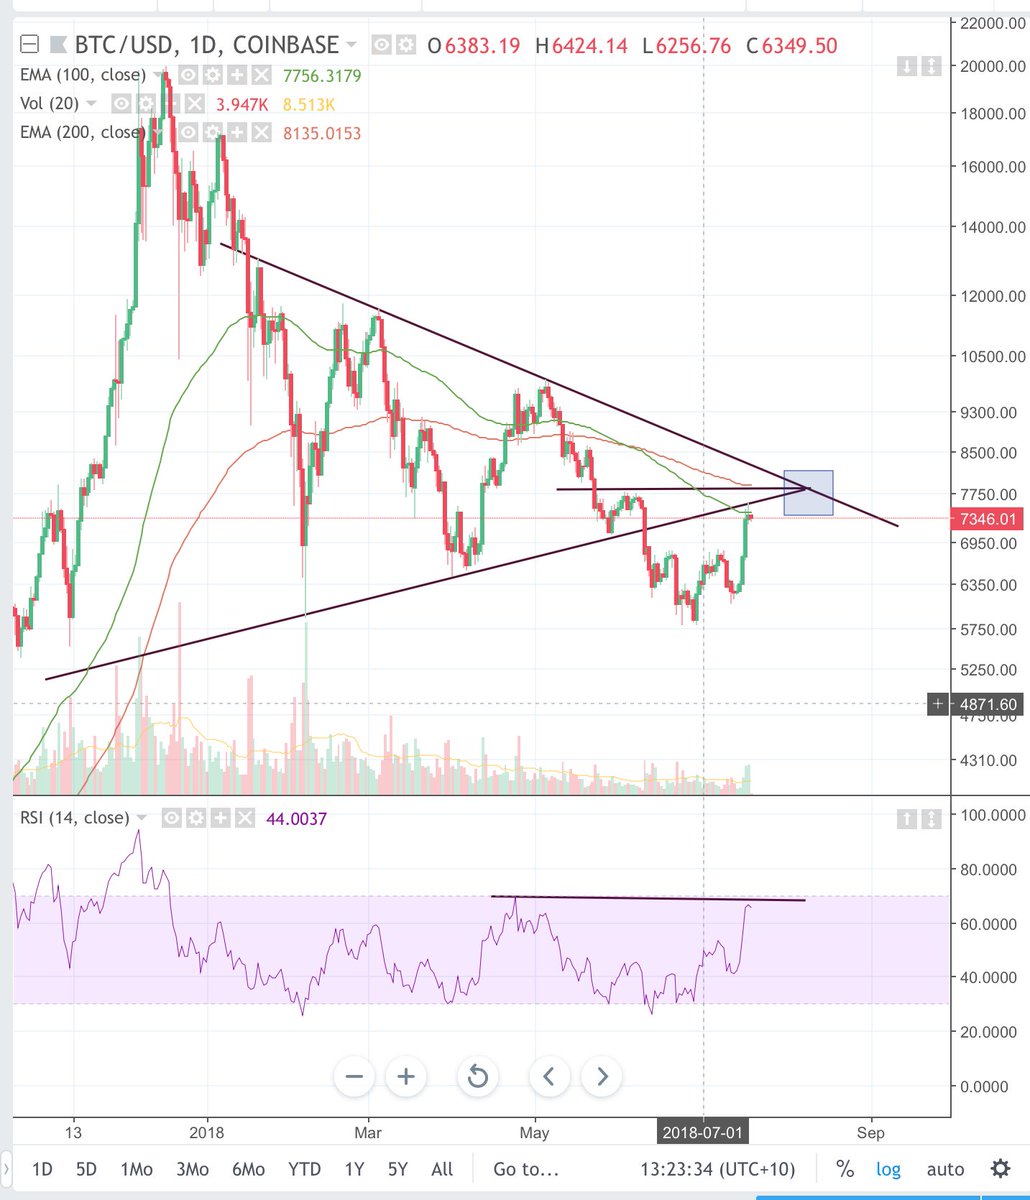
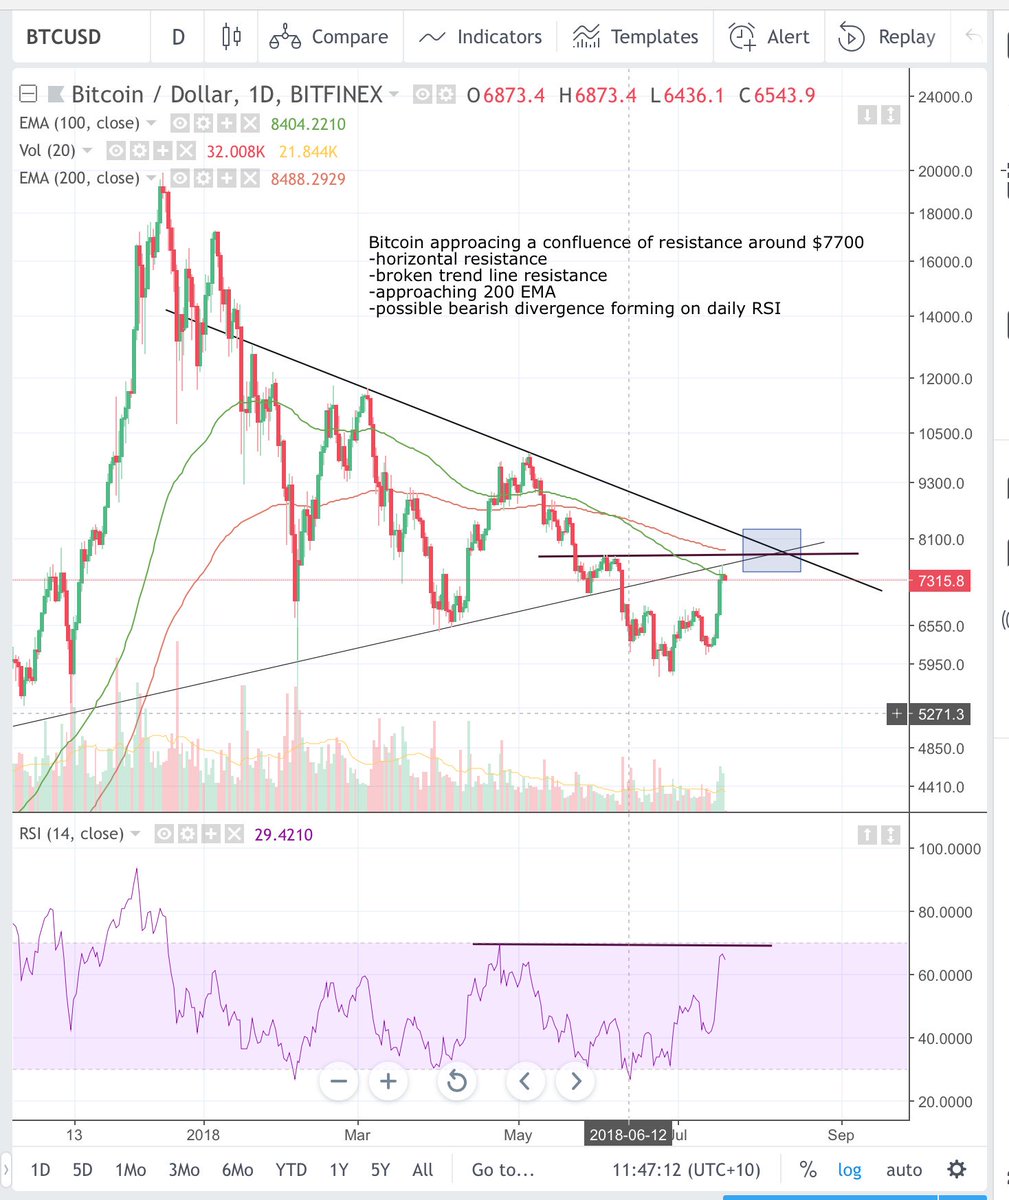
@QubeRooster If it pops it has multiple resistance levels around $7600 and $7800 and the 200EMA to break first. $8200 would bring it to the larger downtrend resistance.
@tradingroomapp Maybe they are trying to trick people in to loading up on BTC now to provide liquidity for the next downward move once we reach the point of resistance.....
@tradingroomapp It’s interesting how these things time perfectly with the movement of the Bitcoin PA. If you check the dates that the ETF is apparently coming to conclusion, it happens to be around the exact point on the chart where Bitcoin will face major resistance levels 🤔
Bitcoin is approaching major resistance around $7700. Don’t get too carried away with the recent rally. Keep an eye on these levels and be prepared to hedge should Bitcoin struggle here.
#Bitcoin
Bullish and bearish cases for Bitcoin. Either way, I expect a big move soon.
Bullish- Ascending triangle on 4h, daily and weekly chart
Bearish- Tweezer tops on weekly
Bearish divergence on 4hr chart
@cryptoboater Agree. I only take positions when the picture is much clearer. At the moment there is a case for bulls and bears.
Bulls- 2 ascending triangles on 4 hourly
6100-6200 range seems to be holding
Bears- OBV and RSI are showing bearish divergence on 4 hour