There are plenty of traders who make a lot of money with 'basic' tools (price, Moving Averages, standard momentum indicators et cetera).
More complexity often = more noise, which makes it harder to build a system that you can actually execute in the market.
Unnecessary complexity also introduces a tracking problem. It's a lot easier to reconcile 1-2 conflicting signals than 4-5 signals all saying different things.
In most cases we're trying to map broadly similar market effects (trend, momentum, mean reversion, delta imbalance, and so on) - there are no prizes for getting the same answer with fancier working.
Start with simple stuff that you know well, and iterate slowly (if needed).
Complexity and new variables should be added as/if necessary and using the minimum effective dose.
The Moving Average trader with simple(r) entry/exit criteria will have an easier time refining their system than the trader who is looking at OI, funding, quarterly futures basis, CVD, liquidity heatmaps etc. simultaneously while trying to synthesise a single, coherent trade idea.
On High & Low Volume Nodes
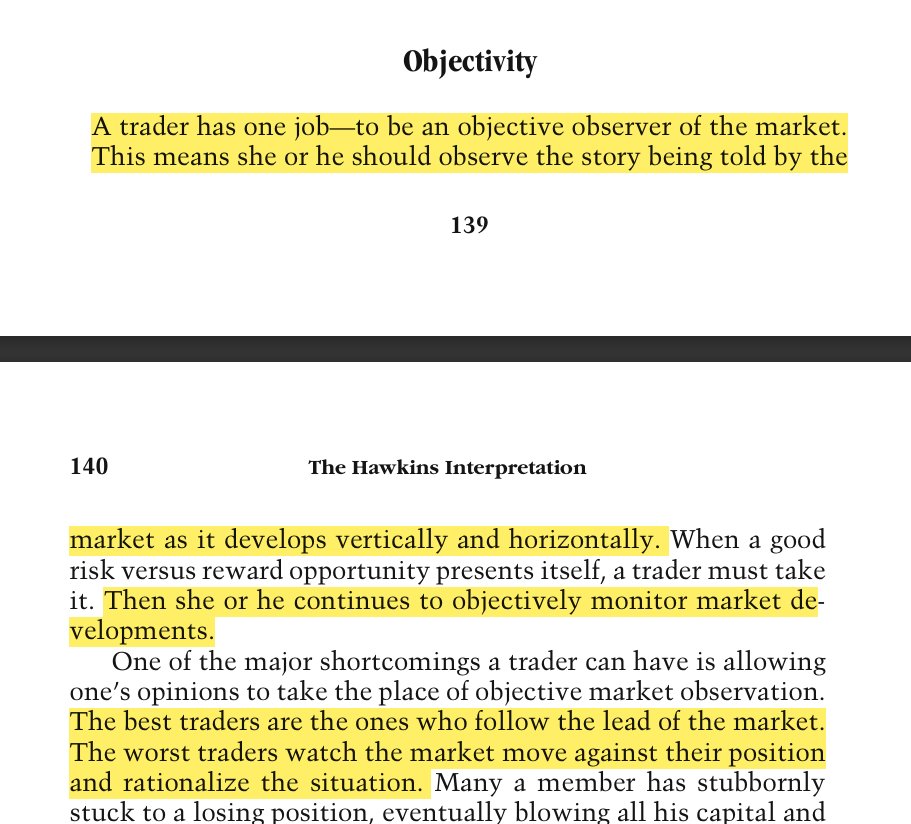
"A trader has one job....
to observe the story being told by the market as it develops vertically and horizontally."
┄┄┄┄┄┄┄┄┄┄┄┄┄┄┄┄┄┄┄
- Brief, simplified discussion & storyline of how to view these areas.
> I got a bunch of DMs asking about this so I figured I would address them in this tweet.
As always, NFA. please collect your own data & make your own observations.
┄┄┄┄┄┄┄┄┄┄┄┄┄┄┄┄┄┄┄
High Volume Node (HVN)
- A point of control is a high volume node but a high volume node does not have to be a point of control i.e. there can be multiple HVNs in a range, the node with the highest volume is the (volume) PoC.
(More on point of controls and naked point of controls in the future)
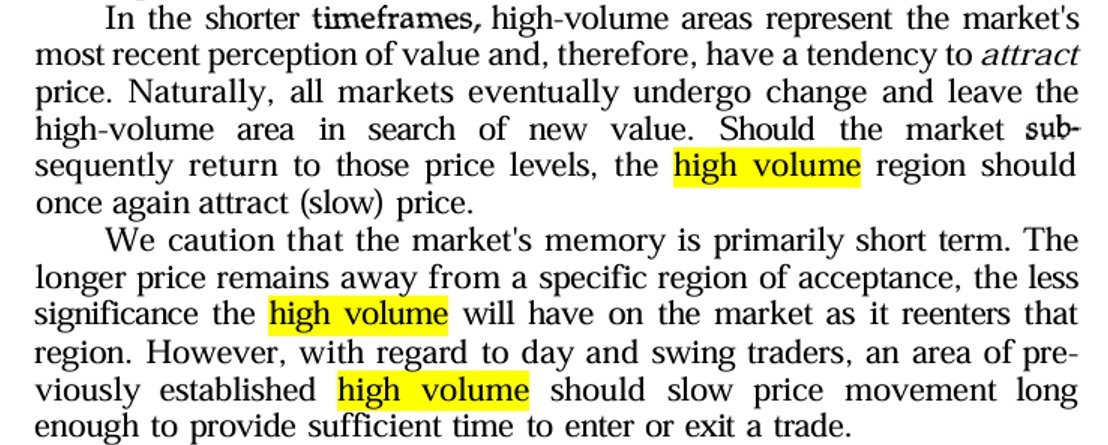
- This concentration of high volume is a result of the market spending a relatively significant amount of time trading within a range.
- This gives rise to a mean-reverting environment where both buyers and sellers are active, forming a short-term balance in which
price slows down to facilitate trades in these areas.
simple way to look at it - approaching from below = resistance, approaching from above = support.
I typically look at momentum and spot activity into these areas to determine the underlying strength of the move i.e. approaching range PoC (HVN) for $BTC = want to see spot chasing the bid (aggressive bid volume) to break out to the other side of value from under the PoC.
An excerpt from Mind Over Markets - Dalton- describing high volume regions
┄┄┄┄┄┄┄┄┄┄┄┄┄┄┄┄┄┄┄
Low Volume Node (LVN)
- These areas are representative of rejection or imbalance (trending/one-sided price action).
The opposite of HVNs, these areas represent "unfair" prices in the sense that participants have not allowed price action to develop in these regions.
- Just as HVNs create areas where price is "slowed down",
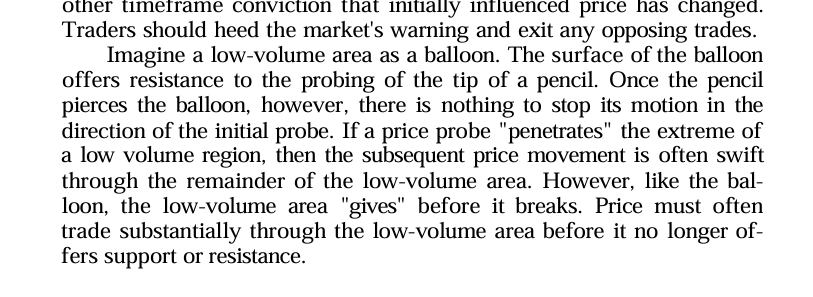
LVNs can create the opposite impact of price traversing through these areas with speed (since prior value was not established).
Think air-gap.
An excerpt from Mind Over Markets - Dalton, describing Low Volume Nodes as a balloon that is being poked with a pencil.
┄┄┄┄┄┄┄┄┄┄┄┄┄┄┄┄┄┄┄
Hope this clears it up a bit more.
For further questions, hit up my fellow volume enjoyor, smartestmoney.
LOL jk my DMs are open, just takes me some time to make my way through. 🫡
┄┄┄┄┄┄┄┄┄┄┄┄┄┄┄┄┄┄┄
You will not make serious money only ever betting 0.5%-2% per trade
Most trades are equity curve noise
If you want to make a dent, you need to swing for the fences when there's a great opportunity
Risk management isn't what makes money - it keeps you alive between big winners
$BOBAOPPA
Minimum 1 $SOL
CZ5aEKMBsiVyAKCig8R2RQYF9T1rPdPDrdonWvS4v6iz
LIKE + RT + drop your wallet
Don't send from an exchange
Things will never be the same