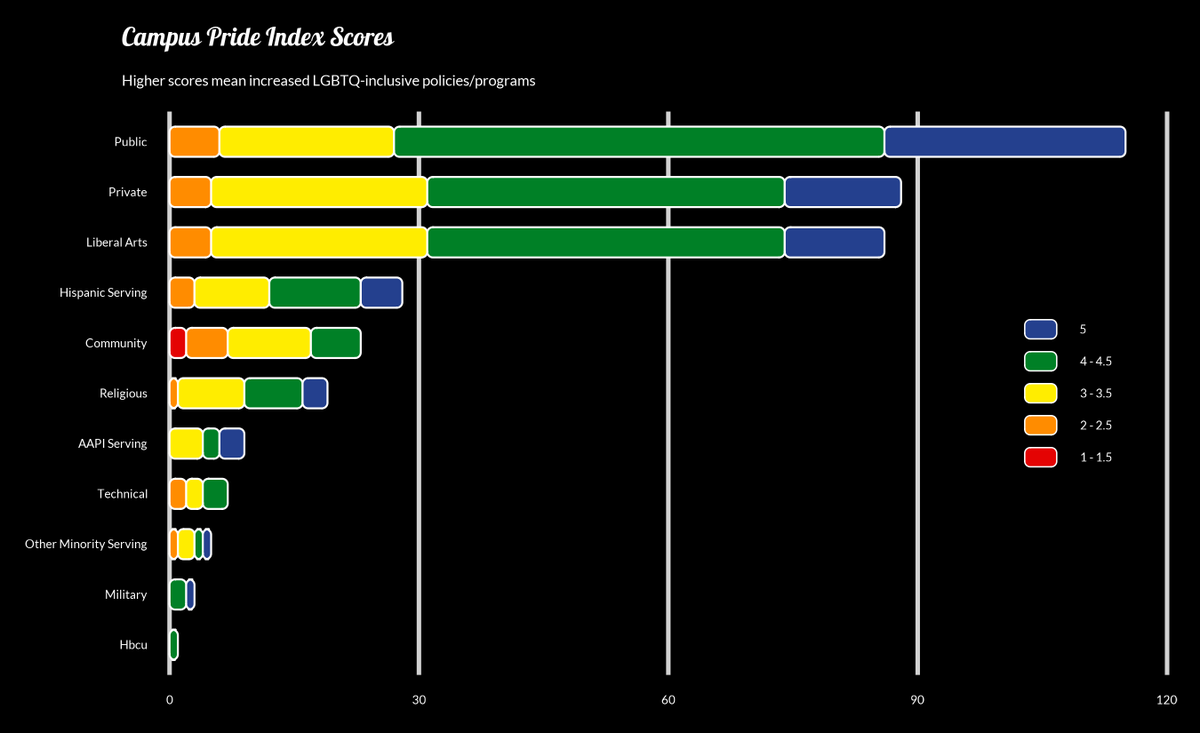
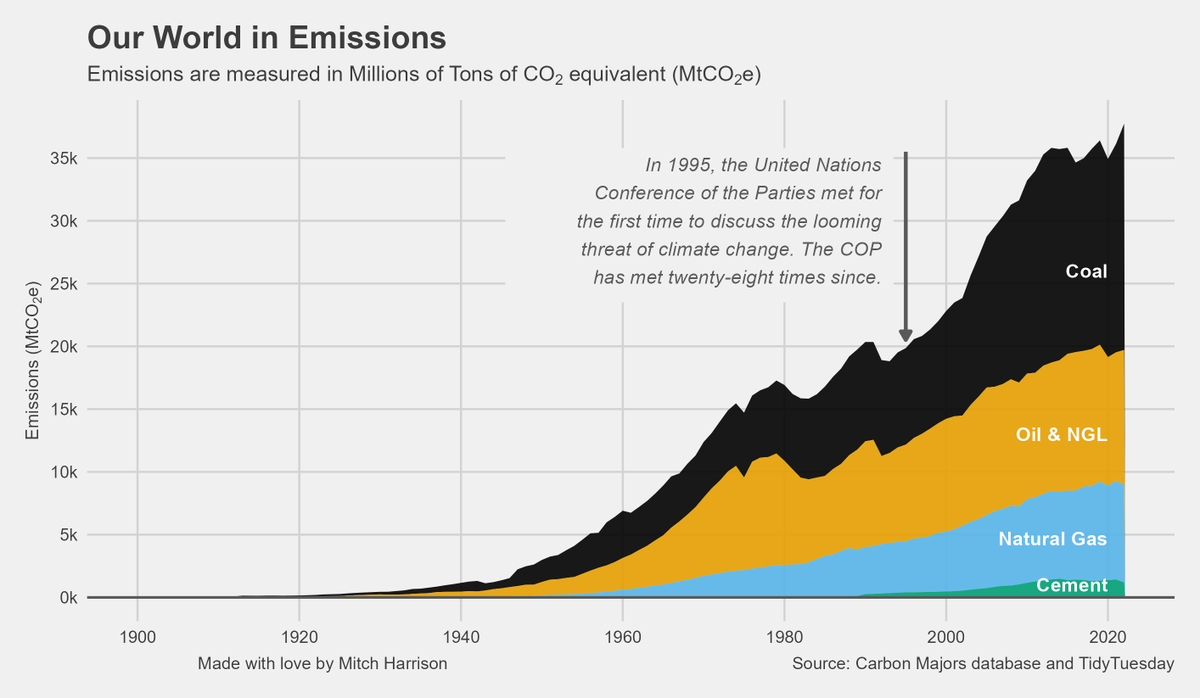
Just published my final statistical project as an undergrad at @Duke. Story is on @Medium, but you can see the R code and data on my website, which is linked at the top of the article! https://t.co/nOZz8UC25q
I built a PokeDex in R with Shiny and Plotly! Happy #TidyTuesday! Check it out here, alongside full source code (linked under the Pokemon images) 💙:
https://t.co/q9VpBDlJQ9
Just posted a new article with some quick analysis of border traffic and opioid deaths. Spoiler alert: solving the fentanyl problem with border policy is probably not going to work. Check out the article (and the code used to build it) here! https://t.co/zW0Udj695a
Just published my final statistical project as an undergrad at @Duke. Story is on @Medium, but you can see the R code and data on my website, which is linked at the top of the article! https://t.co/nOZz8UC25q
I'm playing with the new Quarto dashboard functionality for this week's #TidyTuesday! The dashboard and its source code is available on my @Github pages site! https://t.co/Q1JyaRytgc
Working on converting my course notes into plain-language tutorials so you don't have to spend the six-figure sum to get the same education as me. Love you guys. https://t.co/h4YvXJFAAr
@MelkeyDev Taking an intro to Java class and an intro to R class next semester. So if a new language is the cure, boy I’m getting it straight to the veins.
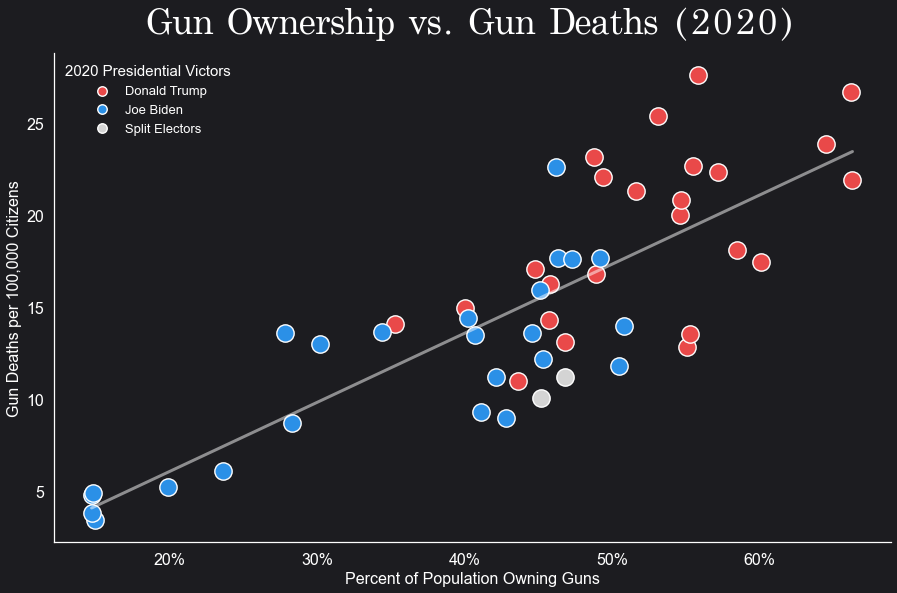
Here's some interesting data I used @matplotlib to explore late last night. Shown is the relationship between gun ownership and fatalities for all 50 US states, color coded along party lines.
Source code is on GitHub as always:
https://t.co/8OUdg68596