Start here.
The Monetary Catalyst reads markets through one lens: monetary policy sets the weather, and credit stress shows up in the plumbing long before it reaches the headlines.
Early, not reactive. And we cover the whole board, not one corner.
Hanno Lustig's August 2026 paper for the Aspen Economic Strategy Group argues that Treasurys no longer pass the observable tests of the safe-asset model. Ricardo Caballero, as Greg Ip reported in the WSJ on August 20th, estimates that about 0.75 pts of the 2.5 pt rise in yields since 2015 reflects a shift from a safety premium to an absorption premium.
We could not reproduce from the open data available to us the adjusted objects behind those arguments: Mota's CDS-adjusted AAA-Treasury spread, the G10 sovererign comparison hedged into dollars, and the Treasury-swap wedge. We rebuilt the nearest public cousins. Their price evidence is mixed.
The attached OECD comparison is unhedged. From the 2015-19 average to June 2026, 10-year yields rose 3.4 pts in the UK, 3.1 pts in Franch, 2.8 pts in Germany, 2.6 pts in Japan, and 2.2 pts in the US. The US moved least, and its gap over Germany narrowed from 2.06 to 1.50 pts. That does not support a uniquely American rout. It also does not isolate a US component within a global move; the hedged comparison used in Lustig's paper removes common movement by construction.
Moody's AAA minus the 10-year Treasury averaged 1.45 pts in 2015-19, 0.99 in 2022-23, 1.00 since January 2024 and 1.13 over the 12 months through July 2026. July was 1.16. The raw spread documents post-2022 compression and a 2025-26 retrace, but it includes credit risk, callability, liquidity and duration differences. It was lower in January 2007, at 0.64. The 12-month mean remains below the 2010-19 average of 1.62 and matches the 2018-19 average of 1.13. Its interpretation depends on the baseline.
The Dallas Fed's June 25 note reported the 10-year Treasury near 40 bps above the swap. The underlying paper analyzes the wedge within a term-funding-premium framework. That documents the wedge but does not apportion term funding, dealer balance sheet scarcity, liability hedging and lost convenience.
Foreign and international investors' share of debt held by the public fell from 48.3% in October 2008 to 30.0% in October 2025, while their dollar holdings reached a record $9.27 trillion. This is share loss, not foreign exit. Separately, Barth-led Federal Reserve research from October 2025 describes Cayman hedge funds as increasingly important marginal foreign buyers of Treasury notes and bonds. These findings do not establish a direct reserve-manager-to-Cayman handoff.
Registered public cousin test: the mean of the December 2026, January 2027 and February 2027 monthly averages of FRED's daily AAA10Y series. At least 1.30 means the raw cousin's retrace continued; 1.00 or less means the compression persisted or deepened; between is inconclusive. It will be computed March 10, 2027.
A U.S. price chart since 2000 is circulating again: hospital services at 410, tuition at 300, and television at 2, with January 2000 = 100. It shows what got expensive over a generation, not what contributed to the CPI rise in the year to July 2026.
Before pulling July data, we selected 5 red categories: hospital services, physicians' services, college tuition, day care, and motor vehicle insurance. Bureau of Labor Statistics Table 7 shows they contributed 2.3% of the 3.4% CPI rise on 8.4% of the basket. Energy and shelter were 29.2% and 33.4% of the rise.
That result turns on insurance. It rose 22.6% in the year to April 2024 but fell 4.5% in the year to July. Without it, the other 4 contributed 6.0% of the rise on a 5.8% weight, about the overall CPI rate and above the 2.5% rate excluding food and energy. Hospital services rose 5.2%.
The Fed's Personal Consumption Expenditures inflation gauge is mixed. Through June, health care rose 3.05% and education 2.16% against 3.29% excluding food and energy, while transportation services rose 7.3%. These annual rates establish neither acceleration nor contribution by weight; we have not done that decomposition. This accounting does not identify cause or the right interest rate.
The registered December test uses the first published December 2026 CPI Table 7. It divides their share of the overall CPI rise by their basket share. A ratio below 1 passes; 1 or more fails. We will also report ratios without insurance and for hospital services alone. If the 5 pass but the 4 fail: "passed on the aggregate, failed without insurance". The windows overlap; this is not an independent replication. Grade date: January 31, 2027.
The Federal Reserve's June policy statement runs 114 words. The July 2025 version ran 248. The guidance sentence, "the extent and timing of additional adjustments," vanished; the commitment to ample reserves stayed.
We assembled all 58 rounds of the FOMC's published rate projections, the dot plot, from original vintages since 2012, scoring matured medians against the target ranges that prevailed, against a no-change forecast, and against NY Fed dealer surveys that close a week before each projection.
Beyond one year, the dots had no aggregate edge. At two years, dealers won 25-11, with 5 ties. At three, mean absolute error was 2.20 points for the dots, 2.16 for dealers, and 1.96 for no change. Of 70 projections at those horizons, four landed within 0.125 point; none did at three years.
Dots beat dealers only for 2022 through 2025 outcomes. That fits a commitment reading, but the audit cannot separate execution from shared reaction functions or persistence.
Chart: Sept 2014 projected 3.75% for end-2017; realized: 1.375%. Dec 2020 projected 0.1% through 2023; 2022 ended at 4.375%.
June did not retire the dot plot. Chairman Warsh withheld his own path; 18 participants submitted theirs. The Fed's backstops have operational records, but no stress grade before use.
Two forecasts: if a 10-observation median of SOFR minus IORB reaches at least +5 bps on observations dated Sept 15 - Dec 31, we expect a balance-sheet response within 15 NY Fed business days but no dated rate guidance. And no participant rate paths in the next four quarterly projection rounds, starting Sept 16.
On a $6.8T balance sheet, the Fed has set reserve top-ups to $0/month: $40B, then $25B, then $10B, now 0. This is a pause, not an end.
The old cushion, ON RRP, holds $450M vs. $2.55T at year end 2022. Reserves fell $199B in 4 weeks. Treasury projects its cash account peaking near $1.05T before Halloween.
SOFR was 3.62% vs. IORB at 3.65% on Aug 12. The Fed's wager: if forecasts miss, funding rates will warn in time to act.
@SamanthaLaDuc One retail-fund data point: Blue Owl's nontraded OTIC reported $110 million of new subscriptions in the first half vs. $843 million of repurchases. Its June tender was nearly 8x oversubscribed.
The NY Fed's Aug 14 to Sep 14 schedule: ~$17 billion of reinvestment purchases and no reserve management purchases. First zero-RMP month since the program began Dec 12.
Bank reserves are $2.944 trillion, down $199 billion in four weeks. ON RRP is $450 million, leaving little of the nonreserve cushion that helped absorb earlier bill waves. The TGA is $964 billion, already above Treasury's $950 billion Sep 30 assumption, with a possible late-October peak near $1.05 trillion. October brings bill increases across the bill curve.
Before April's tax drain, the Desk began buying four months early, citing its reserve-smoothing rationale. Ahead of October, it has set RMPs to zero through Sep 14. That puts more weight on forecasts and market prices, especially SOFR relative to IORB, as issuance and the TGA test a thinner reserve cushion.
Last autumn was a cousin, not a replay. The rolling 10-observation median SOFR-IORB spread first crossed +5bp on Oct 23, peaked at +12bp and remained qualified, with brief breaks, through Dec 10. QT ended Dec 1, five weeks later; that timing does not establish causation. EFFR's five-observation median never exceeded -1bp.
Our registered call, graded Nov 16, is pressure without propagation: a 10-observation median SOFR-IORB at +5bp or higher from Sep 15 through Nov 13, with no linked five-observation median EFFR-IORB at zero or above.
A shareholder who tendered her shares to one of the big nontraded private-credit funds in June, Blue Owl Technology Income (OTIC), had 13.1% of them accepted. Requests do not carry over; to tender the remainder, she files again next quarter.
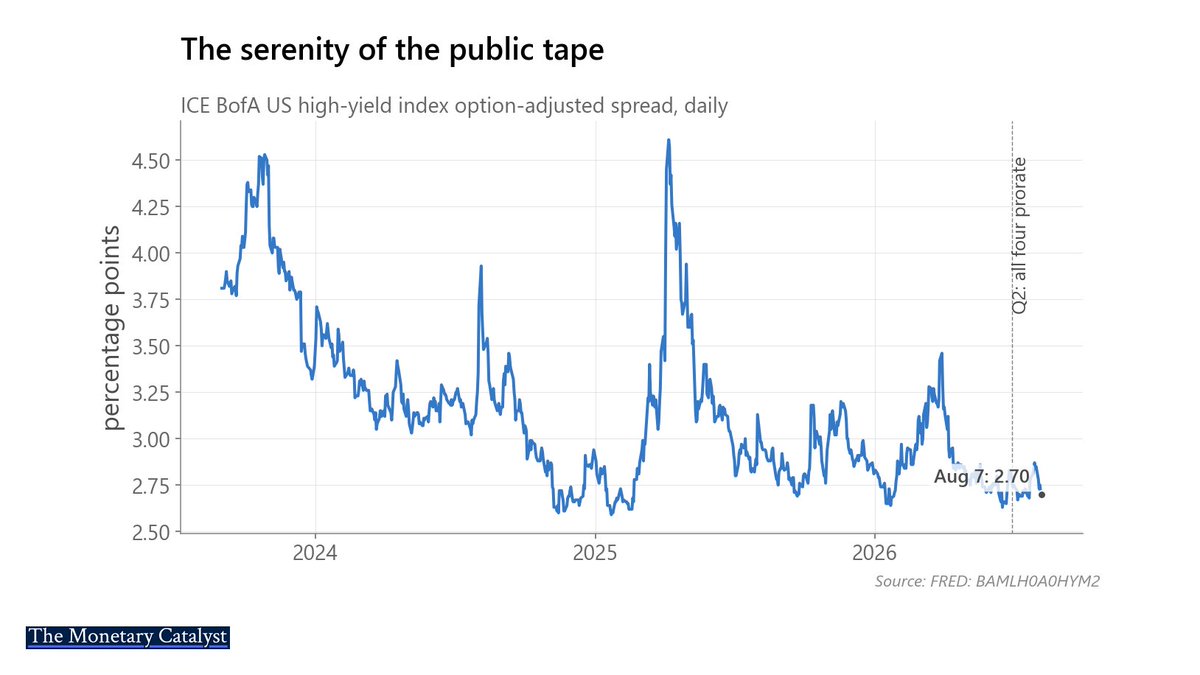
The gates are holding. The four big nontraded BDCs, Blackstone's Bcred, HPS's Hlend, Blue Owl's OCIC and OTIC, prorated their q2 tenders at the 5% cap and paid the accepted shares in non-interest-bearing promissory notes. Fitch says its eight rated nontraded BDCs can manage elevated tenders over the next year. That may be right. It does not address how the paying reshapes the balance sheet.
Start with the word "liquidity". OCIC's July update counted $12.0 billion, including full undrawn credit lines under a measure its own footnote says is "not subject to borrow base restrictions". Its quarterly filing, 13 days later, put the borrowing-base amount available under those facilities at $4.79 billion. At three of the four funds, the payable for shares already accepted for repurchase exceeded unrestricted cash at the latest balance-sheet date.
A fund can honor its capped quarterly repurchases while becoming more leveraged, less liquid, or smaller. We registered fund-level forecasts, graded from named filing lines on May 31, 2027: leverage absorption at Bcred and OCIC, asset contraction at OTIC, flow repair at Hlend.
U.S. nonfarm payrolls fell by 23,000 in July, yet unemployment fell from 4.2% to 4.1%. Household employment fell too, so the lower rate did not reflect an employment gain: the unemployed count fell faster than employment as the measured labor force contracted. The labor force is down nearly one million in two months and 1.3 million over the year. Monthly data are noisy, but the decline dates to last autumn.
The old breakeven rule was 200,000 to 250,000 net jobs a month. Recent estimates range from near zero to 90,000. A weak or negative print now carries less evidence of slack or recession than before.
The inflation signal depends on the cause. If failed job searches push people out, the decline reflects weak demand and disinflation becomes likelier. If retirement, deportation or deterrence shrinks labor supply, productive capacity shrinks too, so July carries less information about rate relief.
Wages currently favor demand: average hourly earnings are up 3.2% yoy and decelerating. Vacancies fell for three months, but openings per unemployed edged higher, a small supply-side counterpoint.
July's real-time Sahm rule indicator was -0.03 against a 0.50 trigger. That does not test exits as such. The rule reacts to rising unemployment; exits alone do not trip it.
The report is weak. Its implication for rate relief remains unsettled.
The Fed is finally making money again. Barely.
Every quarter-point hike bills it ~$7.7B/yr in new interest on $3.1T of reserves, against a repair pace of $25-$37B/yr on a -$235.1B hole. One hike slows the healing by up to a third. Three cut it to $2-$14B/yr.
The tool the Fed trusts most is the one that bills fastest. Full anatomy: https://t.co/47ejmNrazT
We registered the tests in print. Feb 2027: do combined cash outlays hold within 5% of baseline. June: does the spending still register in the GDP equipment line. July: the rate path. Meanwhile CCC spreads sit above 1,000 basis points. Our receipts are filed in advance.
Four megacap AI spenders reported in nine days. Adjusted for the market, Microsoft was paid 13.8 points and Amazon 14.6; Alphabet was docked 5.9 and Meta 9.6. Same boom, opposite verdicts. The sorting is consistent with a new demand: not growth, but cash conversion
Whatever the verdicts meant, no budget blinked. Three of four 2026 capex guides rose the same week: Alphabet to $195-205 billion, Meta's floor to $130, Amazon to $220. The fourth fell $15 billion on a lease reclassification; the plans behind it, unchanged.
We scored our own forecast too. 'The committee will hold': right. 'The room will be quiet': wrong, 9 votes to 3, three preferring a hike, The clauses that could not miss collect nothing. The ledger updates; the fall task-force findings carry the next registered test
We graded the July FOMC against rules published before it met. The 20-year auction: a pre-declared ungraded class. The meeting: a hold, three dissents for a hike, and none of the language either registered test required. The honest verdict: it adjudicated nothing.
The tempting evidence got a hearing and a refusal. Three hawkish dissents, a 5.20% 30-year on meeting day, a chairman deputizing the curve as 'a very accomplished economist.' All tape, none of it the registered marker. A test y ou can loosen after the fact is not a test.
@EPBResearch The identity tracks the profit flow, not the price at which the resulting Treasury stock clears, so the deficit can continue even as its funding terms change
We registered the test in print, graded July 2027: (1) does trailing CPI hold at 3.0%+ or glide to 2.5% or below; (2) do three straight month-end 10-yr breakeven closes clear 2.50% without the real leg collapsing. Neither proves why. Both get scored either way.
The Treasury market did a division this week. 10-yr yield: 4.67%. The split: 2.39% real, the dearest toll since 2008, and 2.28% for inflation. One leg has repriced like something's gone wrong. The other spent 12 months in a 32bp band that contained a war
The quiet number touched 2.50% once through the largest oil-supply disruption in IEA history, and never crossed. The 5-yr breakeven now sits below its pre-war level. Realized CPI: 3.5% PCE: 4.1%. Little visible charge anywhere for the risk the fiscal stress migrates
The committee has cut 170 basis points since Sept. 2024; the 30-year is 110 higher. Net interest runs 20 cents of every revenue dollar. In 1942, subordination entered through the balance sheet, justified as market stability, and outlived the war by six years.
The Fed meets July 28-29. The consensus preview: quietest meeting of the year. The interesting business isn't the funds rate. Five outside-led task forces now sit over the balance sheet, findings due this fall. The oldest question in central banking is back on the docket
Before taking the chair, Warsh proposed "a new accord between the Treasury and the Fed, like we had last in 1951." The 1951 vintage was an exit from subordination. The test for the fall: judge an accord by what it does to the Fed's discretion, not by the history its name borrows