Nifty fell 16% in 5 weeks. FIIs pulled a record ₹1.14 lakh crore in March alone.
But not everything fell equally.
That gap is the most useful signal you’ll see all year. 🧵(stocks just for reference)
Most traders enter good stocks in the wrong sector phase.
Same RS. Same base. Same volume. Different sector context.
Different outcome.
The three phases that change entry quality:
→ Early rotation (3M improving, 6M still low): lower probability, 50-60% size
→ Confirmed leadership (both 3M and 6M top quartile): highest probability, full size
→ Late cycle (12M very high, 3M plateauing): crowded, 25-40% size
Most traders use the same size regardless of which phase they're in.
Sector RS first. Stock RS second. Structure third. That's the sequence.
Full breakdown with worked examples:
https://t.co/TOFhCanwp8
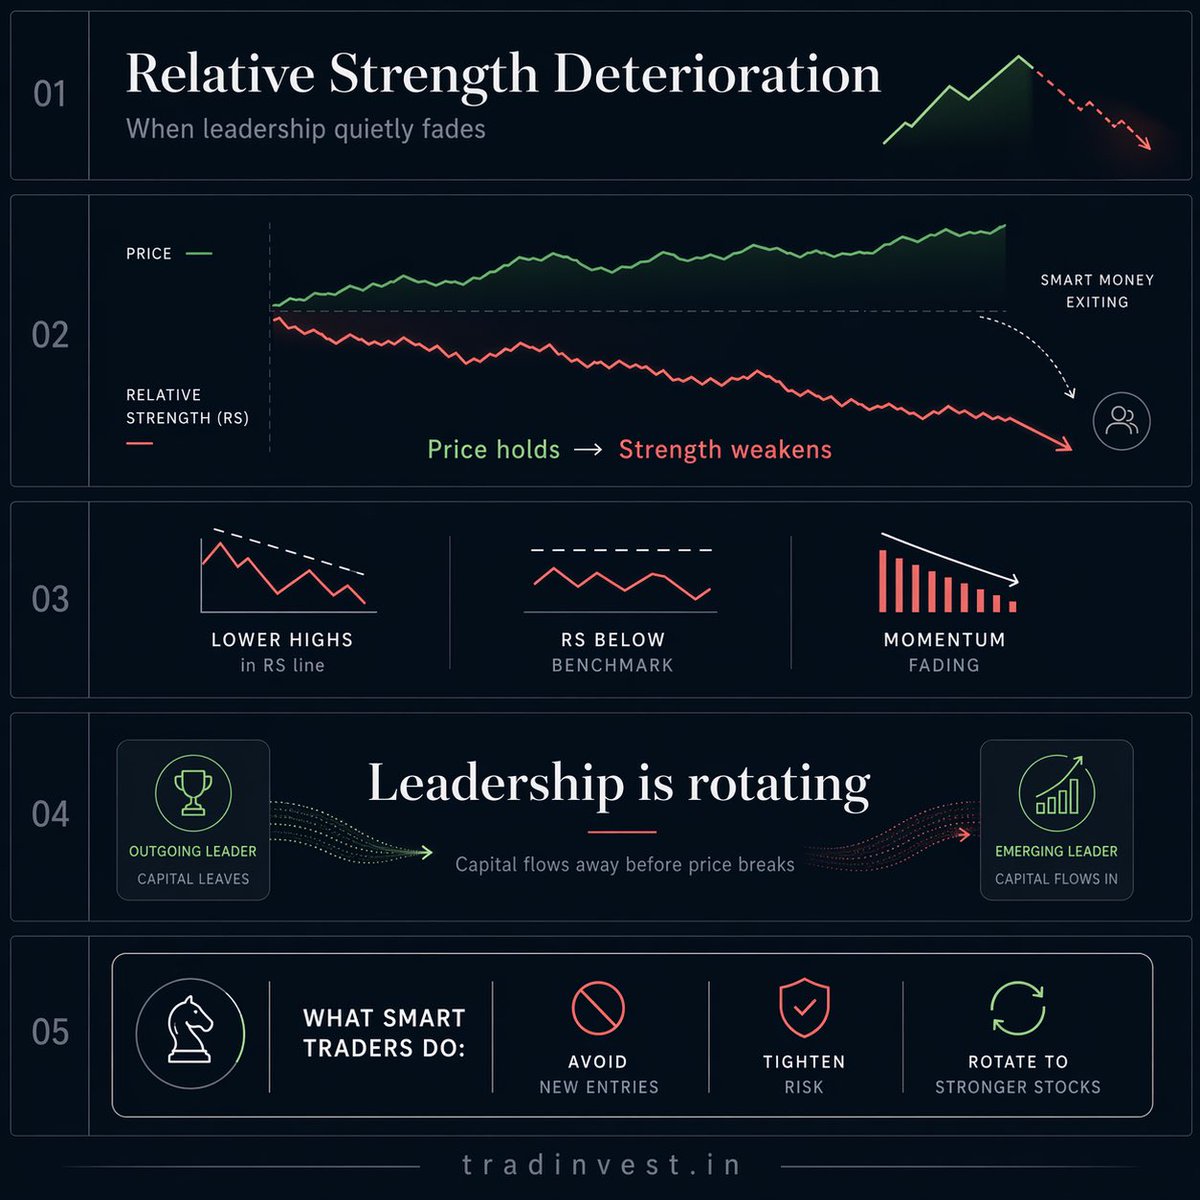
Strong stocks rarely collapse without warning.
The warning just doesn’t show up on the price chart first.
It shows up in relative strength — weeks before the breakdown.
Here’s how to read RS deterioration before you take the loss 🧵
Most traders don’t have a watchlist.
They have a growing pile of “interesting” stocks.
A real swing watchlist should get narrower, not wider:
start with a fixed universe
rank by relative strength
keep names from strong sectors
check market regime
review price structure last
remove illiquid and event-risk names
The goal is not to track more stocks.
It is to track fewer, better ones before the move becomes obvious.
Full breakdown:
https://t.co/hCFWQX3nms
Nifty fell 16% in 5 weeks. FIIs pulled a record ₹1.14 lakh crore in March alone.
But not everything fell equally.
That gap is the most useful signal you’ll see all year. 🧵(stocks just for reference)
False breakouts don’t just cost money. They damage trust in good setups.
Most of them are not random. They happen when price clears a level without enough demand behind it:
weak RS
thin breakout volume
lagging sector
bad market regime
I wrote a practical framework for filtering them before entry:
https://t.co/OlYoUiDlDu
If a breakout passes price but fails context, it usually belongs on the watchlist, not in the portfolio.
5/5
The practical lesson:
Do not only ask, “Is it breaking out?”
Ask:
what did price do before the breakout?
did the range tighten?
did participation dry up?
did the breakout expand in both spread and volume?
That contraction-to-expansion sequence is where many of the best moves begin.
save this 📁 and visit https://t.co/RXRnbxaxIF for more.
1/5
Four charts. Same market principle.
Price + volume contraction often precede explosive expansion.
These examples from NETWEB, HAL, DMART, and DIXON all show the same sequence:
price range tightens
volatility compresses
volume dries up
then demand expands through the pivot
Once you learn to see that transition, charts start reading very differently.
DMART and DIXON both reinforced the same point.
DMART:
range compressed 41.5%
breakout volume 2.42x
follow-through 14.26%
DIXON:
range compressed 50.3%
volume dried up 68.5%
breakout move 9.83%
Different sectors. Different dates. Same structural story.
13/
Wrote the full breakdown:
-- The PEMA framework in detail
-- A worked example showing a bad review vs a useful one
-- What to measure across six dimensions
-- A full weekly checklist you can use immediately
-- Why Indian markets make this even more important
Read it here:
https://t.co/NmFV88WPH5
Save this thread. Run your next review differently.
1/
Most traders who journal still don't improve.
Not because they're lazy.
Not because they lack discipline.
Because they log trades and call it a review.
Those are two completely different things.
12/
The traders who improve fastest are almost never the ones who trade the most.
They're the ones who review the most honestly and act on what the review tells them.
30 to 45 minutes every week. Same framework. Honest answers.
That compounds into measurable process improvement over months.