Swing Trade
Entered $NEE 1/16/26 $87.50C
Entry: $2.10
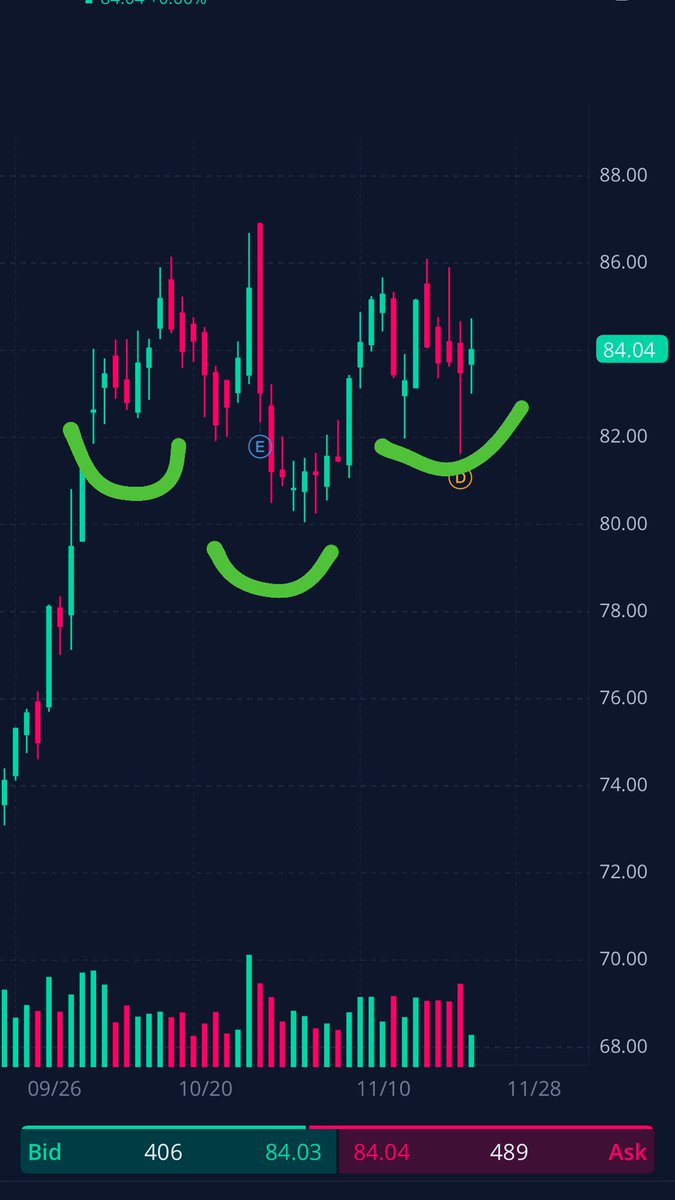
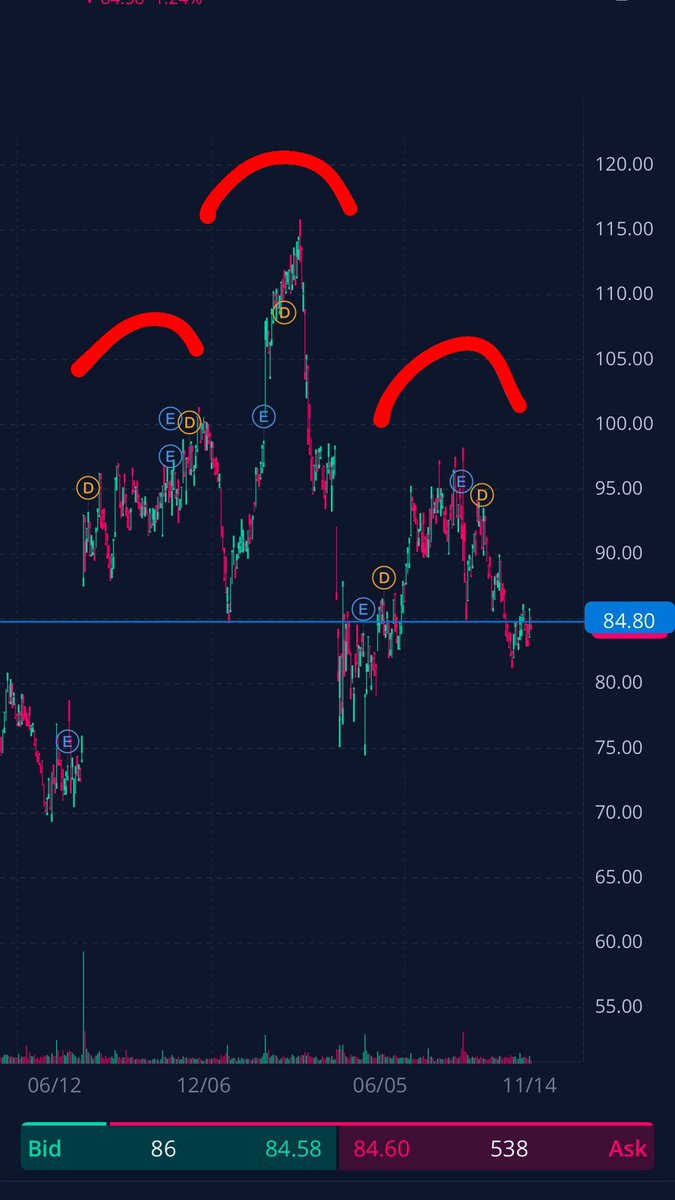
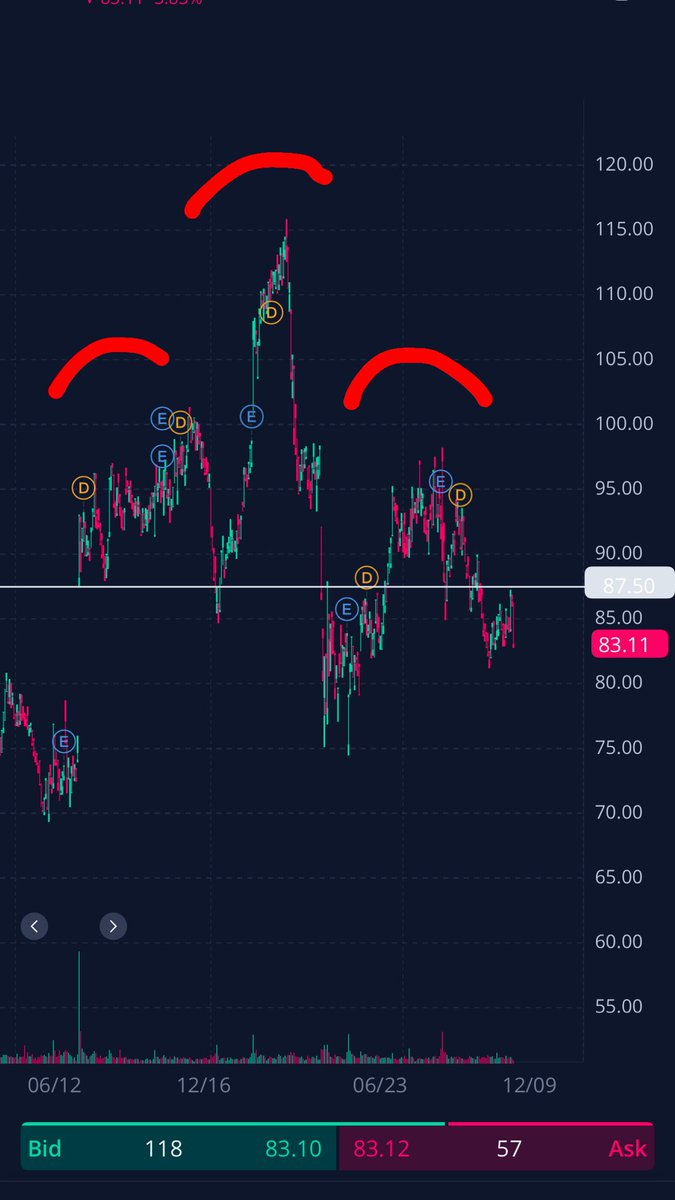
• Inverse Head & Shoulders on the daily
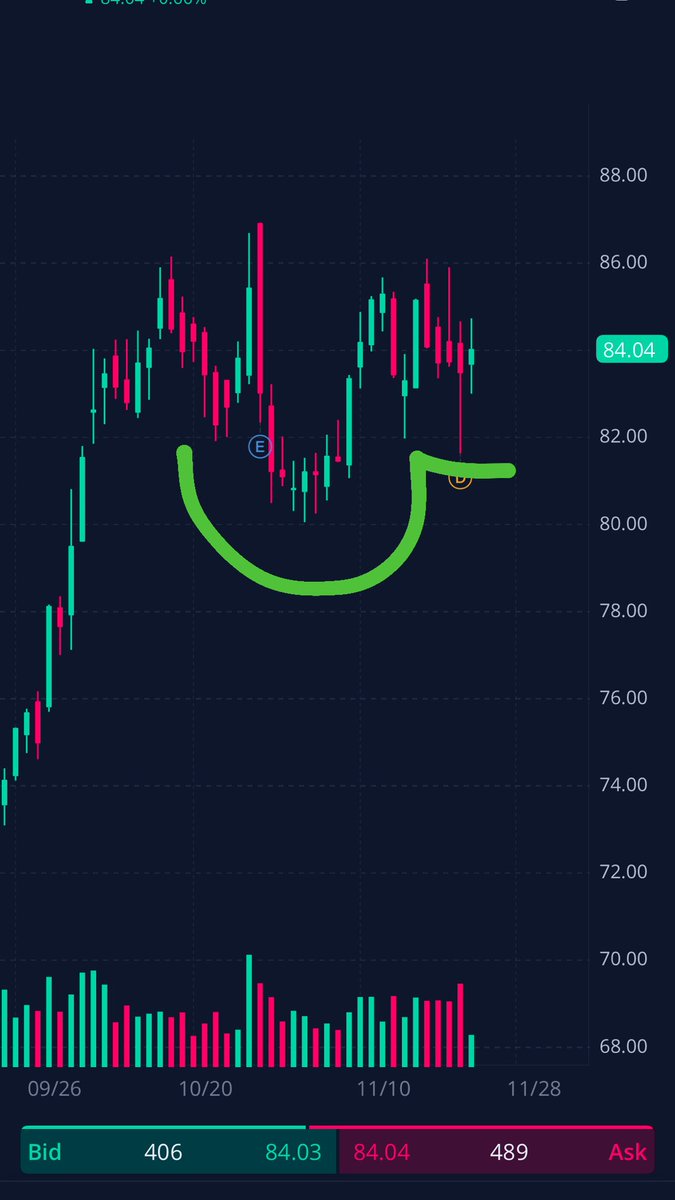
• Cup & Handle on the daily
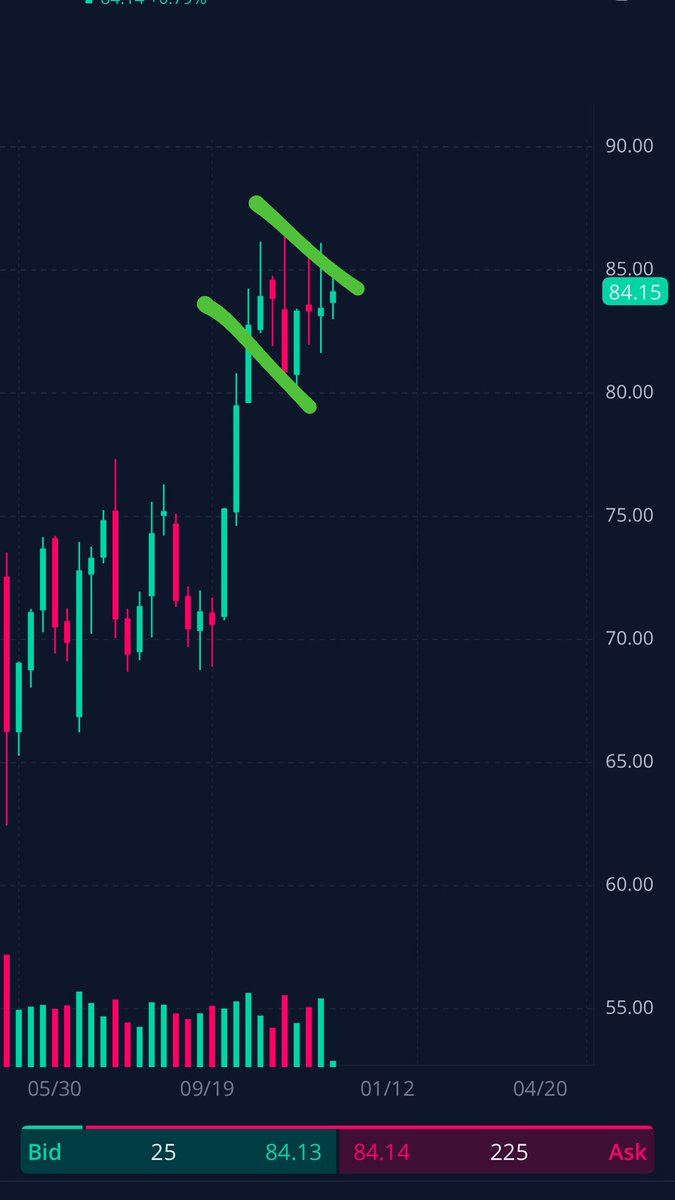
• Bull Flag forming on the weekly
• Clean structure + strong momentum setup
Stop loss: $84
#NEE#OptionsTrading#SwingTrade#TechnicalAnalysis
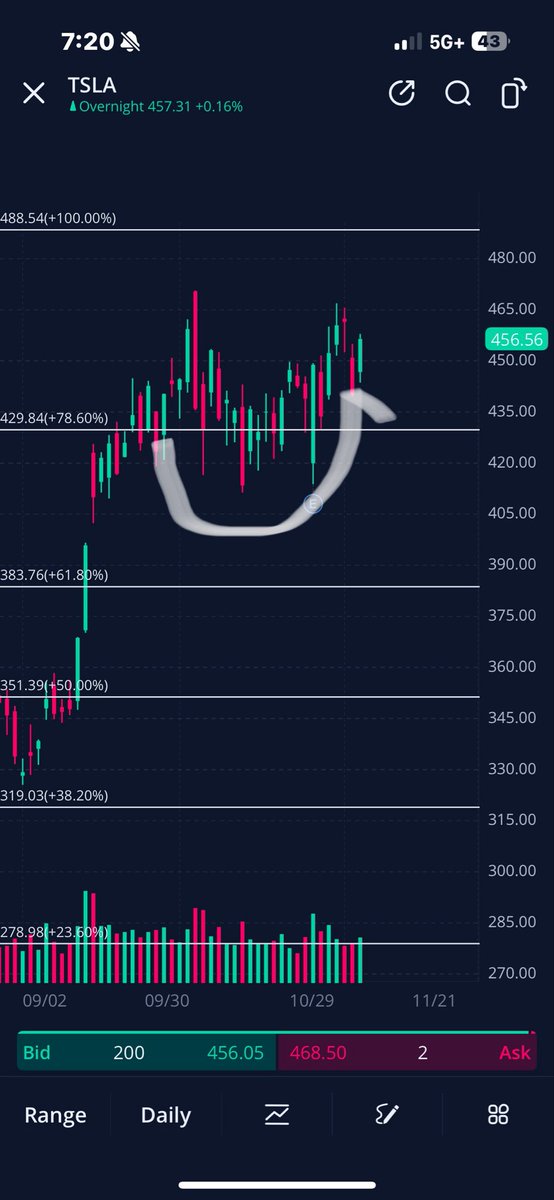
Cup and handle on $TSLA 🚀
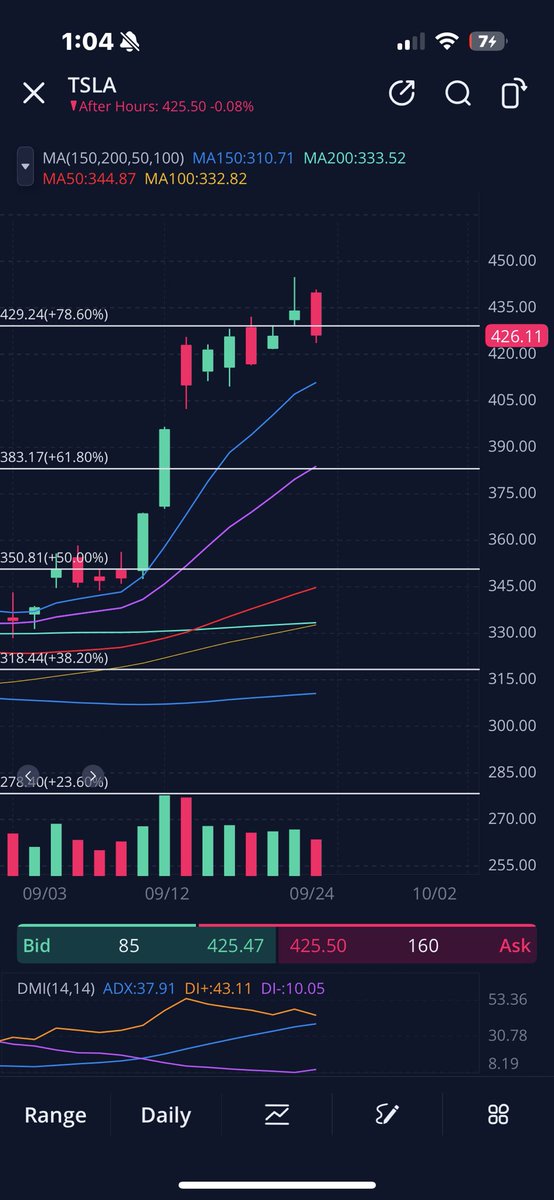
This pattern is forming right above the 78.60 fib level. This has the opportunity of breaking out to ATH. Looking for a move past ATH and to $520+
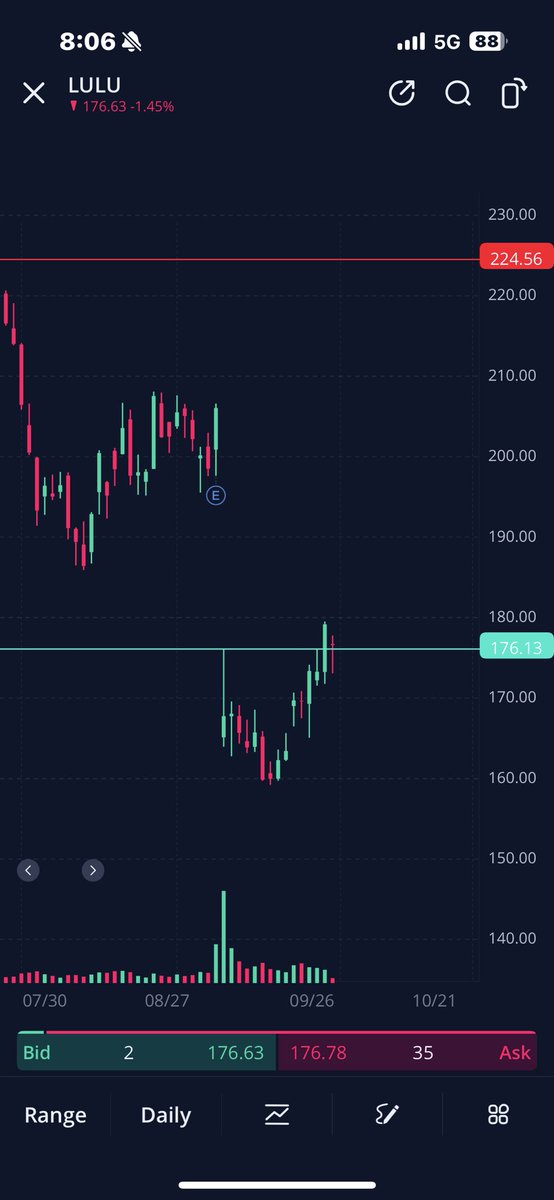
Lululemon has entered its gap. I’m expecting $LULU to go higher from here and to at least fill its gap. The bottom might be in for this stock.
If you like their brand and shop their products, this is a strong buy 📈
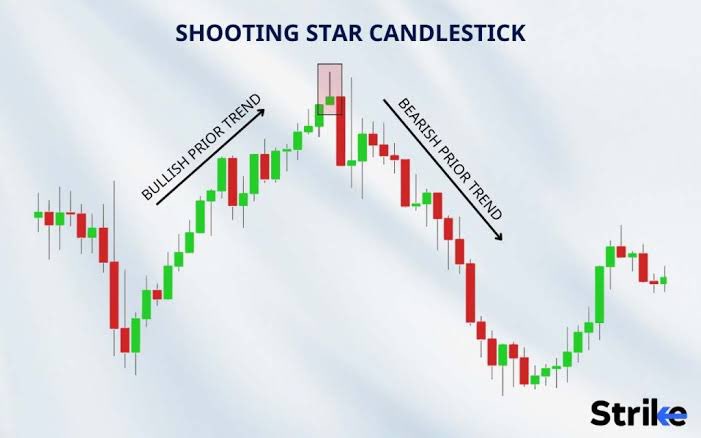
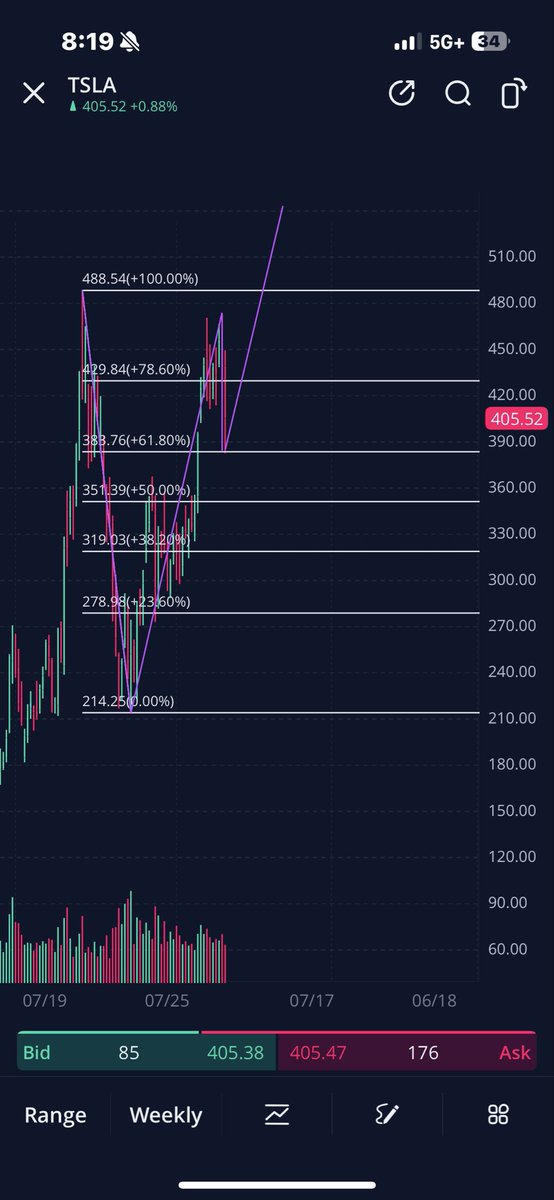
Looking for a pull back on $TSLA to about $390. Yesterdays candle showed a textbook shooting star candle, while today’s candle was an engulfing candle that brought us under the 78.60% fib level. Anything can happen, but my money is on puts 📉
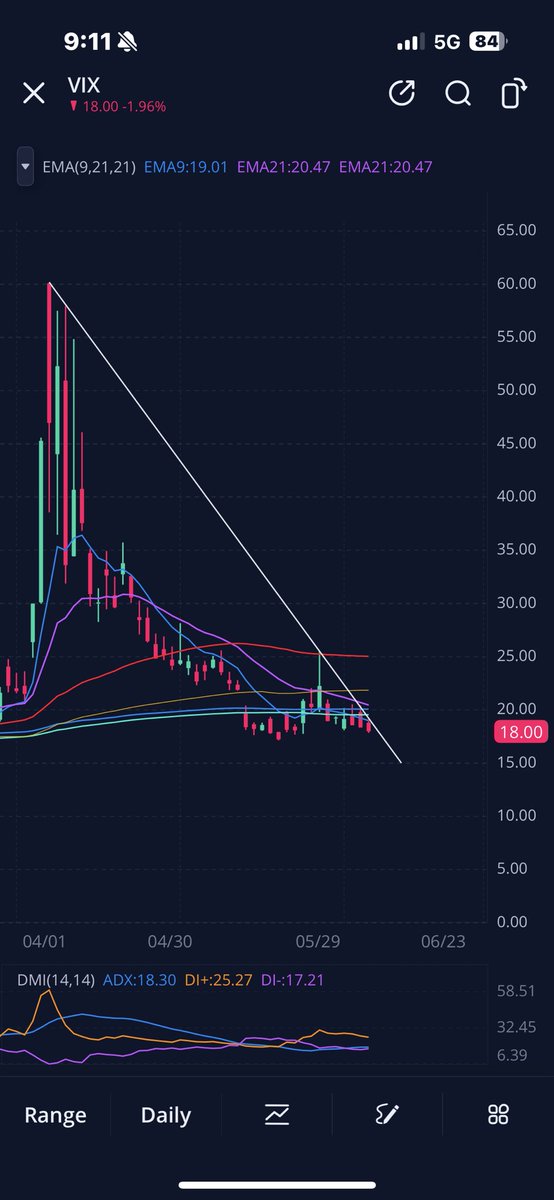
⚠️ Wildcard: $VIX is compressing under the liberation day trendline.
If VIX breaks out with volume:
→ Bearish bias increases
→ $TSLA puts become more favorable
→ Risk-on names like $AMD could stall
VIX is the key signal. 👀
#VIX#Volatility#MarketOutlook#OptionsTrading
🚨Trade Setups on Watch: $TSLA Puts & $AMD Calls🚨
In this thread, I’ll break down two key setups I’m tracking — one bullish, one bearish — depending on how $VIX behaves near a major resistance trendline.
Let’s dig in. 🧵👇
#OptionsTrading#TechnicalAnalysis
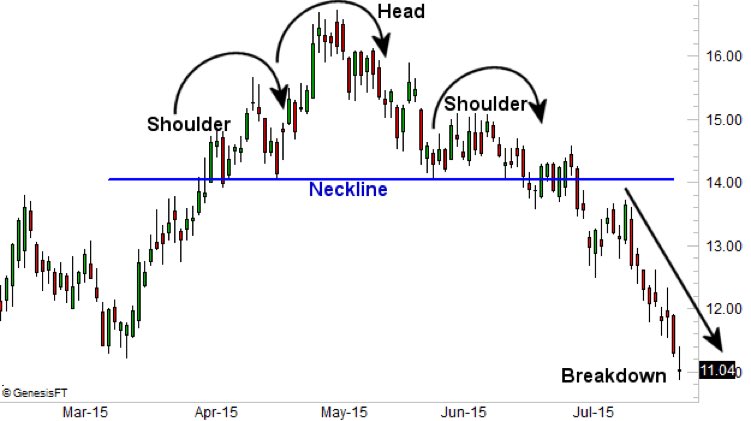
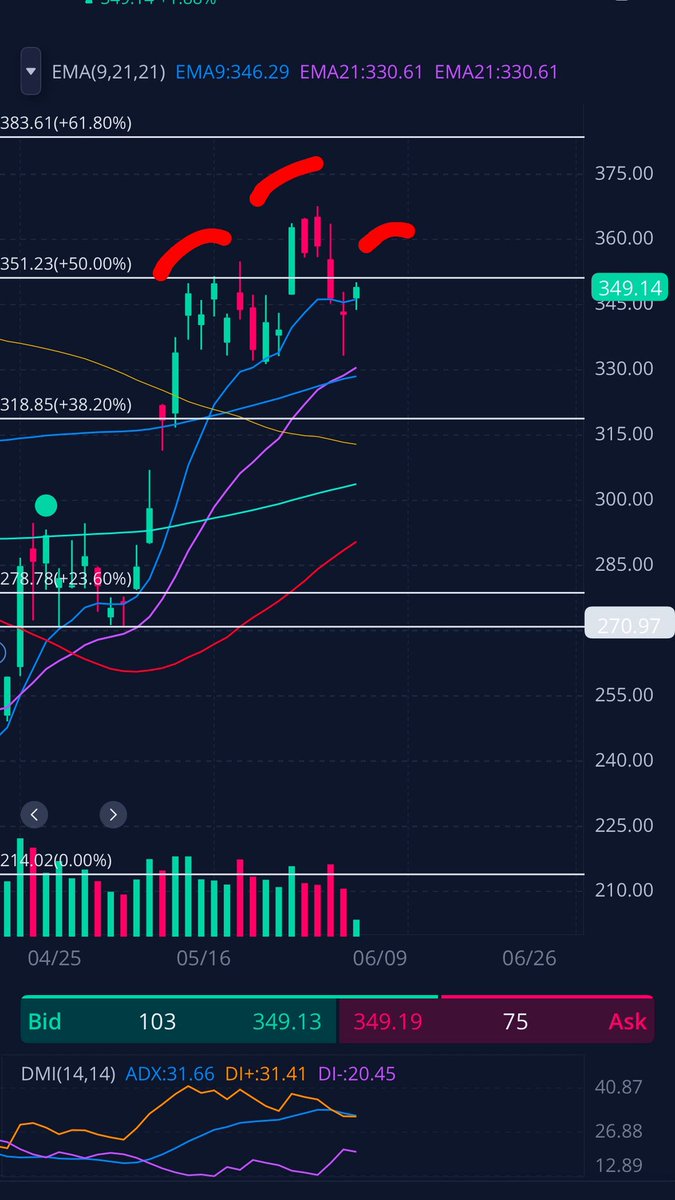
📉 $TSLA – Potential Head & Shoulders Top
•Clear H&S forming below 50% Fib resistance (~$360)
•Struggling to reclaim neckline support
•Eyeing puts if breakdown under $345
#TSLA#Bearish#HeadAndShoulders#Options
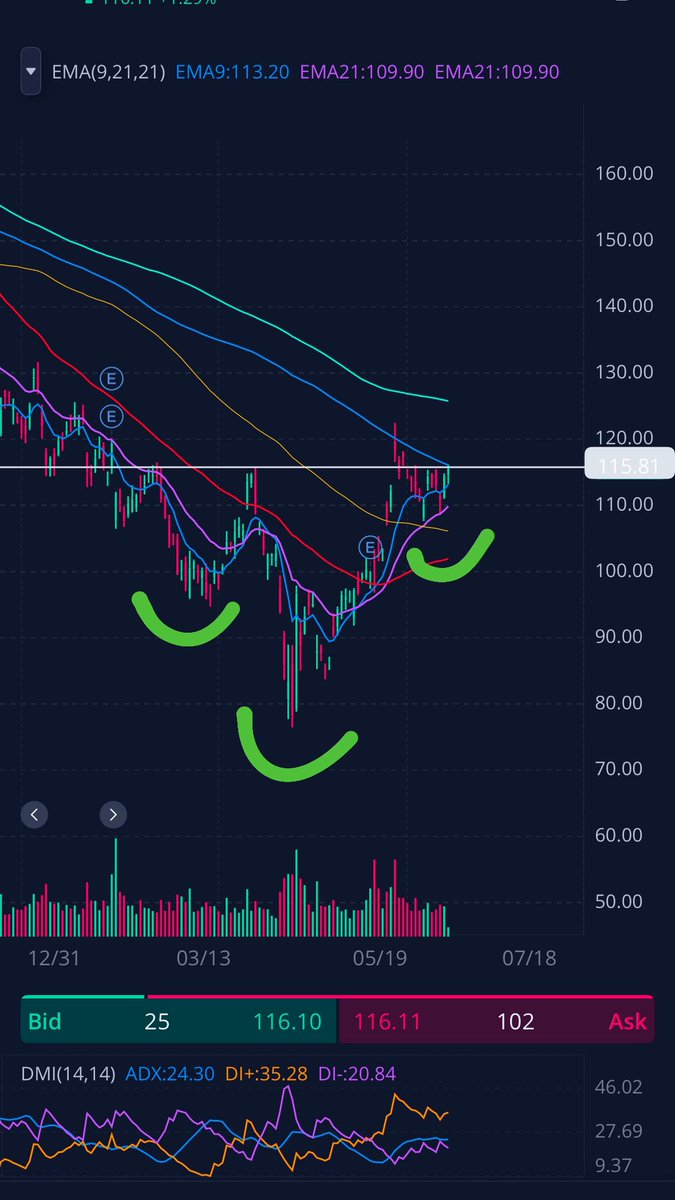
📈 $AMD – Inverse Head & Shoulders Forming
•Potential breakout from classic IHS pattern
•Trading above 9/21 EMAs with strong trend momentum
•DMI: DI+ > DI-, ADX rising
•Watching for a breakout > $116 to target ~$125+
#AMD#Bullish#ChartPatterns#Options