MRCI provides historical seasonal research for commodity futures and spreads, delivering data-driven insights and risk management for speculators and hedgers.
In today's headline-driven markets, traders need context—not noise.
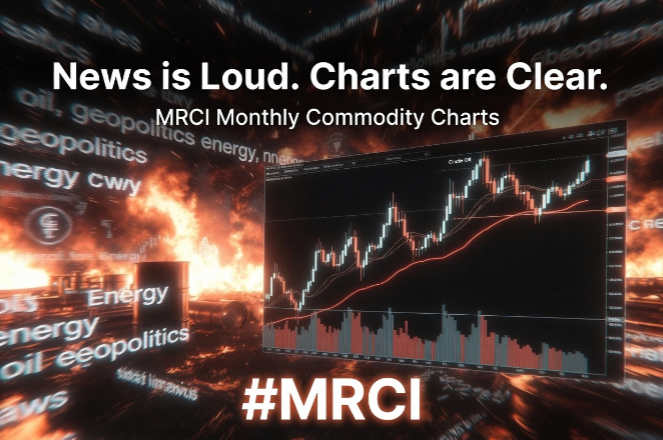
#MRCI's Monthly Commodity Charts provide the long-term perspective: historical highs and lows, major support & resistance levels, and key trend structures that can help identify opportunity and manage risk.
Crude Oil is a great example:
https://t.co/lu0TUh7Yg1
This is just 1 of 55 charts we track across the commodity markets.
Want the complete PDF containing all 56 Monthly Commodity Charts?
Email [email protected] and we'll send you the PDF file with all 55 charts for FREE!
Stop guessing. Start trading with context.
#FuturesTrading #CommodityTrading
Harvest is approaching, and wheat producers will soon become active hedgers in the futures market. That selling pressure can create important spread
opportunities.
Use #MRCI's Special Spread Chart Files to uncover seasonal wheat spread patterns, monitor historical tendencies, and prepare for the months ahead.
Don't wait for the move—study the spreads now! FREE until 6/30/26! https://t.co/cmfonBjKYV
The September 10-Year Treasury Futures just became the new front month.
This rollover moment is exactly when smart traders pull up #MRCI's Special Futures & Cash Files to review historical performance and upcoming seasonal patterns around this contract.
Knowing how this specific month has performed in the past — and what seasonal tendencies are approaching — can give you a real advantage in anticipating volatility and positioning.
FREE until 6/30/26! https://t.co/wMLNPQopVk
Seasonal Power for Energy Success! Natural Gas rallies late summer—Crude peaks in driving season. #MRCI's New Historical Energy Report is your trusted GPS! Don’t miss a turn! https://t.co/kmzps0qVgd
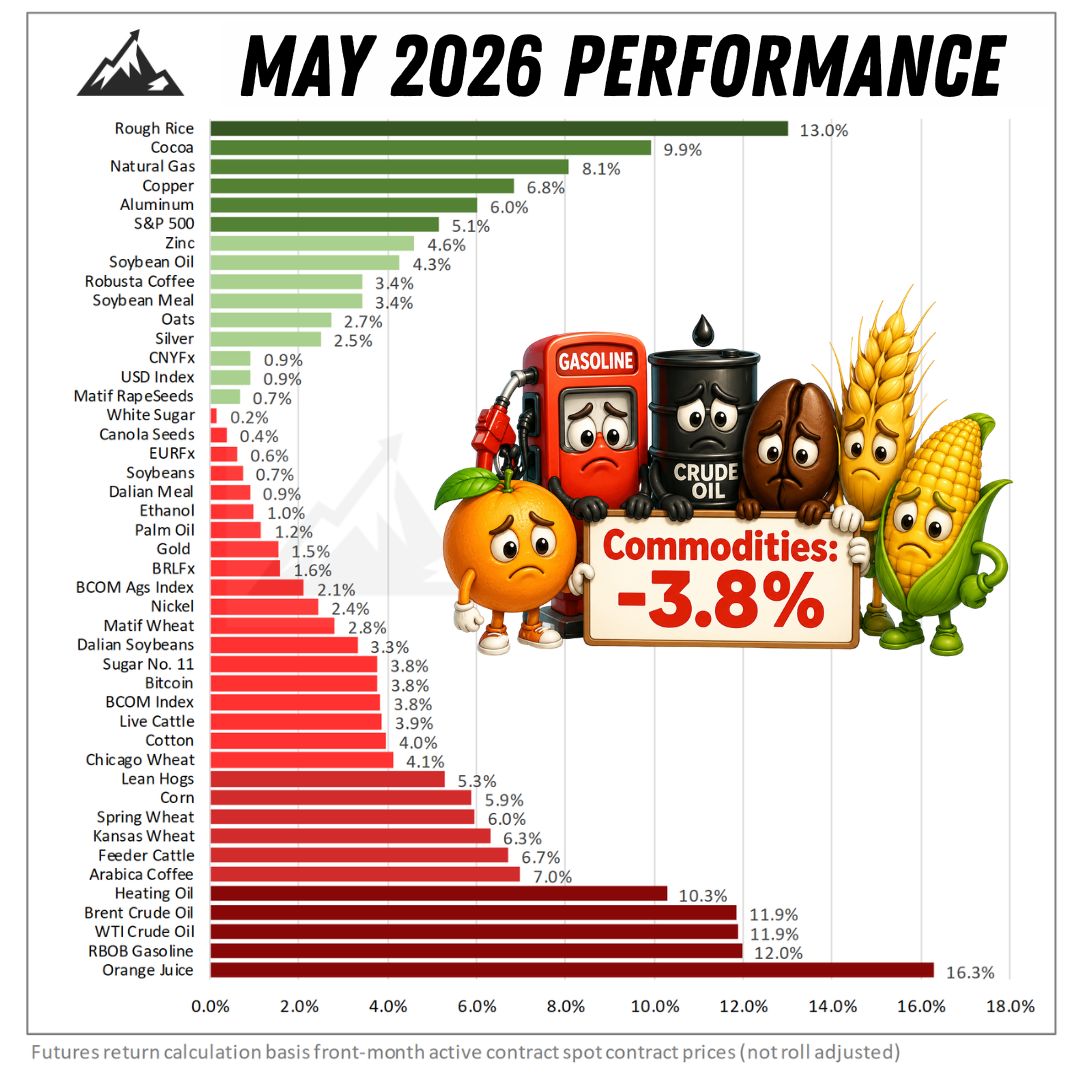
📉 May was a bearish month for most #commodity markets. The Bloomberg Commodity Index fell -3.8% as better U.S. weather ☀️, progress in U.S.-Iran negotiations 🤝, a firmer dollar 💵, and bearish seasonal turns ⬇️ weighed on prices.
What's next?
🌽 June weather markets. 🌦️
June is shaping up to be a major market mover!
Don't get caught off guard by report dates or contract expirations. Get the FREE #MRCI June Commodity Calendar for a one-stop source of USDA reports, EIA energy data, and crucial exchange holidays. https://t.co/0qYLNnF4rZ
June is shaping up to be a major market mover! Don't get caught off guard by report dates or contract expirations. Get the FREE #MRCI June Commodity Calendar for a one-stop source of USDA reports, EIA energy data, and crucial exchange holidays.
https://t.co/0Qxc3mv3ad
If you trade or hedge energy, #MRCI's brand new Energy Report is your roadmap for the year!
Stop guessing and start aligning with proven seasonal tendencies. https://t.co/q8OYF9n7YJ
#EnergyTrading#CrudeOil#NaturalGas
Halfway through the year already!
Before you act on the "Sell in May" adage, ask yourself: What do the real seasonal patterns show?
MRCI's June Seasonal Trades deliver time-tested guidance to help you navigate June and position confidently for the months ahead. https://t.co/yCDuKkCV5Z
Seasonal intelligence beats folklore! Exclusively available to #MRCI subscribers.
After the long Memorial Day weekend kicks off vacation season, many traders return complacent and miss key moves. Don't let that be you!
MRCI’s 15 June Seasonal Spread Trades are now posted. https://t.co/yUimTdealu
Stay sharp and stay seasonal - exclusively available to #MRCI subscribers.
The #MRCI AUD seasonal setup into the June futures expiry is one of the cleanest in months. EOFY repatriation and hedging flows are hitting as Aussie firms square books ahead of June 30, while winter wheat and canola exports drive real trade flows into Asia. Add a pausing Fed that's erasing the USD's yield edge, and you have genuine buying pressure meeting a softer dollar. This isn't just a chart — it's real money flows lining up. Traders and hedgers are taking notice!
https://t.co/duZoxfvMxp
Trading edges are about stacking probabilities, not just predictions. #MRCI's latest complimentary chart file highlights key seasonal patterns for the Nov/July Soybean spread (new crop-old crop), showing how historical trends can improve your decision-making. Don't guess, use data! https://t.co/iBhSIrFrzN
Nov Soybeans hitting new highs? Track the seasonal trend with #MRCI's FREE June Soybean Highlights. Daily/Weekly/Monthly historical stats. Complete with our "Scenario" approach for active traders. Don't trade blindly this summer. https://t.co/HgTItGSJf0
FREE RESEARCH: Think you know cocoa? The #1 rated Commodity of the Week from Moore Research Center has arrived! See the 15-year seasonal pattern with
80% historical reliability. Don't miss this high-probability setup. https://t.co/36V3CCo6Ch
Why hedge your bets blindly? With #MRCI's daily updated correlation matrix, you can identify which assets move together (+90) or opposite (-90). Benefit: Avoid accidental double-positioning (longing two highly correlated assets) and ensure true diversification in your portfolio. https://t.co/YVhIFaf6XJ
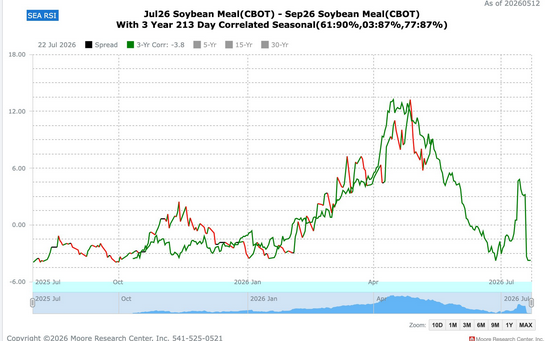
Imagine having instant access to a single place where you can view historical performance, seasonal patterns, and future projections.
That's what MRCI's Spread Correlation page gives you.
Check the Soybean Meal Spread right now — would you sell this market based on what you see?
Serious spread traders know: visual clarity creates confidence.
*Exclusively for #MRCI subscribers: https://t.co/2bKh4nsQBE