As a recent founder, we have 5 customers but would like to get to 20 next year.
We're reworking one product to what customers say they want, but we're struggling to grow based on some email marketing.
Is there a good way to know when a product isn't what customers want and to try another?
Can 💰 buy happiness? If so, for who?
New research by Killingsworth et al. (2023) shows the answer is mostly yes, but not for everyone.
To explain, let's meet our four archetypes of rich, poor, happy, and sad.
Who benefits most from more 💰- Ghandi, Elon, Joe, or the Donald?
Can 💰 buy happiness? If so, for who?
New research by Killingsworth et al. (2023) shows the answer is mostly yes, but not for everyone.
To explain, let's meet our four archetypes of rich, poor, happy, and sad.
Who benefits most from more 💰- Ghandi, Elon, Joe, or the Donald?
This week Mr. Graph, himself an unageing digital avatar, ponders human mortality.
At 25, ever wondered how many years you got left?
Turns out that having just one thing is linked with 58 more years of life, but without it only 50.
Can you guess it? (answer in next post)
What’s the odds of getting a lost wallet back? 👛
Thanks to researchers who turned in 17,000 ‘lost’ wallets around the world🌎 to see how many got back to owners, we can now make a good guess.
The odds of return are ~50% on average, but the country you lose it in matters👇
The study also had an unexpected finding.
See if you can guess.
What's more likely to be returned - a wallet with money or a wallet without money? (answer in the next post)
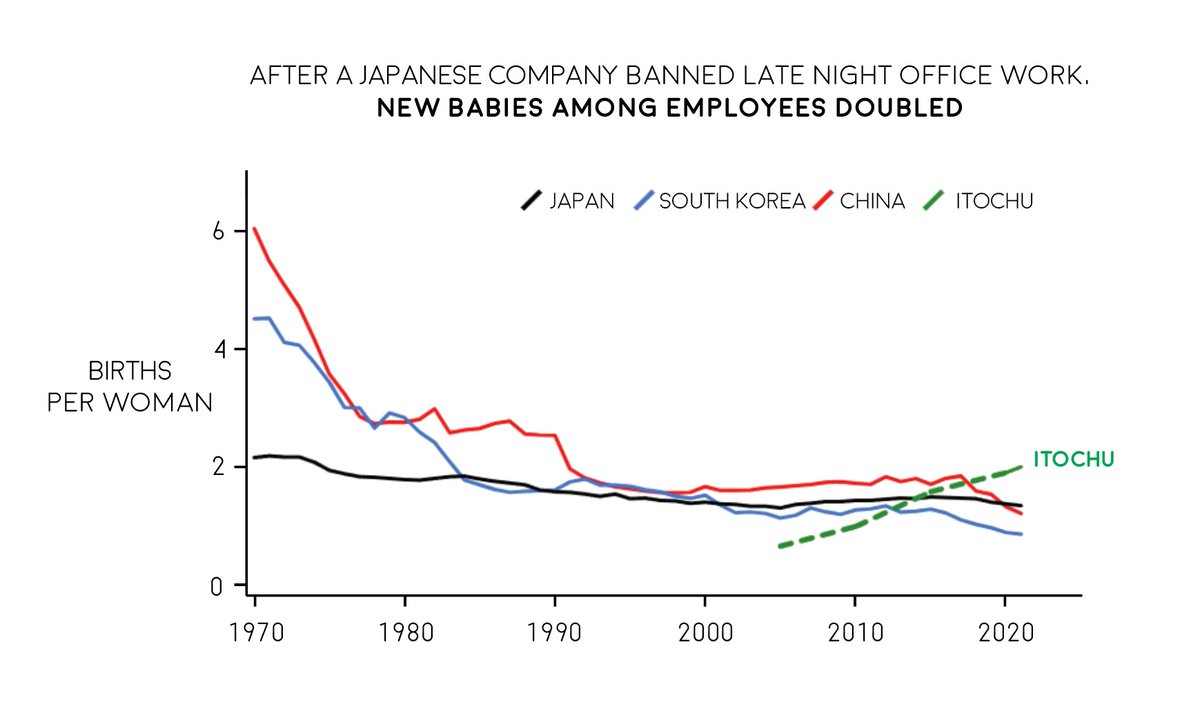
The aim of the ban was to boost productivity, which it did.
What they did not expect was that new babies among employees doubled over the next 10 years👶
Turns out, work-life balance is a modern aphrodisiac.
What happens when companies ban late night work?
The Japanese company Itochu tried it.
- No work after 8pm.
- Security guards patrolled the office at night telling workers to go home.
The results were not what they expected...
👇👇👇
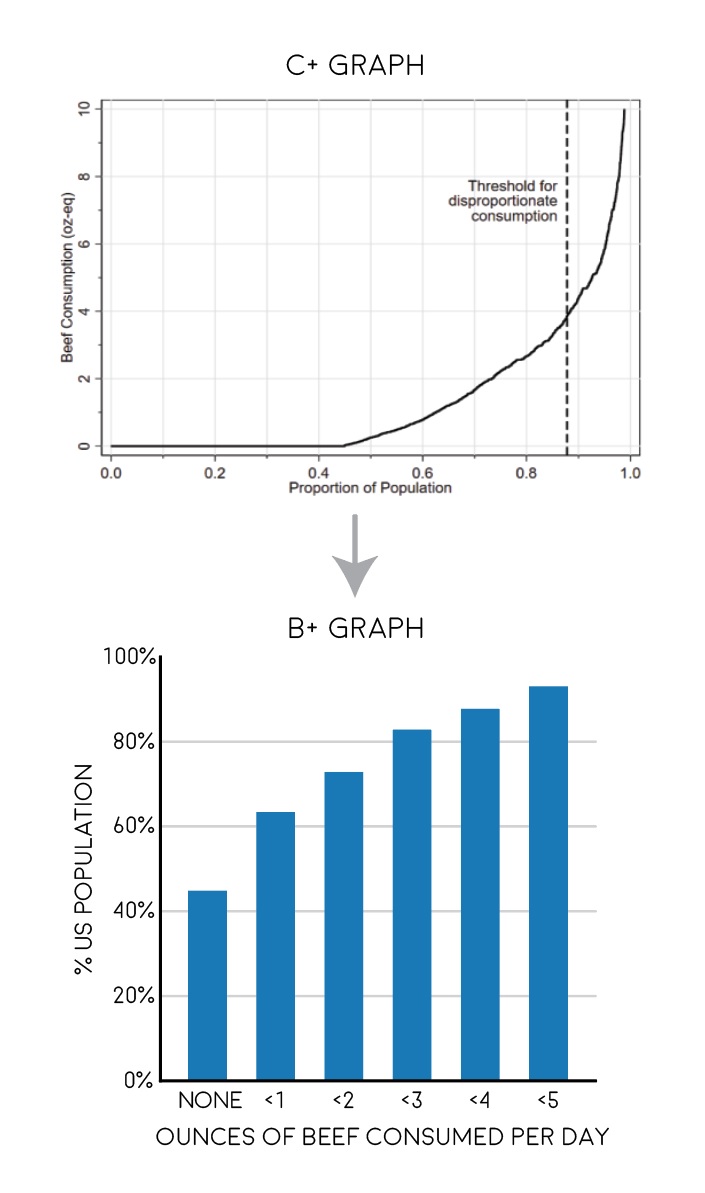
In Round 3 of ‘bad graphs’, Mr. Graph tackles a graph with an identity crisis - a bar chart who think it’s a cumulative distribution.
Grade: C+
• This graph is trying too hard
• Do we really care about ‘cumulative distribution of beef consumption’?
• We fixed it (a bit)👇
In Round 2 of ‘bad graphs’, Mr. Graph unfairly picks on AI expert @krishnanrohit
Grade: C+
• Mixing tax-to-GDP & tax rates on same axis = misleading
• Too much text, too many colors = confusing
• Still, way better than @elonmusk graph skills
Here's how to make it an A+👇
In Round 2 of ‘bad graphs’, Mr. Graph unfairly picks on AI expert @krishnanrohit
Grade: C+
• Mixing tax-to-GDP & tax rates on same axis = misleading
• Too much text, too many colors = confusing
• Still, way better than @elonmusk graph skills
Here's how to make it an A+👇
In Round 2 of ‘bad graphs’, Mr. Graph unfairly picks on AI expert @krishnanrohit
Grade: C+
• Mixing tax-to-GDP & tax rates on same axis = misleading
• Too much text, too many colors = confusing
• Still, way better than @elonmusk graph skills
Here's how to make it an A+👇
In Round 2 of ‘bad graphs’, Mr. Graph unfairly picks on AI expert @krishnanrohit
Grade: C+
• Mixing tax-to-GDP & tax rates on same axis = misleading
• Too much text, too many colors = confusing
• Still, way better than @elonmusk graph skills
Here's how to make it an A+👇