My dear friend & colleague you will continue to be part of our EL advocacy team from heaven. Thank you for all your love & support. @ouhsdmaestra & I were fortunate to have you in our lives. Mil gracias por todo, te extrañaremos por siempre querida Reveles💜
New #DataNugget alert! Students use a @KonzaLTER long-term dataset to study how rain that falls in a given year can affect the health of bison calves born the following spring. Pairs great with @USLTER Schoolyard series book, and full dataset available!
https://t.co/rMt0jCDmiO
@teacher2teacher This week I have been trying @MarisaEThompson s TQE. Students leave a postit with a key Takeaway from the lesson, a Question, and something about their class Experience . Great formative and SEL feedback.
@MarisaEThompson @teacher2teacher@OxnardUnion The E is on the back of the post-it. This was the second day, and it went really well, they really seem to like doing it. Yes please feel free to use as an example. I can send you pics of the E too if that would be helpful.
@teacher2teacher Not so much a strategy, but a methodology...I use the 5 E model. Start with an Engage phenomena, then a series of Explore activities that let the students figure out what is going on, and then Explain it, followed by Evaluate activity where they apply , then an Extend activity
Join @STEMscopes for a Data Literacy Virtual Workshop on Wednesday, November 16! Using phenomena in science or STEM classes is very important. Students can be engaged in gathering and analyzing data by using TUVA and Interactive PhET simulations.
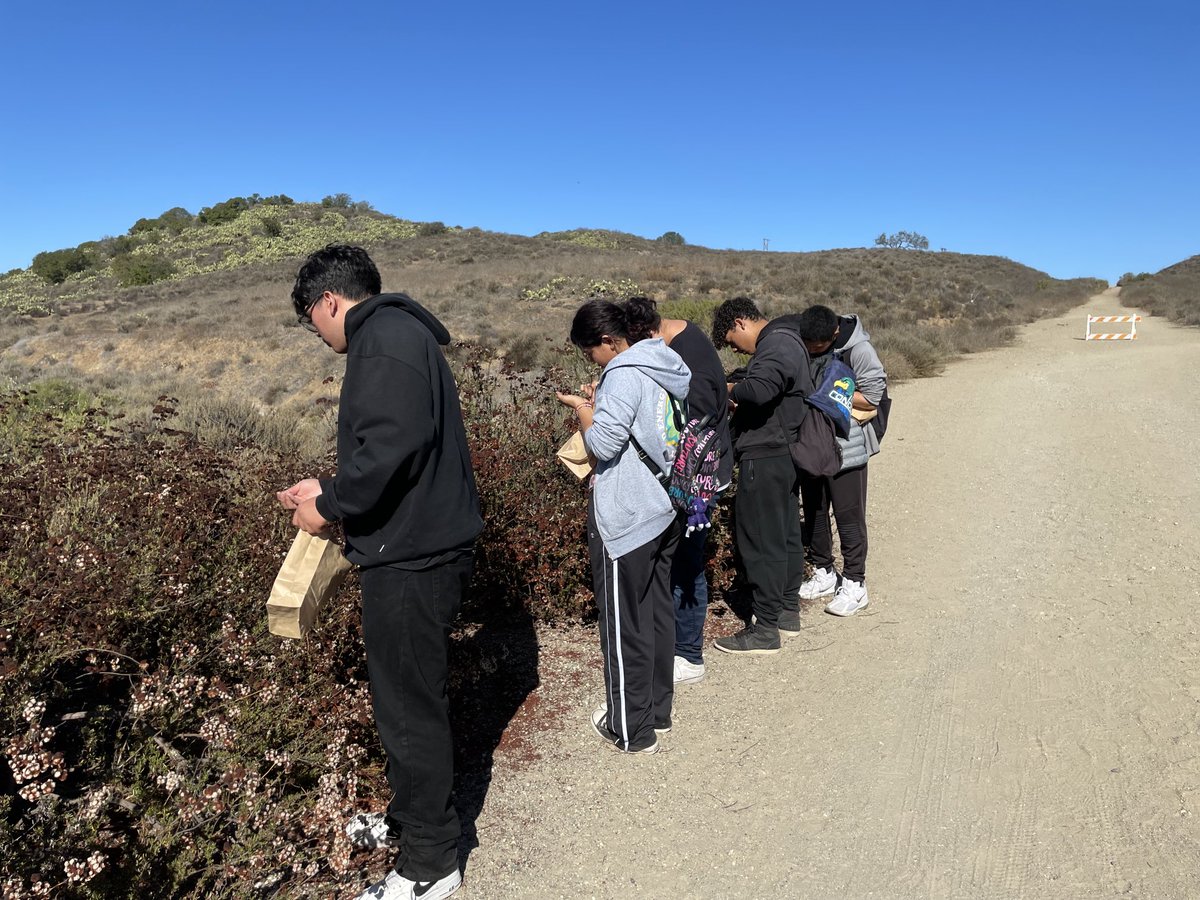
MSA is collecting native buckwheat seeds in the Santa Monica Mountains National Recreation Area. Future native nursery managers and conservationists in training.
When teaching about distance-time graphs and velocity-time graphs, this simulation might be useful, for students to play with. Quite addictive! They need to replicate each graph by moving the caterpillar 🙂https://t.co/38zm6e5Yr8