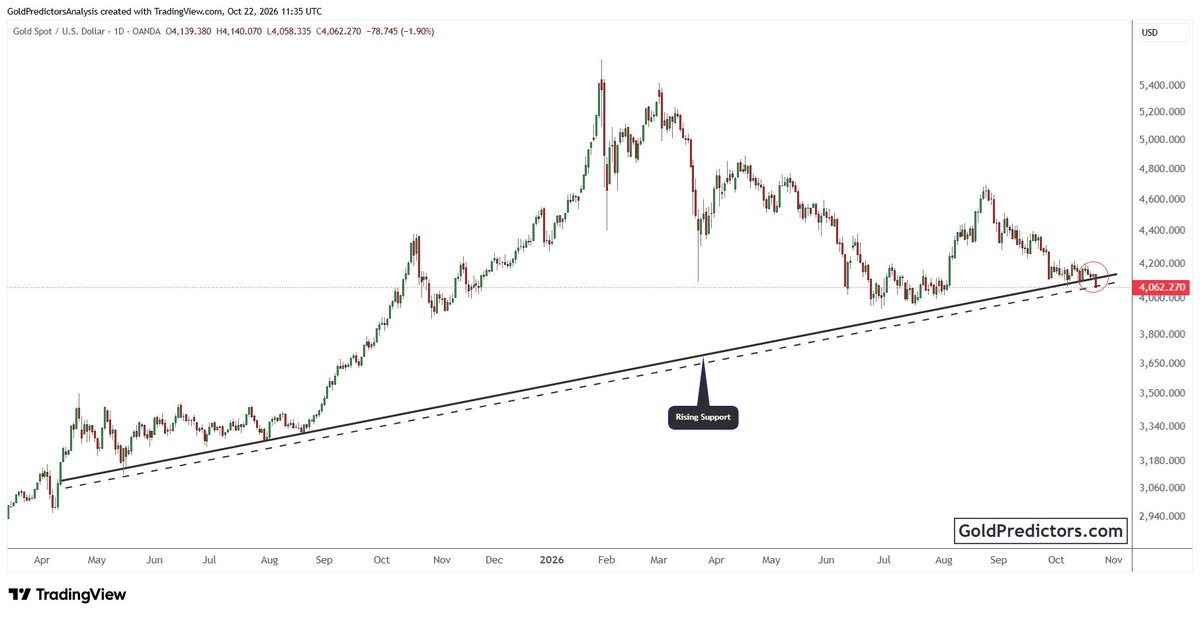
UBS says $4,000 is where dip buyers step in for gold.
“Still, we think gold has proved notably resilient to the sharp rise in yields,” strategist Giovanni Staunovo said in a note on Friday.
“In the near term, gold may retest support around USD 4,000/oz, where we expect structural dip buyers to establish a floor.”
UBS kept its forecast of 750 to 1,000 metric tons of annual central bank buying and sees gold resuming its uptrend toward year-end and into 2027.
Source: https://t.co/87lw4cSBQ6
Japanese investors are DUMPING foreign bonds at the fastest pace in years:
Japanese investors sold -¥3.43 trillion, or -$21.9 billion, in foreign long-term bonds over the last 5 weeks, their longest selling streak in 4 years.
So far in 2026, they dumped -¥5.18 trillion, or -33.0 billion, the biggest sale for this period of the year since 2022.
This comes as Japan's 10-year government bond yield has risen by more than +80 basis points this year, making domestic bonds increasingly attractive and encouraging investors to redirect capital toward the home market.
Meanwhile, foreign investors bought +¥1.45 trillion in Japanese long-term bonds this week, marking their 3rd consecutive week of purchases.
Rising bond yields in Japan are making foreign bonds and equities less attractive to Japanese investors.
Sharp shadows on the quarterly candle for Q3 suggest a negative trend in Q4 for #Gold.
However, December is expected to be a positive month seasonally.
Therefore, gold might be attempting to form a final bottom of the year before the next rally.
This correction from $5,600 strengthen the bullish outlook and offers good opportunities for long-term investors.
The last rebound from the $3,950–$4,050 support zone lifted prices 17.1% over the summer.
Now gold is back, with its daily RSI at 33 approaching oversold territory.
But prices remain below the 100-day moving average
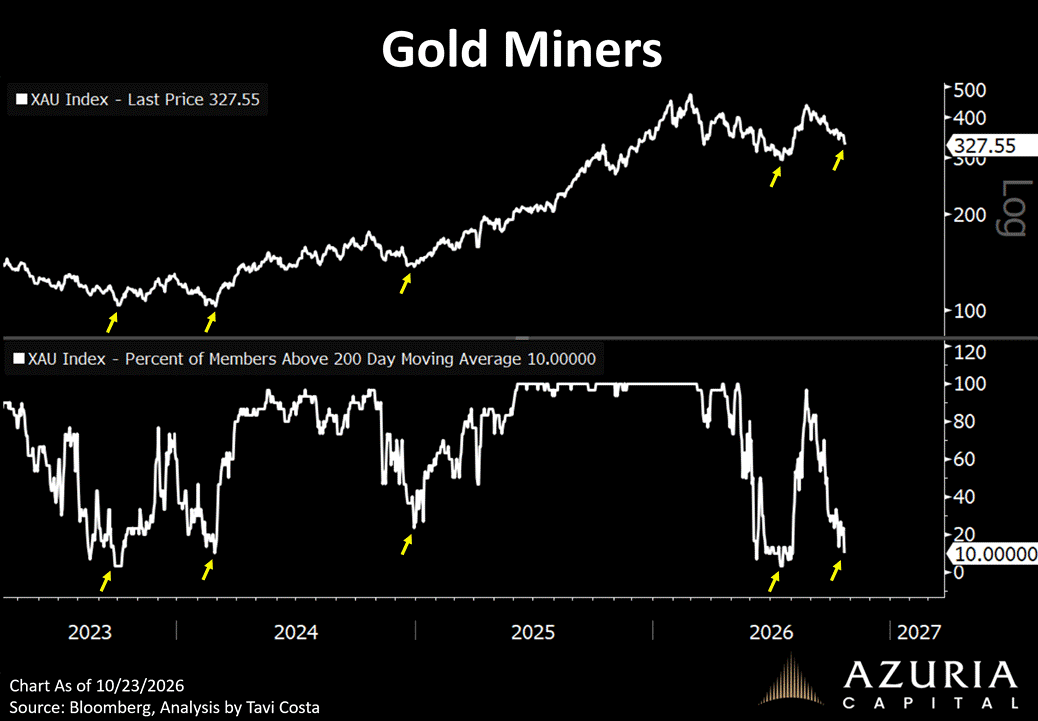
Only 10% of miners remain above their 200-day moving averages.
Historically, readings this low have coincided with important bottoms for the industry.
Long-term-minded investors know what to do here.
https://t.co/PXKGwBqrto
AI spending binge is pushing US tech credit risk to RECORD HIGHS:
5-year credit default swaps (CDS) tied to Meta, $META, surged to a record 119.3 basis points on Thursday.
At the same time, CDS spreads on Oracle, $ORCL, Microsoft, $MSFT, and Broadcom, $AVGO, also widened to record highs.
This comes as Meta raised its 2026 capital expenditure outlook by $5 billion at midpoint, to a range of $135 billion to $145 billion and increased its future spending commitments to $825 billion, up from nearly $700 billion in July.
Furthermore, Meta’s free cash flow turned negative in Q3 for the first time in 13 years, reaching -$2.12 billion.
As a result, the extra yield investors demand to hold Meta’s 2036 bonds instead of comparable US Treasuries widened to a record 121 basis points.
Investors are increasingly questioning how Big Tech will finance the AI infrastructure buildout, as massive capital spending plans raise expectations for further debt issuance in an already saturated credit market.
The AI arms race is fueling a surge in demand for protection against corporate tech defaults.
Canaccord Genuity says ex-China NdPr prices are up 23% this year while the rare earth producers it covers are down 28% on average.
NdPr is above the $110 a kilogram price floor.
Developers are down 17% on average this year, and producers trade at 0.57 times net asset value.
Canaccord says equity performance has been driven more by global macro factors than by rare earth fundamentals.
#Silver’s correction continues, with $48–$50 in focus as a key support zone along the rising trendline. Holding this area would help keep the upward structure intact.
Electric vehicles are forecast to account for 76% of global lithium demand by 2050, up from 55% today, according to Benchmark Mineral Intelligence.
Total lithium demand is expected to more than triple to nearly 7 million metric tons of lithium carbonate equivalent, from 2.11 million metric tons in 2026.
Batteries already account for 92% of lithium consumption, up from about 70% in 2020.
Demand from stationary energy storage has grown by more than 60% a year over the past two years.
Benchmark expects growth to moderate to roughly 5% a year through the end of the decade.
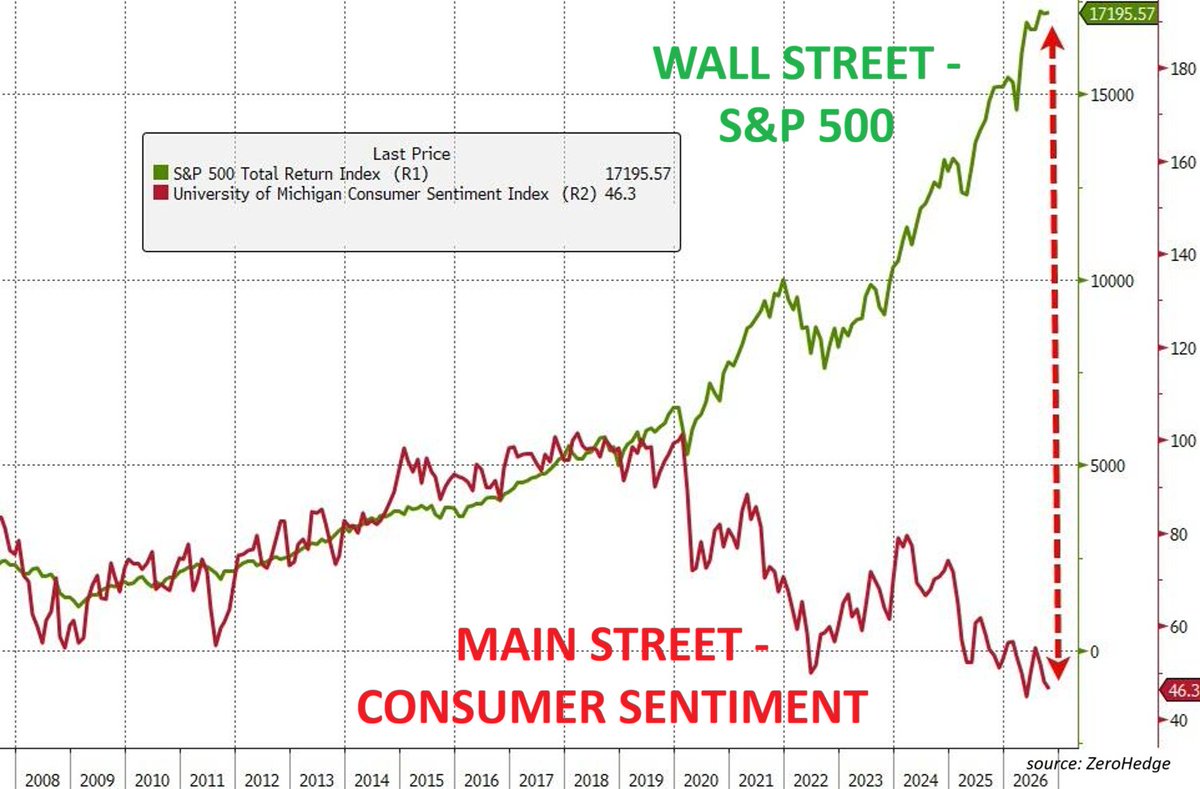
THE GAP BETWEEN WALL STREET AND MAIN STREET HAS NEVER BEEN WIDER:
The S&P 500 total return index is up 276% since the 2020 Crisis, trading near its all-time high.
Over the same period, the University of Michigan Consumer Sentiment index has fallen over -50%, to 48 points, its 2nd-lowest level in history.
This comes as higher income households own a disproportionate share of equities, so rising markets benefit them far more.
At the same time, the cost of living for middle and lower income households continues to rise, with housing, food, insurance, and other essentials more expensive than ever.
Wall Street is getting richer, while Main Street is getting more pessimistic by the day.
This is not healthy.
#Silver is back at the line that capped major rallies for decades. Holding this former resistance as support would strengthen the case that the breakout remains intact.
US copper stocks provide more than 170 days of cover, versus just 48 days elsewhere, according to Wood Mackenzie.
US stockpiling and trade policies are distorting global inventories, leaving markets outside the US facing a refined copper deficit of about 450,000 metric tons.
Meanwhile, Chilean mine output is forecast to fall 5.2% in 2026, before global mine supply grows more than 5% in 2027, ending three years of stagnant growth.
Over the next decade, miners will need to bring about 850,000 metric tons of new greenfield copper production online each year, Wood Mackenzie estimates.
Source: Wood Mackenzie
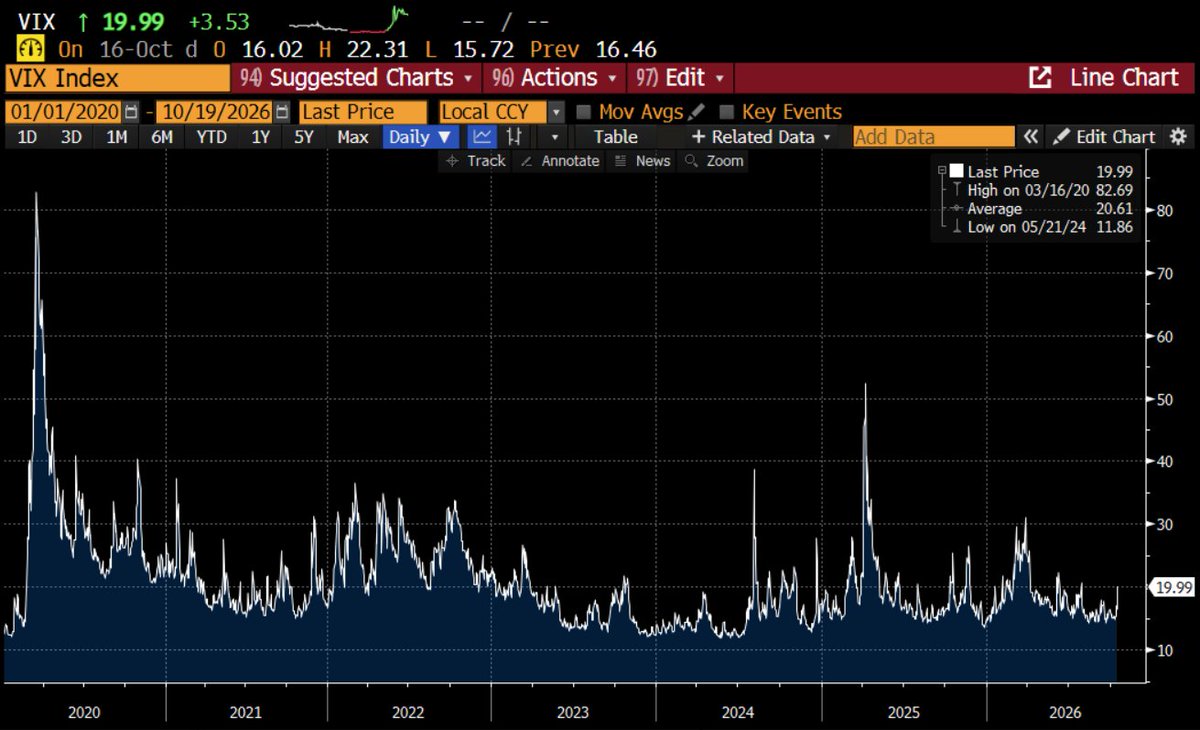
The VIX, which measures option implied volatility for the S&P 500 in the month ahead, spiked on Friday, as fears over write-downs of all the AI debt built. But the spike in the VIX is tiny in the scheme of things, so this is truly a "storm in a teacup..."
https://t.co/3blAAAKU59
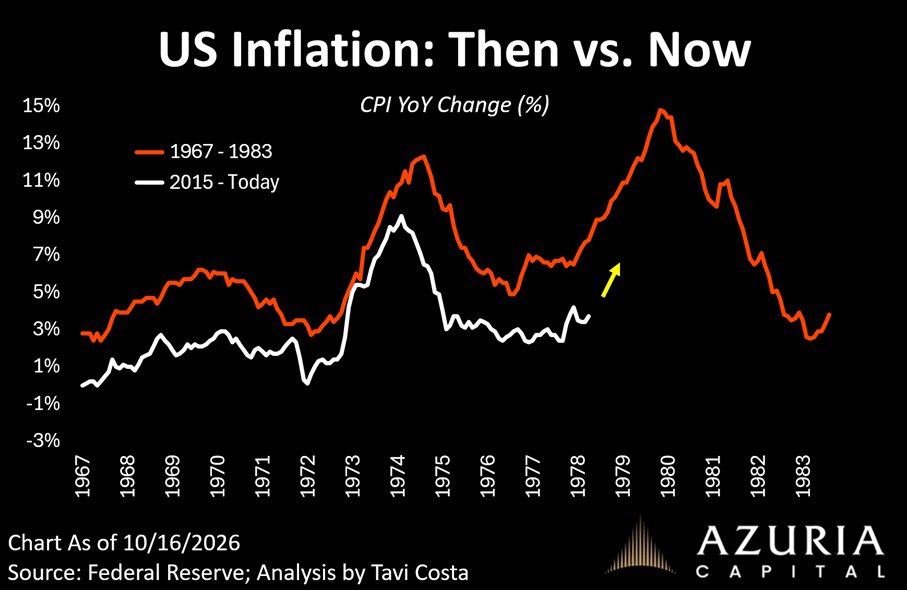
Last week’s inflation data reinforce the same message.
We are likely in for a decade of sticky inflation.
Yet central banks will inevitably have to cut rates to keep governments’ borrowing costs manageable.
That combination could have profound implications for hard assets.
https://t.co/JK6W0eiVUb
Interest expense on US federal debt is OUT OF CONTROL:
US net interest costs on public debt hit a record $1.05 trillion in FY2026, up +8% from $970 billion in FY2025.
Net interest costs are projected to reach 3.2% of GDP in FY2026, surpassing the previous record set in 1991.
This reflects both rising debt and higher borrowing costs, with US debt held by the public exceeding $32 trillion, up roughly $10 trillion in just 5 years, while total debt topping $40 TRILLION.
Over the same period, the average interest rate on marketable Treasuries skyrocketed to 3.52% from 1.47%.
Meanwhile, current Treasury yields are around 5%, adding further pressure as the government refinances and issues more debt.
In effect, the surging interest burden is eroding the government's fiscal flexibility, increasing the risk of a deeper crisis if lenders eventually become unwilling to finance US debt.
What is happening here?
#Silver has fallen below its rising trendline, bringing $55 support into focus. Holding this area could help prices stabilise, while the broken trendline may now act as resistance.
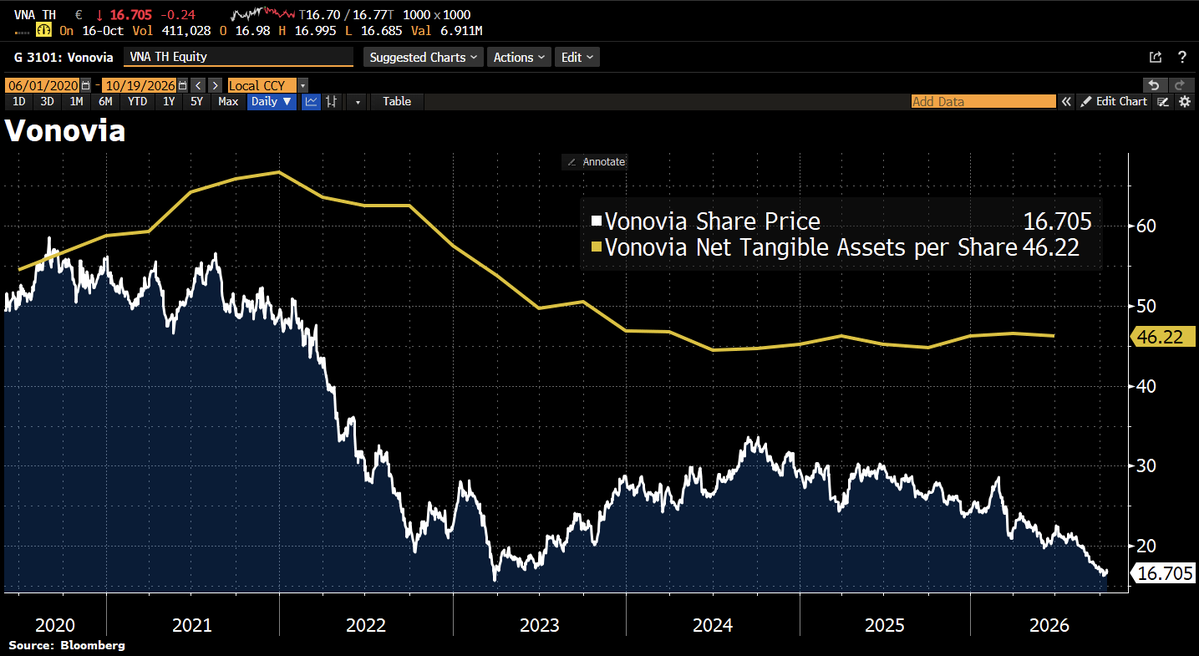
Good Morning from Germany, where the Left, Greens & SPD have successfully concluded exploratory talks and will move to coalition negotiations in Berlin, pending party approval. Their housing deal: expropriate large landlords’ holdings above 10,000 homes, exempt homes built since 2021, and cap total compensation at €16bn. If that ceiling cannot be met, no expropriation. They also pledge 100,000 new homes. The stakes for Vonovia: ~138,000 Berlin apartments valued at €27.5bn, or 27% of its property portfolio. These are assets exposed, not projected losses. But compensation below market value could destroy shareholder value and tighter rent regulation could squeeze cash flows even if expropriation never happens.
The Buffett Indicator has risen to RECORD levels:
The US stock market cap-to-GDP ratio surged to 238.6%, an all-time high.
This ratio has surged by +68 percentage points since April 2020.
TAP IMAGE TO SEE FULL INSIGHT👇
https://t.co/oQN9Ybt0vf
#Silver’s multi-decade cup-and-handle breakout remains intact after the sharp correction. Support near $55 is key as the dollar-to-silver ratio rises. Holding this area would support consolidation, while a sustained move above $60 would suggest stabilization.
https://t.co/V3Cd61LTCh