You can only keep one input for reading the crypto market. Which one stays?
→ Price structure
→ Funding and positioning
→ ETF flows
→ On-chain cost basis
→ Sentiment
My pick: price structure.
The other four help explain why price might move. Only price shows that it actually did.
Curious which one you'd keep, and why.
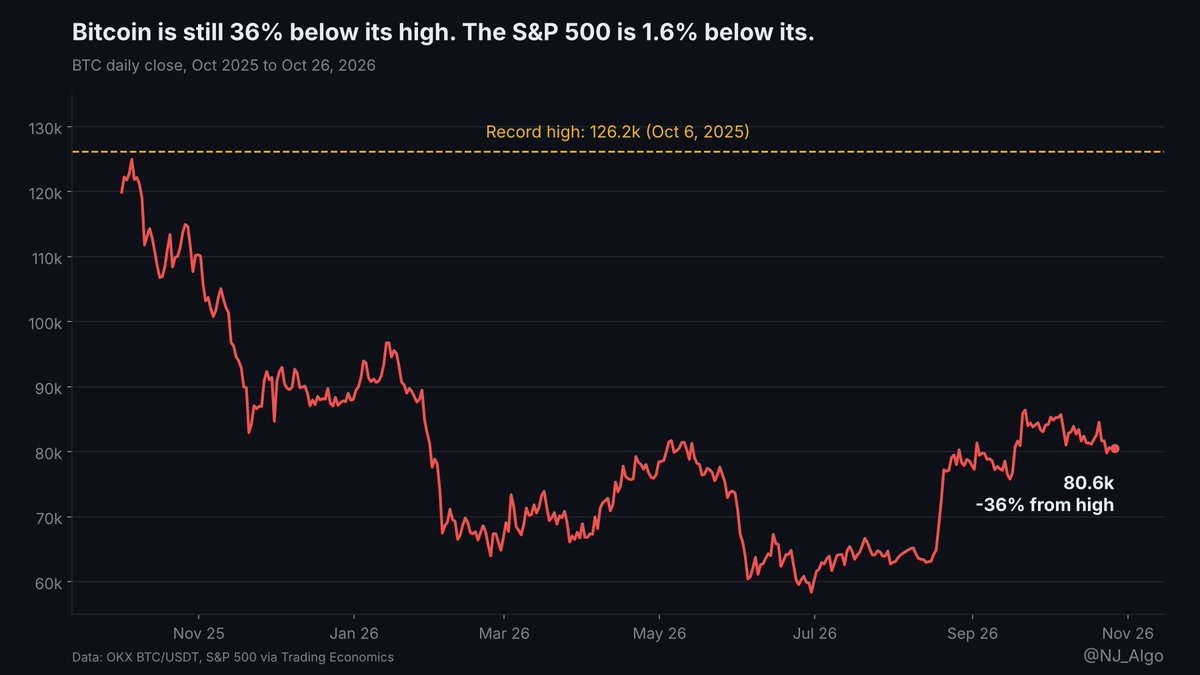
Stocks are 1.6% from their all-time high. Bitcoin is 36% below its own.
→ S&P 500: about +12% vs a year ago
→ $BTC: about -30% vs a year ago (OKX BTC/USDT)
→ Fear & Greed: 48, dead neutral
Same Fed. Same macro. Very different year.
So risk appetite clearly exists. It just isn't flowing into crypto.
Two ways to read that gap:
1. Bitcoin is lagging and catches up while risk-on holds. Possible, but it would need steady ETF inflows, not one big day followed by a big outflow day.
2. The gap is the information. Crypto is pricing a slower cycle that stocks haven't felt yet.
The Fed decides tomorrow. If stocks shrug and BTC still can't hold above 80k, I'd lean towards the second reading.
Which one are you leaning towards?
Funding at 0.01% looks like nothing.
It's about 11% a year.
Perpetual futures never expire, so exchanges use funding to keep their price tied to spot.
→ Longs crowded, perp rich: funding turns positive, longs pay shorts
→ Shorts crowded, perp cheap: funding turns negative, shorts pay longs
→ On OKX and many other venues it's settled every 8 hours
0.01% × 3 payments × 365 days ≈ 11% of the position per year.
And it's charged on position size, not on your margin. At 5x leverage that's roughly 55% of your margin a year, just to keep the trade open.
What funding shows: how crowded one side is, and how much it pays to stay there.
What it doesn't show: direction. A crowd can pay positive funding for weeks while price keeps grinding higher.
Treat it as a cost and a positioning gauge, not as a signal on its own.
Do you check funding before opening a perp trade, or only after it starts hurting? 🙃
$BTC is down about 2% this week. The long crowd on OKX keeps growing anyway.
→ Long/short account ratio: 2.36, highest since June 30
→ A week ago: 1.63
→ Price: 81.9k on Oct 19, 79.7k now
→ Fear & Greed: 48, down from 68 five days ago
Price slips, sentiment cools, and more accounts lean long. That's either dip buying with conviction or a crowded side. What happens next decides which.
And the Fed decides tomorrow.
If the decision lands badly, that's a lot of longs to unwind. If 79k holds through it, the crowd gets paid and shorts are the thin side.
Possible flush? Yes. Probable? I'm not sure. The ratio counts accounts, not position size, and OKX isn't the whole market.
What are you watching into Wednesday?
SMA, RMA or LSMA? Most traders pick one moving average and hope it's the right one.
There's another option: use all three and let their disagreement tell you something.
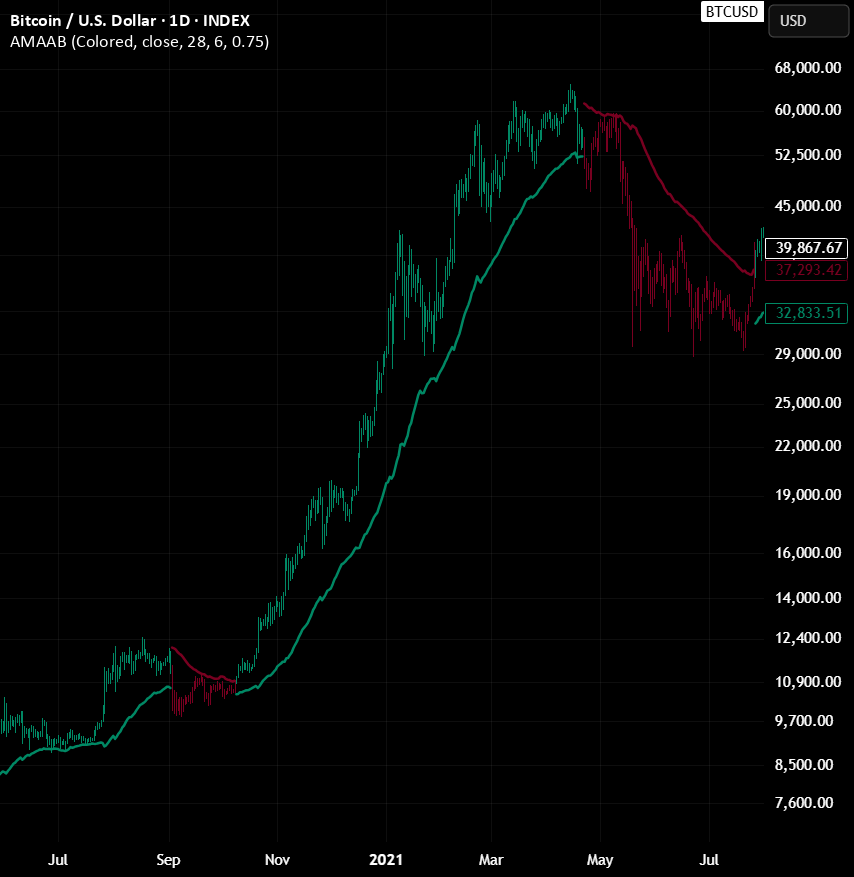
Adaptive Moving Average ATR Bands puts ATR bands around an SMA, an RMA and an LSMA, all with the same source and length.
→ The highest upper band and the lowest lower band form one envelope
→ When the averages spread apart, the envelope widens
→ When they converge, it narrows
A close above the upper band turns the bullish condition on. A close below the lower band turns the bearish one on. Each holds until the opposite happens.
So a breakout has to clear the most conservative band, not just the easiest one.
Best used as trend context and volatility-adjusted support/resistance next to other analysis, not as a standalone entry signal.
Free & open-source on TradingView:
https://t.co/GVEGneoJ0r
The options market gives $BTC about the same odds of 100k by Christmas as of losing 70k.
→ Above 100k: 12%, up from 9.7% a week ago
→ Below 70k: 11%, down from 15.6%
(Derive, an on-chain options venue)
From ~80.4k, 100k is a 24% move up. 70k is 13% down.
Similar odds for a move almost twice as far. That's a year-end lean to the upside.
The front end says something else. On Deribit, near-dated puts still cost more than calls. Traders are paying for protection first.
One wallet also bought 800 BTC worth of 90k calls expiring Nov 6, about $68M in face value. The largest open BTC position on Derive.
Cautious for the next two weeks. Hopeful for the next two months.
Both can be true at the same time.
One Pine Script keyword can make your live indicator do things your backtest never saw.
It's varip.
Pine has three ways to declare a variable:
→ x = 0 resets on every bar
→ var x = 0 initializes once and keeps its value from bar to bar
→ varip x = 0 does the same, and also keeps changes made between ticks on the live bar
Why that matters: an indicator runs once per historical bar. On the live bar it runs on every update, and Pine rolls ordinary and var variables back before each recalculation.
varip escapes that rollback.
So a varip counter adds 1 per bar in history but 1 per update in real time. Same code, two different results. And after a reload, those intrabar values are gone.
Useful for tick counters and intrabar alerts. A trap inside any signal logic you plan to backtest, because history can't replay what happened between ticks.
Rule of thumb: var for state, varip only for things you never need to backtest.
Three days. Three events. And $BTC is parked right on 80k.
→ Wed: Fed decision. CME FedWatch had hike odds near 9%
→ Thu: September PCE inflation
→ Fri: $11B+ in BTC options expire
The mood already cooled. Fear & Greed fell from 68 to 50 in four days.
Positioning didn't. OKX still shows 2.16 long accounts for every short.
If 80k holds through Wednesday, that crowd gets paid for waiting. If it breaks, they're the fuel.
Which of the three moves crypto most this week?
Every indicator lags. The only question is how much, and what you get in return.
A 20-day simple moving average sits about 9.5 days behind price. That's not a flaw, it's the math: (20 - 1) / 2.
Cut the lag and you buy noise. Smooth the noise and you buy lag.
→ Shorter length: earlier signals, more whipsaws
→ EMA or DEMA: less lag, more overshoot on spikes
→ Adaptive averages: fast in trends, slow in chop, but still late to the first move
So "which indicator doesn't lag?" is the wrong question.
The better one: how much lag can your system afford for the trades it's built to catch?
A trend system holding for weeks can live with a 10-day delay. One chasing 2-day swings can't.
Fed week. And the market has already decided what happens on Wednesday.
Prediction markets put a hold at about 94%. Rates stay at 3.75–4%.
So the decision probably isn't the event. The tone is.
How I'd read the week, one number at a time:
→ $BTC near 80.6k, flat on the week. Friday dipped to 79.2k on OKX and got bought back.
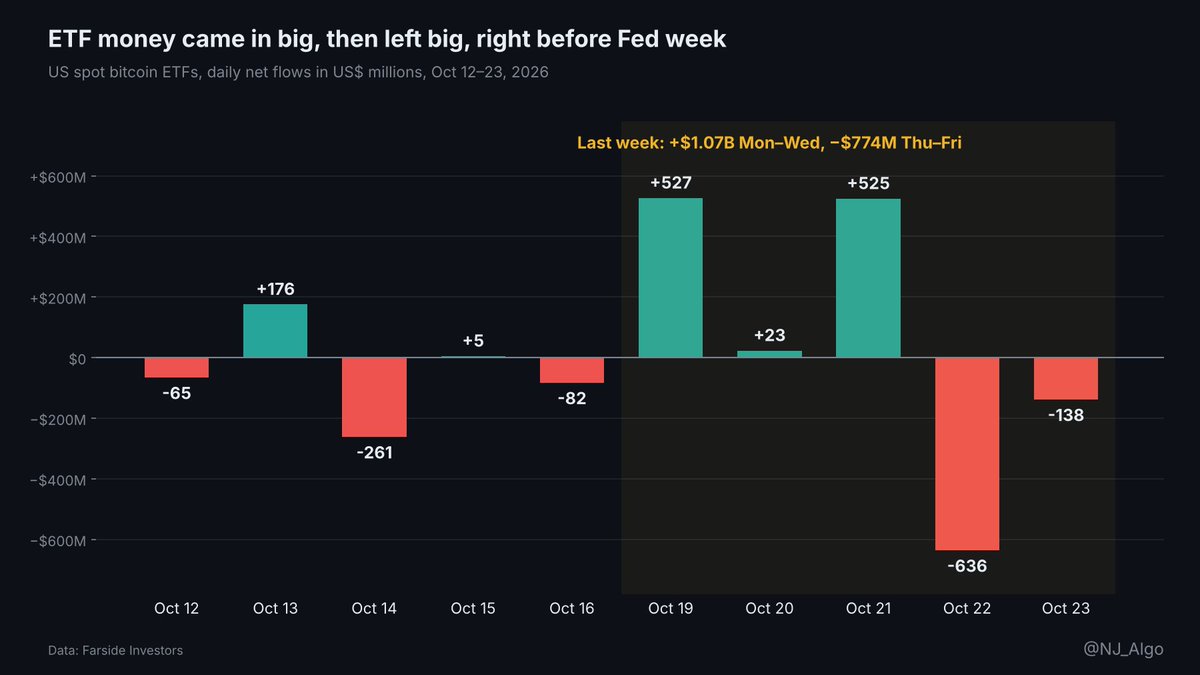
→ US spot ETFs: +$1.07B Mon–Wed, then -$774M Thu–Fri. Still +$301M for the week, but the last two days pointed out.
→ OKX funding: at or below 0.01% per 8h all week. Nobody is paying up for longs.
→ OKX long/short accounts: 2.09. Two longs per short, close to the month's high.
→ Fear & Greed: 54. Neutral.
→ Brent settled Friday at $116.72, highest since late April. That's the inflation pressure the Fed is looking at.
Put together: a long-leaning crowd, cheap leverage, and a macro backdrop that leans hawkish.
Two paths I'd prepare for:
1. Calm hold, nothing hawkish in the press conference → relief for that long crowd, and 80k has a better chance of holding as a floor.
2. Any hint that December is live, or oil keeps climbing → the pain sits on the long side. A sweep below Friday's 79.2k low becomes possible.
Neither is a prediction. They're the two scenarios the data makes worth thinking through.
Which number on this list would you weight most this week?
Why measure a breakout against a range price is still building?
A classic Donchian channel uses the most recent highs and lows. So every new swing drags the bands along with it.
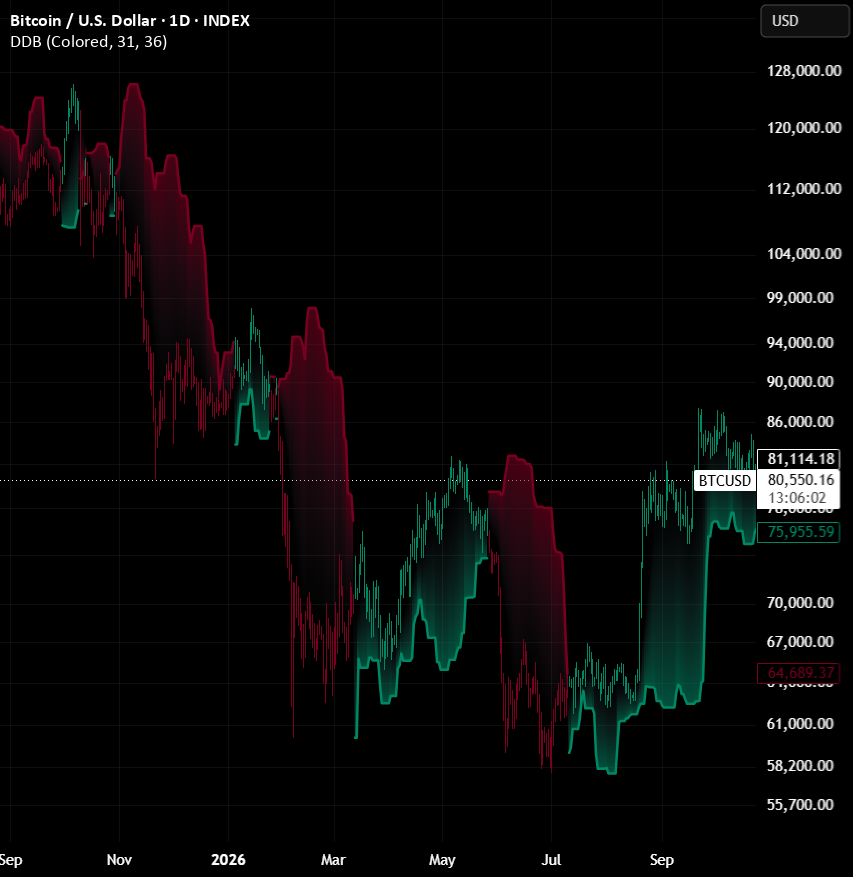
Displaced Donchian Breakout [NJ], just published, takes the range from an older window instead. It skips the latest candles entirely.
→ Upper band: highest high between a start and an end length back
→ Lower band: lowest low over that same window
→ High breaks above the upper band: bullish condition
→ Low breaks below the lower band: bearish condition
→ The condition holds until the opposite break
The bands widen after strong or volatile stretches and tighten in quiet ranges. The active band doubles as trailing support or resistance.
It's built as a trend filter to use alongside other analysis, not as a standalone entry signal.
Free & open-source on TradingView:
https://t.co/fXmNf2uupk
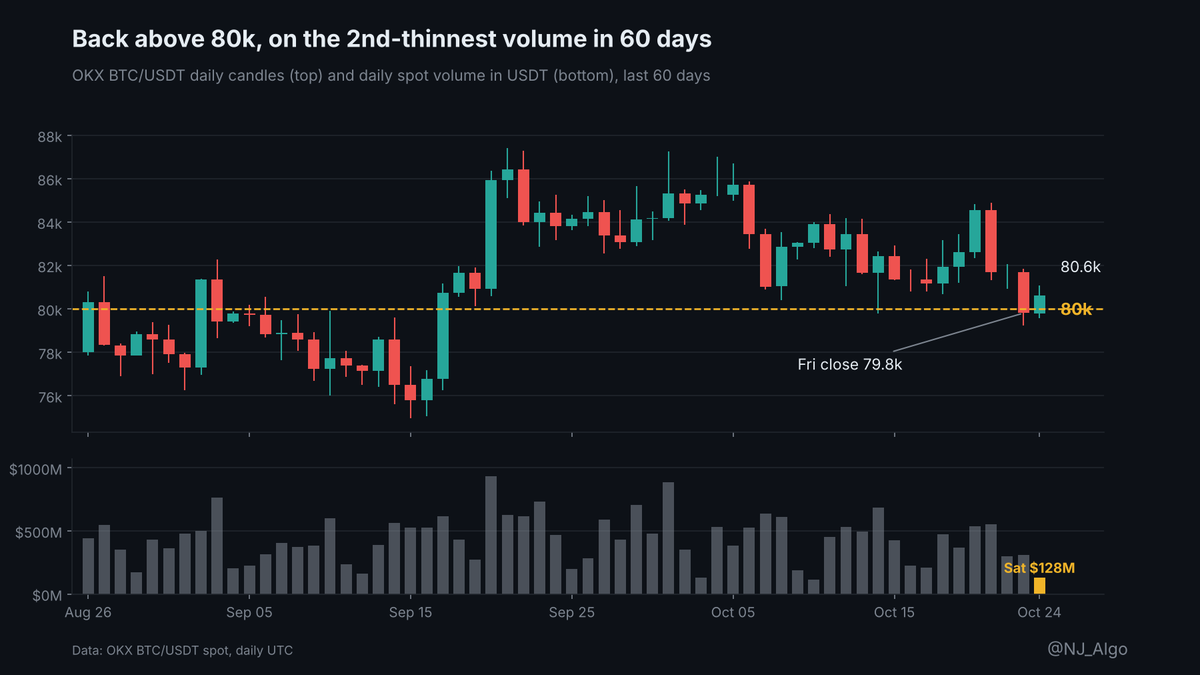
$BTC closed a day below 80k on Friday. First time since mid-September.
Saturday bought it back. On almost no volume.
→ OKX BTC/USDT: 79.8k Friday close, 80.6k Saturday close
→ Saturday spot volume on OKX: about $128M, the 2nd-thinnest day in 60 days
→ OKX funding: still positive, but close to flat
→ Fear & Greed: 54, neutral
A reclaim on thin weekend volume doesn't prove much. Nobody big had to show up for it.
The real test is the first busy day of the week, when US desks and ETF flows are back.
If 80k holds with volume behind it, Friday looks like a shakeout. If it slips again once size returns, Saturday was just a quiet weekend.
Which one are you leaning towards?
Do you let your system trade on weekends?
Crypto never closes. But US spot ETFs and most institutional desks do, so weekend order books are usually thinner.
Thin books cut both ways: sometimes cleaner trends, sometimes more fake breakouts.
My take: switching weekends off adds a rule your backtest probably never tested. If they worry you, size down instead of skipping them.
On or off for you?
Is price strong, or just higher than yesterday?
Those are two different questions.
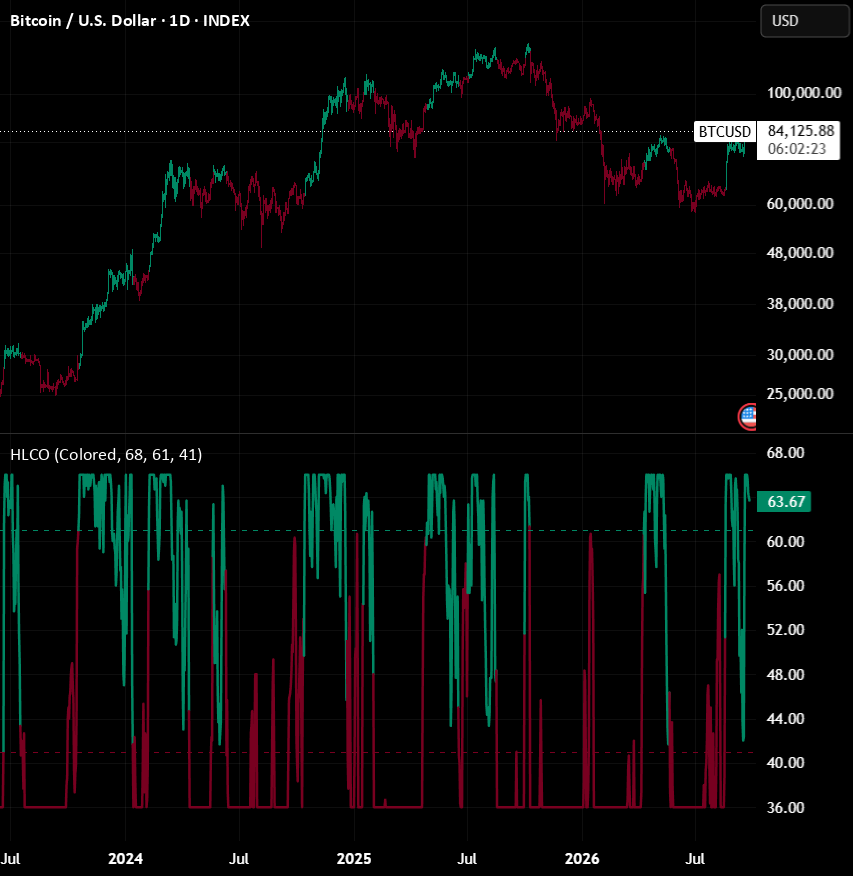
HLC Oscillator answers the first one. Over a lookback window, it counts how often the current high, low and close sit above their own past values.
→ Highs above more of their history: the top keeps getting pushed
→ Lows above more of their history: dips get bought at higher prices
→ Closes above more of their history: sessions finish strong
The three counts are averaged into one score. Above the long threshold = bullish strength. Below the short threshold = bearish. In between, the previous state holds, so it doesn't flip on every small wiggle.
Using all three is the point. A strong close while the lows keep sinking tells a very different story than a strong close with rising lows.
Best used as context next to other analysis, not as a standalone entry signal.
Free & open-source on TradingView:
https://t.co/PlcrXuE8cm
RSI, Stochastic and CCI all flashing oversold isn't three confirmations.
It's one opinion, asked three times.
All three are built from the same thing: recent price compared to its own past. When one says oversold, the others usually do too. Stacking them feels like more evidence, but it mostly adds confidence, not information.
Real confirmation comes from inputs that measure something different:
→ Price: trend or momentum
→ Volatility: is this move normal or extreme for this market?
→ Volume: is anyone actually participating?
→ Positioning: funding, open interest, who's crowded
One tool from each group tells you more than five tools from the same group.
Quick test for your own chart: if you removed one indicator, would any of your decisions change? If not, it was never adding anything.
Bitcoin is down 1% this week. 14 of the next 19 largest coins did worse.
→ $ETH -2.2%, SOL -2.5%
→ ADA -5.7%, NEAR -8.7%
→ Clearly up: only XMR (+4.0%) and BNB (+2.2%)
BTC drifting lower while alts lose up to 8x as much isn't rotation. It's the market cutting risk at the edges first.
To me, the start of an alt season looks the opposite: alts holding firm while BTC stalls.
What would you need to see before calling an alt season?
System A: +20% a year, 15% max drawdown.
System B: +45% a year, 50% max drawdown.
Which one would you actually stick with?
On paper B wins easily. In real life, B means watching half your account disappear and still taking the next signal.
A 50% drawdown needs +100% just to get back to even. A 15% drawdown needs about +18%.
Most traders overestimate how much pain they can sit through. And a system you abandon near the bottom returns nothing.
My take: A. The best system is the one you can still follow at its worst point.
A or B, and why?
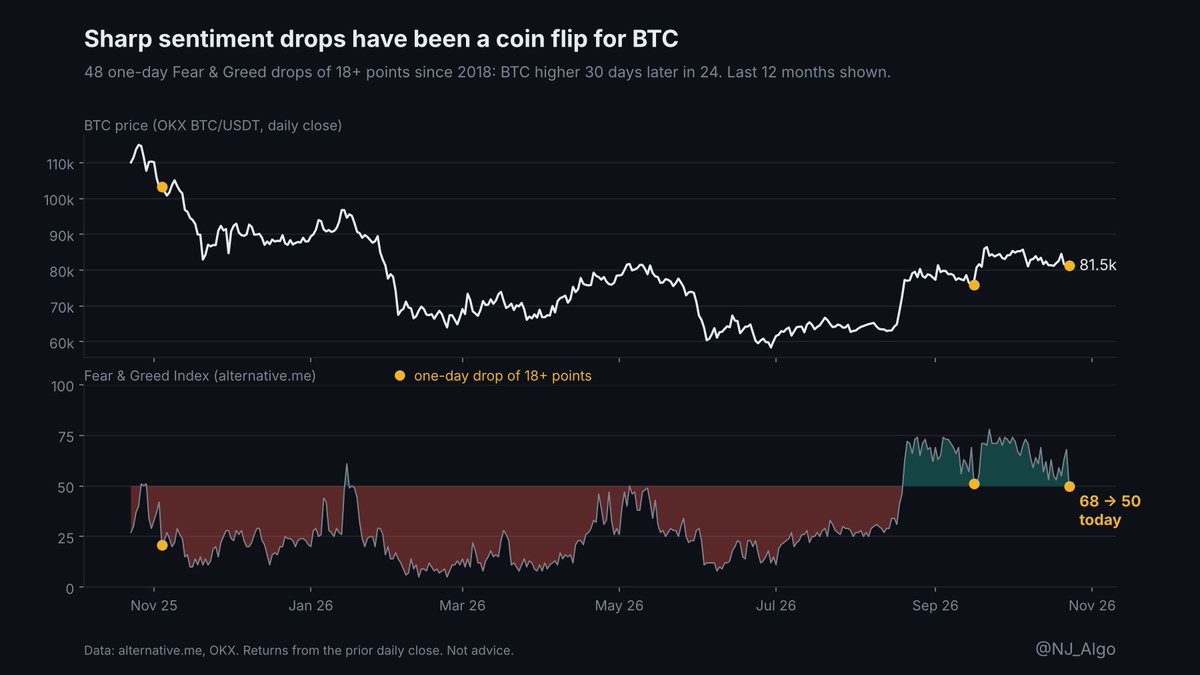
"Be greedy when others are fearful."
I tested it. Every one-day drop of 18+ points in the Fear & Greed Index since 2018. 48 cases.
→ $BTC higher 7 days later: 19 of 48
→ Higher 30 days later: 24 of 48
→ Median 30-day return: +0.4%
That's a coin flip.
Why now: the index fell from 68 to 50 overnight, while Bitcoin sat roughly flat near 81.5k.
A sudden mood swing on its own isn't an edge. It only starts to mean something when positioning, flows or structure agree with it.
Which data would you pair it with?
A strategy that only works on the data it was built on hasn't been tested yet.
That's the gap walk-forward testing closes.
How it works:
1. Optimize your settings on one chunk of history, say 2 years.
2. Run those exact settings on the next 6 months, untouched.
3. Slide the window forward and repeat.
4. Judge the system only on the stitched-together out-of-sample results.
Why it matters: one big backtest lets you pick the parameter set that happened to fit the past. Walk-forward makes every setting prove itself on data it has never seen.
What to look for:
→ Out-of-sample far worse than in-sample: the edge was mostly fitting.
→ Best parameters jumping around every window: fragile system.
→ Similar results across windows: something real might be there.
It won't make a bad idea good. It just tells you sooner.
Do you walk-forward your systems, or still trust one big backtest?
$635M left US spot $BTC ETFs yesterday. The day before, $525M came in.
That's why I don't read ETF flows one day at a time. The weekly sum says more:
→ Mon–Thu this week: +$439M net, even after yesterday
→ Last week: -$228M net
→ Yesterday was still the biggest daily outflow since at least Oct 5
Price barely reacted. BTC is down 0.6% in 24h, near 81.8k.
If the week still closes positive, yesterday looks like profit-taking after two strong days. Another big red print today and the picture changes.
Do you track ETF flows daily or weekly?