🚨 GEMINI LIVE JUST GOT A LOT MORE USEFUL.
Google is turning it from a voice chatbot into an assistant that can manage emails, understand your day, remember context and hand off multi-step work to agents.
Most people will still use it just to “ask questions.”
Here are 8 prompts to make it actually WORK for you. 🧵
🚨 Google Gemini is quietly becoming the smartest AI for creators.
Most people ask one question...
Power users build complete AI systems.
Here are 8 elite Gemini prompts that feel like hiring a team of experts. 👇
📊 Excel Basics #35 – Remove Duplicates
Duplicate records are common when working with data collected from multiple files, systems, or sources. Excel provides a quick way to identify and remove duplicate values without manually checking thousands of rows.
📌 What are Duplicates?
A duplicate occurs when the same record appears more than once.
Example:
Employee ID | Name | Department
101 | Rahul | IT
102 | Priya | HR
101 | Rahul | IT
103 | Amit | Finance
Here, the record for Employee ID 101 appears twice.
📌 1. Remove Duplicates
Select your dataset and go to: Data → Remove Duplicates
Excel will show a window where you can choose which columns should be checked. Click OK, and Excel removes duplicate rows based on the selected columns.
📌 2. Choosing Columns Matters
Suppose you have:
ID | Name | City
101 | Rahul | Pune
101 | Rahul | Mumbai
If you select all three columns, these are not considered duplicates because the City is different. But if you select only ID and Name, Excel considers them duplicates.
So always decide what makes a record "duplicate" before removing anything.
📌 3. Remove Duplicates from an Excel Table
If your data is already an Excel Table: Table Design → Remove Duplicates
You can select the columns you want Excel to use for identifying duplicates.
📌 4. Excel Keeps the First Record
When Excel removes duplicates, it generally keeps the first occurrence and removes subsequent matching records.
Example:
ID | Name
101 | Rahul
101 | Rahul
After removing duplicates:
ID | Name
101 | Rahul
📌 5. Remove Duplicates vs Find Duplicates
These are different tasks.
Remove Duplicates → Permanently removes duplicate records from the selected dataset.
Conditional Formatting → Duplicate Values → Highlights duplicates without deleting them.
💡 If you're unsure whether duplicates should be deleted, highlight them first and review the data.
📌 Real-World Example
Imagine you have 50,000 customer records collected from different sources. Some customers appear multiple times.
You can select: Customer ID → Remove Duplicates
Excel can quickly reduce the dataset to unique customer records.
📌 Common Mistakes
❌ Removing duplicates without checking which columns define uniqueness.
❌ Selecting only one column when the entire record should be compared.
❌ Not keeping a backup before deleting data.
❌ Assuming similar-looking records are always duplicates.
✅ Best Practices
• Always keep a backup of the original dataset.
• Decide which columns define a unique record.
• Review duplicates before deleting important data.
• Use Conditional Formatting first when you're unsure.
• For large datasets, use a unique ID whenever possible.
💡 Double Tap ❤️ For More
Roadmap to become a data analyst
1. Foundation Skills:
•Strengthen Mathematics: Focus on statistics relevant to data analysis.
•Excel Basics: Master fundamental Excel functions and formulas.
2. SQL Proficiency:
•Learn SQL Basics: Understand SELECT statements, JOINs, and filtering.
•Practice Database Queries: Work with databases to retrieve and manipulate data.
3. Excel Advanced Techniques:
•Data Cleaning in Excel: Learn to handle missing data and outliers.
•PivotTables and PivotCharts: Master these powerful tools for data summarization.
4. Data Visualization with Excel:
•Create Visualizations: Learn to build charts and graphs in Excel.
•Dashboard Creation: Understand how to design effective dashboards.
5. Power BI Introduction:
•Install and Explore Power BI: Familiarize yourself with the interface.
•Import Data: Learn to import and transform data using Power BI.
6. Power BI Data Modeling:
•Relationships: Understand and establish relationships between tables.
•DAX (Data Analysis Expressions): Learn the basics of DAX for calculations.
7. Advanced Power BI Features:
•Advanced Visualizations: Explore complex visualizations in Power BI.
•Custom Measures and Columns: Utilize DAX for customized data calculations.
8. Integration of Excel, SQL, and Power BI:
•Importing Data from SQL to Power BI: Practice connecting and importing data.
•Excel and Power BI Integration: Learn how to use Excel data in Power BI.
9. Business Intelligence Best Practices:
•Data Storytelling: Develop skills in presenting insights effectively.
•Performance Optimization: Optimize reports and dashboards for efficiency.
10. Build a Portfolio:
•Showcase Excel Projects: Highlight your data analysis skills using Excel.
•Power BI Projects: Feature Power BI dashboards and reports in your portfolio.
11. Continuous Learning and Certification:
•Stay Updated: Keep track of new features in Excel, SQL, and Power BI.
•Consider Certifications: Obtain relevant certifications to validate your skills.
50 𝐨𝐟 𝐭𝐡𝐞 𝐦𝐨𝐬𝐭 𝐢𝐦𝐩𝐨𝐫𝐭𝐚𝐧𝐭 𝐄𝐱𝐜𝐞𝐥 𝐟𝐨𝐫𝐦𝐮𝐥𝐚𝐬 𝐭𝐡𝐚𝐭 𝐜𝐚𝐧 𝐡𝐞𝐥𝐩 𝐲𝐨𝐮 𝐩𝐞𝐫𝐟𝐨𝐫𝐦 𝐯𝐚𝐫𝐢𝐨𝐮𝐬 𝐭𝐚𝐬𝐤𝐬 𝐞𝐟𝐟𝐢𝐜𝐢𝐞𝐧𝐭𝐥𝐲.
S𝐔𝐌: Adds up numbers in a range.
𝐀𝐕𝐄𝐑𝐀𝐆𝐄: Calculates the average of numbers in a range.
𝐌𝐀𝐗: Returns the largest number in a range.
𝐌𝐈𝐍: Returns the smallest number in a range.
𝐂𝐎𝐔𝐍𝐓: Counts the number of cells that contain numbers in a range.
𝐂𝐎𝐔𝐍𝐓𝐀: Counts the number of non-empty cells in a range.
𝐈𝐅: Checks if a condition is met and returns one value if true and another value if false.
𝐕𝐋𝐎𝐎𝐊𝐔𝐏: Searches for a value in the first column of a table and returns a value in the same row from another column.
𝐇𝐋𝐎𝐎𝐊𝐔𝐏: Similar to VLOOKUP, but searches for a value in the first row of a table.
𝐈𝐍𝐃𝐄𝐗: Returns the value of a cell in a specific row and column of a range.
𝐌𝐀𝐓𝐂𝐇: Returns the relative position of an item in a range.
𝐂𝐎𝐍𝐂𝐀𝐓𝐄𝐍𝐀𝐓𝐄: Joins two or more text strings into one string.
𝐋𝐄𝐅𝐓: Returns the leftmost characters from a text string.
𝐑𝐈𝐆𝐇𝐓: Returns the rightmost characters from a text string.
𝐋𝐄𝐍: Returns the number of characters in a text string.
𝐓𝐑𝐈𝐌: Removes leading and trailing spaces from a text string.
𝐔𝐏𝐏𝐄𝐑: Converts text to uppercase.
𝐋𝐎𝐖𝐄𝐑: Converts text to lowercase.
𝐏𝐑𝐎𝐏𝐄𝐑: Capitalizes the first letter of each word in a text string.
𝐓𝐄𝐗𝐓: Formats a number or date value as text using a specified format.
𝐃𝐀𝐓𝐄: Returns the serial number of a particular date.
𝐓𝐎𝐃𝐀𝐘: Returns the current date.
𝐍𝐎𝐖: Returns the current date and time.
𝐃𝐀𝐓𝐄𝐃𝐈𝐅: Calculates the difference between two dates in years, months, or days.
𝐄𝐎𝐌𝐎𝐍𝐓𝐇: Returns the last day of the month, n months before or after a given date.
𝐑𝐎𝐔𝐍𝐃: Rounds a number to a specified number of digits.
𝐑𝐎𝐔𝐍𝐃𝐔𝐏: Rounds a number up, away from zero, to the nearest multiple of significance.
𝐑𝐎𝐔𝐍𝐃𝐃𝐎𝐖𝐍: Rounds a number down, toward zero, to the nearest multiple of significance.
𝐈𝐅𝐄𝐑𝐑𝐎𝐑: Returns a value you specify if a formula evaluates to an error, otherwise returns the result of the formula.
𝐒𝐔𝐌𝐈𝐅: Adds the cells specified by a given condition or criteria.
𝐒𝐔𝐌𝐈𝐅𝐒: Adds the cells in a range that meet multiple criteria.
𝐀𝐕𝐄𝐑𝐀𝐆𝐄𝐈𝐅: Calculates the average of cells specified by a given condition or criteria.
𝐀𝐕𝐄𝐑𝐀𝐆𝐄𝐈𝐅𝐒: Calculates the average of cells that meet multiple criteria.
𝐂𝐎𝐔𝐍𝐓𝐈𝐅: Counts the number of cells specified by a given condition or criteria.
COUNTIFS: Counts the number of cells that meet multiple criteria.
RAND: Returns a random number between 0 and 1.
RANDBETWEEN: Returns a random number between the numbers you specify.
PI: Returns the value of pi (3.14159265358979).
POWER: Raises a number to a power.
SQRT: Returns the square root of a number.
LOG: Returns the logarithm of a number to the base you specify.
EXP: Returns e raised to the power of a given number.
MOD: Returns the remainder of a division operation.
INT: Rounds a number down to the nearest integer.
ABS: Returns the absolute value of a number.
AND: Returns TRUE if all its arguments are TRUE, and FALSE otherwise.
OR: Returns TRUE if any argument is TRUE, and FALSE otherwise.
NOT: Returns the opposite of a logical value.
SUMPRODUCT: Multiplies corresponding components in the given arrays, and returns the sum of those products.
TRANSPOSE: Transposes rows and columns in a range of cells.
You can earn $7000 per month if you have ChatGPT, a laptop, and 60 mins daily.
Usually, I'd charge $79 for this guide, but today it's yours 100% free.
Like + reply 'Money' & I'll send you my ultimate guide for FREE.
Must follow me to get the guide in your DM.
FREE for 48 hrs
And if you don't live in Spain, an online service will soon be available for people who, like you, are out of my reach but whom I'd like to be able to help.
In the meantime, you have tips on the topic in my daily newsletter. And a free guide:
🧠 7 Resume Tips for Data Science & ML Roles 📄✅
1️⃣ Start with a Strong Summary
⦁ Highlight skills, tools, and domain experience
⦁ Mention years of experience and key achievements
2️⃣ Showcase Projects that Matter
⦁ Focus on real-world impact, not just toy datasets
⦁ Mention metrics (e.g., “Improved accuracy by 12%”)
3️⃣ Tailor for the Role
⦁ Align keywords with the job description
⦁ Use relevant tools and models mentioned in the listing
4️⃣ Highlight Tools & Techniques
⦁ Python, SQL, Pandas, Scikit-learn, TensorFlow
⦁ Also list Git, Docker, AWS if used
5️⃣ Add Business Context
⦁ Mention how your model helped reduce costs, improve conversion, etc.
⦁ Show you understand the why behind the model
6️⃣ Keep It One Page
⦁ Concise and clean layout
⦁ Use bullet points, not long paragraphs
7️⃣ Include Public Work
⦁ GitHub, blog posts, Kaggle profile
⦁ Show you build, write, and share
💬 Double tap ❤️ for more!
🚀 Data Science Roadmap 2026
📘 Phase 2: Mathematics for Data Science
📖 Topic 8: Covariance and Correlation
Welcome back! 👋
In the previous lesson, you learned about Range, Percentiles, Quartiles, IQR, and the Five-Number Summary.
Now let's learn two extremely important concepts for understanding relationships between variables:
• Covariance
• Correlation
These concepts are used extensively in Exploratory Data Analysis (EDA), feature selection, machine learning, and statistical analysis.
🔹 1. Why Do We Need Covariance and Correlation?
Suppose you're analyzing student data:
• Hours Studied | Exam Score
• 2 | 50
• 4 | 60
• 6 | 70
• 8 | 80
• 10 | 90
You can observe that as study hours increase, exam scores also increase.
But how can we mathematically measure this relationship?
That's where covariance and correlation come in.
🔹 2. What is Covariance?
Covariance measures the direction in which two variables change together.
It tells us whether two variables tend to increase or decrease together.
Three possibilities:
• Positive Covariance: When one variable increases, the other tends to increase. X ↑ → Y ↑. Example: Study hours ↑ → Exam score ↑
• Negative Covariance: When one variable increases, the other tends to decrease. X ↑ → Y ↓. Example: Product price ↑ → Demand ↓
• Covariance Near Zero: There is little or no linear relationship between the variables. X ↑ → No consistent change in Y
🔹 3. Covariance Formula
For population data:
• Cov(X,Y) = Sum of (Xi - Mean X) ** (Yi - Mean Y) / N
Where:
• Xi = Individual X value
• Yi = Individual Y value
• Mean X = Mean of X
• Mean Y = Mean of Y
• N = Number of observations
The calculation essentially asks: When X is above or below its average, is Y also above or below its average?
🔹 4. Simple Covariance Example
Consider:
• X = [1, 2, 3]
• Y = [2, 4, 6]
Means:
• Mean(X) = 2
• Mean(Y) = 4
Now calculate deviations:
• X | X - Mean X | Y | Y - Mean Y | Product
• 1 | -1 | 2 | -2 | 2
• 2 | 0 | 4 | 0 | 0
• 3 | 1 | 6 | 2 | 2
Sum of products: 2 + 0 + 2 = 4
Population covariance: Cov(X,Y) = 4 / 3 = 1.33
So covariance is positive. That makes sense because Y increases whenever X increases.
🔹 5. The Problem with Covariance
• Covariance tells us the direction of a relationship, but its magnitude depends on the units of the variables.
• For example: Height in centimeters, Weight in kilograms
• Changing centimeters to meters can change the numerical value of covariance.
• Therefore, covariance isn't always easy to interpret or compare.
• This leads us to correlation.
🔹 6. What is Correlation? ⭐
• Correlation measures both the direction and strength of a linear relationship between two variables.
• Unlike covariance, correlation is standardized.
• Its value always lies between: -1 <= r <= 1
🔹 7. Interpreting Correlation
• r = +1: Perfect positive linear relationship. X ↑ → Y ↑
• r = -1: Perfect negative linear relationship. X ↑ → Y ↓
• r = 0: No linear relationship.
• Important: r = 0 does not necessarily mean there is no relationship at all. A strong nonlinear relationship can still exist.
🔹 8. Correlation Strength
A rough interpretation:
• +0.9 → Very strong positive
• +0.5 → Moderate positive
• +0.1 → Weak positive
• 0 → No linear relationship
• -0.1 → Weak negative
• -0.5 → Moderate negative
• -0.9 → Very strong negative
The exact interpretation depends on the domain and context.
🔹 9. Pearson Correlation Coefficient ⭐
The most commonly used correlation measure is the Pearson correlation coefficient.
It is calculated as:
• r = Cov(X,Y) / (StdDev X ** StdDev Y)
Where:
• Cov(X,Y) = Covariance between X and Y
• StdDev X = Standard deviation of X
• StdDev Y = Standard deviation of Y
Because covariance is divided by the standard deviations, the result is standardized between -1 and +1.
🔹 10. Covariance vs Correlation
• Covariance: Measures direction of joint variation, Can have any numerical value, Depends on units, Harder to interpret, Useful mathematically
• Correlation: Measures direction and strength, Always between -1 and +1, Unitless, Easier to interpret, Very useful for EDA
🔹 11. Positive Correlation Example
Suppose: Advertising Spend ↑ → Sales ↑
If higher advertising spending generally corresponds to higher sales, the correlation may be positive.
• For example: r = 0.85 → This indicates a strong positive linear relationship.
🔹 12. Negative Correlation Example
Suppose: Price ↑ → Demand ↓
You might observe: r = -0.80 → This indicates a strong negative linear relationship.
🔹 13. Correlation Does NOT Mean Causation ⭐
This is one of the most important concepts in Data Science.
Suppose we observe: Ice Cream Sales ↑ ↔ Swimming Pool Accidents ↑
There may be a positive correlation. But eating ice cream doesn't necessarily cause swimming accidents.
A third variable — hot weather — could influence both:
• Hot Weather → Ice Cream Sales
• Hot Weather → Swimming Activity → Accidents
Therefore: Correlation does not prove causation.
🔹 14. Correlation and Machine Learning
Correlation is frequently used during Exploratory Data Analysis.
For example, suppose you're predicting house prices. You might examine correlations between:
• House size
• Number of bedrooms
• Location-related variables
• Age of property
• Price
A strong correlation between house size and price may indicate that house size could be a useful predictive feature.
However, correlation alone does not determine whether a feature should be included in a model.
🔹 15. Correlation Matrix ⭐
When a dataset contains many numerical variables, we can calculate correlations between every pair of variables. This produces a correlation matrix.
Example:
• Age | Income | Spending
• Age: 1.00, 0.65, -0.10
• Income: 0.65, 1.00, 0.72
• Spending: -0.10, 0.72, 1.00
The diagonal is always 1.00 because every variable has a perfect correlation with itself.
🔹 16. Detecting Multicollinearity
• Correlation can help identify multicollinearity.
• Multicollinearity occurs when two or more predictor variables are highly correlated with each other.
• For example: Annual Income ↔ Monthly Income — These variables contain very similar information.
• Including highly correlated predictors can create problems for some models, particularly linear regression, because it can make coefficient estimates unstable and harder to interpret.
🔹 17. Python Example
Using Pandas:
import pandas as pd
data = {
"Hours": [2, 4, 6, 8, 10],
"Score": [50, 60, 70, 80, 90]
}
df = pd.DataFrame(data)
print(df["Hours"].corr(df["Score"]))
Output: 1.0
This indicates a perfect positive linear relationship for this small example.
🔹 18. Common Mistakes
• Thinking correlation must be between 0 and 1 → Correlation can be negative: -1 <= r <= 1
• Thinking r = 0 means absolutely no relationship → It means there is no linear relationship detected by Pearson correlation. A nonlinear relationship may still exist.
• Assuming high correlation proves causation → Correlation only tells us that variables move together. It does not establish cause and effect.
🎯 Key Takeaways
• Covariance measures how two variables change together.
• Positive covariance indicates that variables tend to move in the same direction.
• Negative covariance indicates that they tend to move in opposite directions.
• Correlation measures the direction and strength of a linear relationship.
• Pearson correlation ranges from -1 to +1.
• Correlation is unitless and easier to interpret than covariance.
• A correlation of +1 indicates perfect positive linear association.
• A correlation of -1 indicates perfect negative linear association.
• A correlation of 0 indicates no linear association.
• Correlation does not imply causation.
👉 Double Tap ❤️ For More 📊
🚀 SpaceXAI launches Grok 4.6 with 500K-token context window, $2M/$6M API pricing
Elon Musk publicly backed Grok 4.6, tagging the AI agent's new account on August 25, 2026. The model, launched August 12, 2026, offers a 500K-token context window and competitive API pricing, with Grok 4.7 anticipated before September 2, 2026.
The Grok Bot, an early-beta AI agent, launched on August 11, 2026, and expanded to various Cursor plans by August 21, 2026.
• Grok 4.6, the latest model, launched on August 12, 2026, with a 500,000-token context window and API pricing at $2 per million input tokens and $6 per million output tokens.
Elon Musk's endorsement of Grok, coupled with the recent launch of Grok 4.6 and the upcoming Grok 4.7 update, highlights SpaceXAI's aggressive push in the AI space.
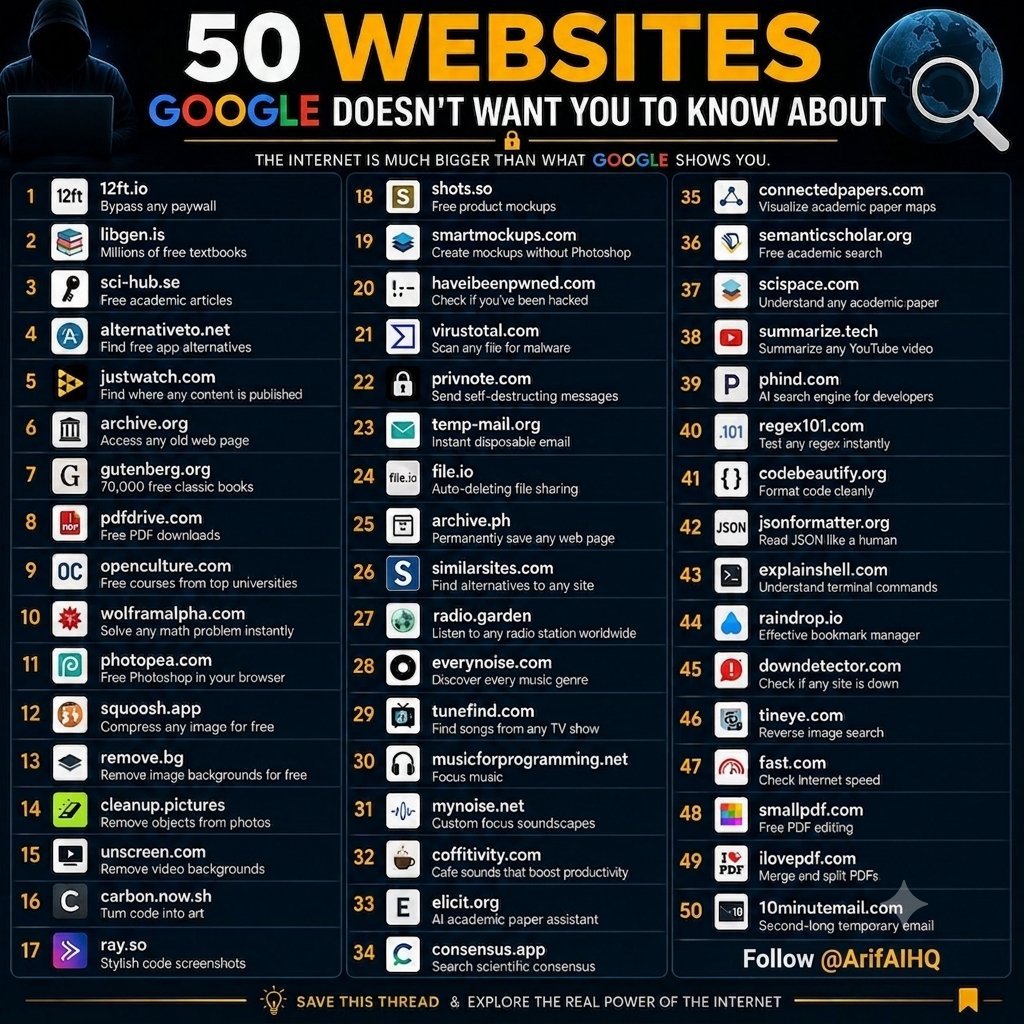
50 Web Sites Google Doesn't Want You to Know About
1.) 'https://t.co/ah8Jc0Qmf8' — Bypass any paywall
2.) 'https://t.co/UWfnjjMeOy' — Millions of free textbooks
3.) 'https://t.co/CZyuujtlcG' — Free academic articles
4.) 'https://t.co/rdpZFq3NYk' — Find free app alternatives
5.) 'https://t.co/ivNnyPAEmh' — Find where any content is published
6.) 'https://t.co/GqEd2SxLvM' — Access any old web page
7.) 'https://t.co/8ijFqv8DuN' — 70,000 free classic books
8.) 'https://t.co/tGsjIsUkmj' — Free PDF downloads
9.) 'https://t.co/y4axNFFkqQ' — Free courses from top universities
10.) 'https://t.co/NELUJUlR4i' — Solve any math problem instantly
11.) 'https://t.co/p7k3lTLYbb' — Free Photoshop in your browser
12.) 'https://t.co/ujGPcIbHjh' — Compress any image for free
13.) 'https://t.co/YxBWuPVeF7' — Remove image backgrounds for free
14.) 'https://t.co/RAju4gfC7q' — Remove objects from photos
15.) 'https://t.co/ePnB6umSCD' — Remove video backgrounds
16.) 'https://t.co/dD56GJlO5O' — Turn code into art
17.) 'https://t.co/qkPemZL3R3' — Stylish code screenshots
18.) 'https://t.co/kMYvDYVfcV' — Free product mockups
19.) 'https://t.co/Fb6gclUHbm' — Create mockups without Photoshop
20.) 'https://t.co/G81w61wWAZ' — Check if you've been hacked
21.) 'https://t.co/Xd5kyEMiLo' — Scan any file for malware
22.) 'https://t.co/ructqlXU5t' — Send self-destructing messages
23.) 'https://t.co/LYOv9JMPFL' — Instant disposable email
24.) 'https://t.co/Ra7VeLyaCe' — Auto-deleting file sharing
25.) 'https://t.co/qBVlZPpnWh' — Permanently save any web page
26.) 'https://t.co/7aXoCi0zlB' — Find alternatives to any site
27.) 'https://t.co/pCGMFYquiv' — Listen to any radio station worldwide
28.) 'https://t.co/C8OfBAjmp7' — Discover every music genre
29.) 'https://t.co/lxKj0WHeVX' — Find songs from any TV show
30.) 'https://t.co/RWspMNsqGo' — Focus music
31.) 'https://t.co/HFkCpO6QeW' — Custom focus soundscapes
32.) 'https://t.co/IpmViJnmub' — Cafe sounds that boost productivity
33.) 'https://t.co/xd53TwCJoq' — AI academic paper assistant
34.) 'https://t.co/LfVGmvLTWR' — Search scientific consensus
35.) 'https://t.co/cafR9V7IEk' — Visualize academic paper maps
36.) 'https://t.co/TitFBjXHXm' — Free academic search
37.) 'https://t.co/A8YyQM6Zej' — Understand any academic paper
38.) 'https://t.co/2SVDkMISW0' — Summarize any YouTube video
39.) 'https://t.co/KCHDPHoTHv' — AI search engine for developers
40.) 'https://t.co/RxOXfJ3vsc' — Test any regex instantly
41.) 'https://t.co/ZPQVtePKcO' — Format code cleanly
42.) 'https://t.co/uUzEfZAFm2' — Read JSON like a human
43.) 'https://t.co/ALokrMlX7R' — Understand terminal commands
44.) 'https://t.co/TWSMbbAqD9' — Effective bookmark manager
45.) 'https://t.co/Xho3IwnyLe' — Check if any site is down
46.) 'https://t.co/xKAVCdLQqg' — Reverse image search
47.) 'https://t.co/aZqeStDTDj' — Check internet speed
48.) 'https://t.co/mqfZ0hLKfj' — Free PDF editing
49.) 'https://t.co/pirZ4zkOLv' — Merge and split PDFs
50.) 'https://t.co/gb5jpD4Qv1' — Second-long temporary email
The internet is much bigger than what Google shows you.