$XAGUSD #Silver $PSLV +158% from its 10/28 low to today's high = 13weeks; at the high of today's session silver was +13.9%, HOWEVER a sharp reversal lower has formed one hell of a Gravestone Doji. wowzers!!!
$XBTUSD $XBT a bearish cross in bitcoin's monthly MACD (12,26,9) is imminent. The five prior occurrences (albeit small sample) took pace amidst cyclical declines in the range of 72% - 86%, or an avg decline of 80%, per bloomberg data.
@BillSimmons @KevinOConnorNBA @ryenarussillo@ChrisVernonShow haven't seen anyone mention the fact that Kyrie is a FA after this season. Is Dallas rly going to give him a max after his 14th NBA season, while AD starts his max after his 13th NBA season? LOL
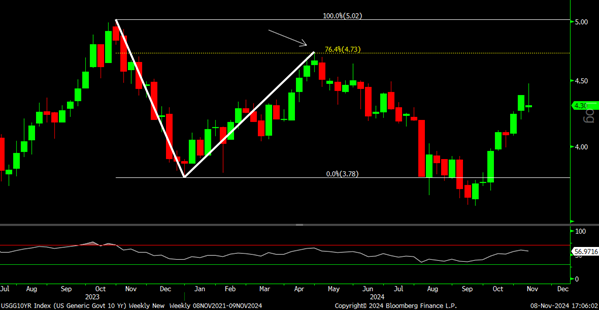
$TLT 10yr UST Yield: since the Oct '23 high, 5.02%, there have been two primary downtrends each followed by a 76.4% retracement. The 3rd decline interrupted by last weeks rebound and now stuck at the downtrend line. Of course there is an FOMC tmrw.
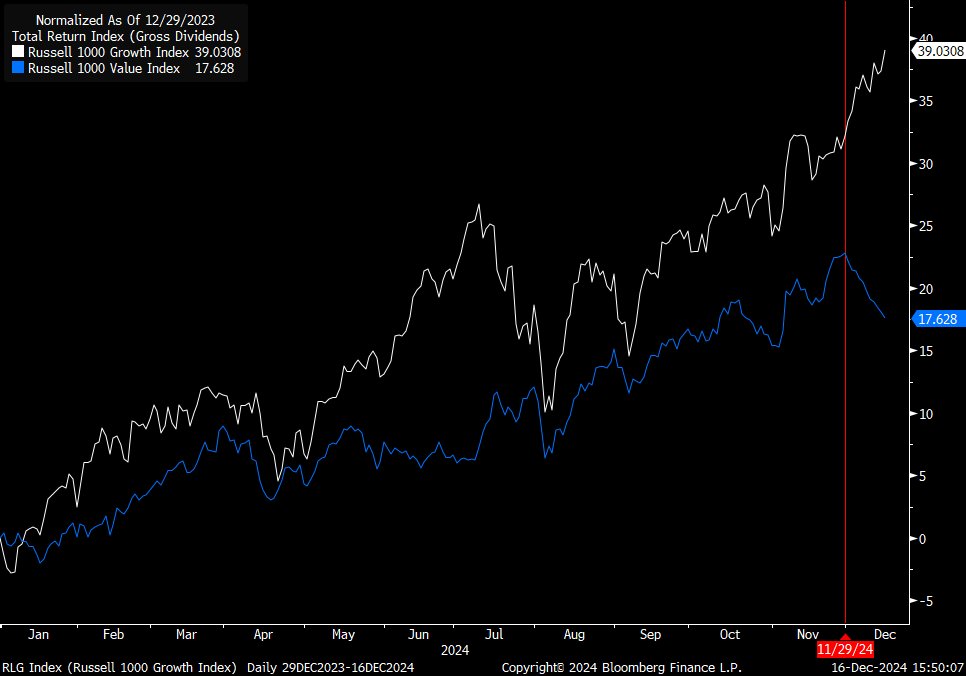
$RLG $RLV The Growth Value divergence is strong. Large cap Russell 1K (+5.3%) is outperforming R1K Value (-4.2%) by 9.4% in December. Only 3x times did Growth OP by a wider margin in any given month since 1978 (n=553): Dec 1999 (12.3%), Feb 2000 (12.2%), and June 2000 (9.9%).
Financials are top performing sector ytd (+38%) but NT are they due for rest? BD Index (chart 1) +54% YTD w/ highest weekly RSI (84) in over 27 years (Feb. 1997) & 2 of prior 3 weeks closed near low of weekly range. Last week KRX came within 0.5% of prior cycle high (chart 2)
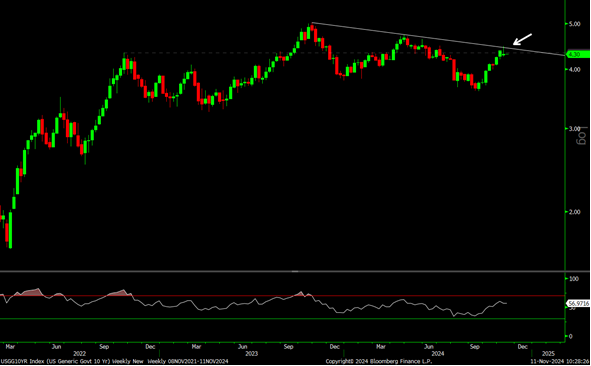
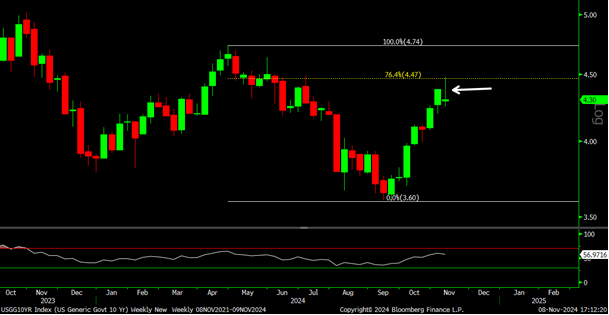
$TLT was last week a blow-off top in the 10yr UST yield? Last weeks price action formed classic reversal candlestick at two key locations: 1) resistance line connecting Oct 2023 and April 2024 highs, and 2) the 76.4% Fb retracement - same Fib it stalled at in April.
$TRAN Index - the DJ Transportation Index is not only having its best weekly gain (+6.6% WTD) in 12months, but more importantly its breaking out from a 3-year range.
$NVDA is ringing the Nasdaq Opening Bell as its stock is on pace to make a new weekly closing high, while emerging from a 16-week trading range. Using traditional technical analysis, the ~$37 range ($132 - $95) projects a min. measured move to $172 = $4.1T in mkt cap.
$USDJPY widespread articles on the recent yen strength reversing the carry trade and hitting risk assets. From a technical POV, the USDJPY appears to have simply retested the prior breakout. Potential for resumption of uptrend from here (i.e. yen weakness).
https://t.co/zFVYbtzRtI wanted to see relative strength from silver. Well silver is already +17.5% MTD which is its best monthly return in 11 years (excluding May and July 2020 when it was rebounding off crash lows). Look at this monthly chart and MACD.