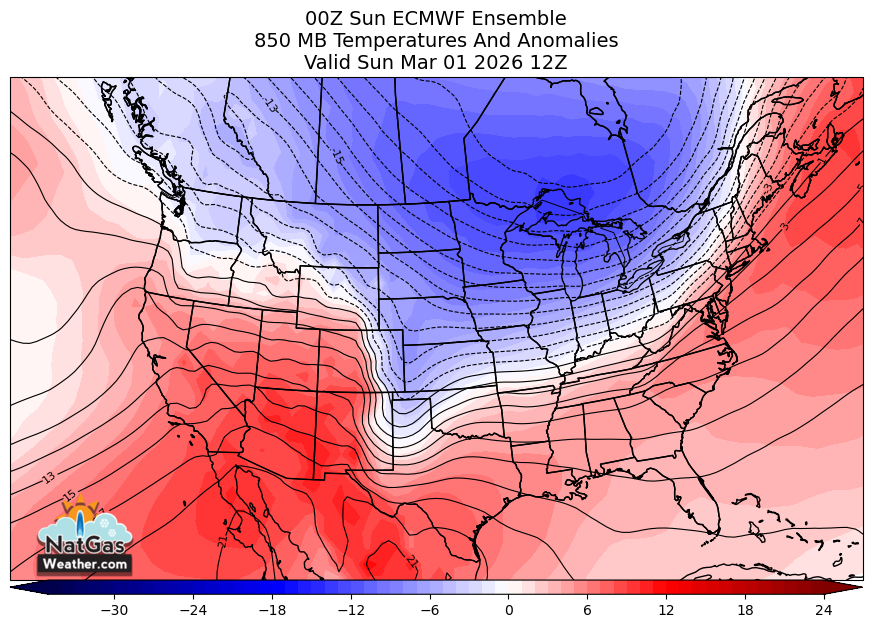
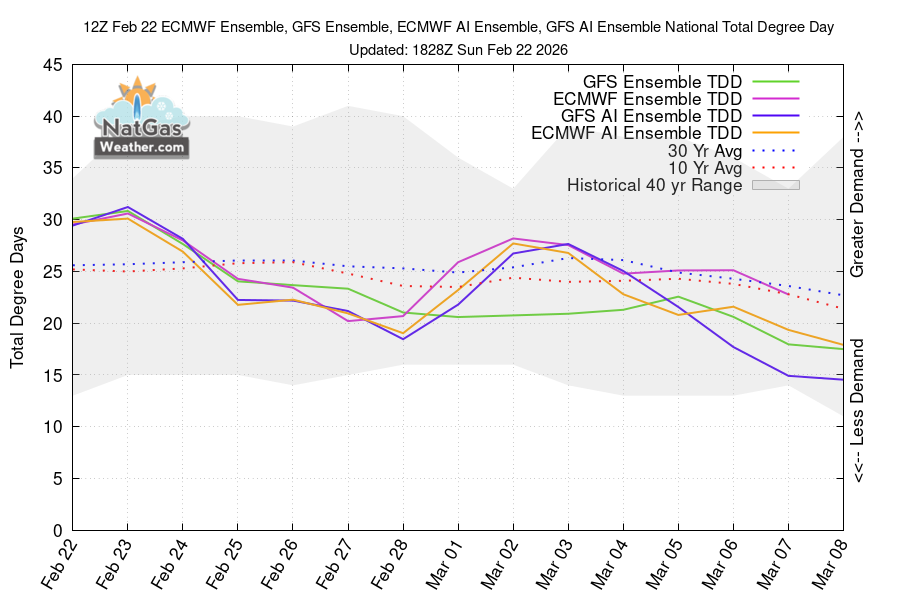
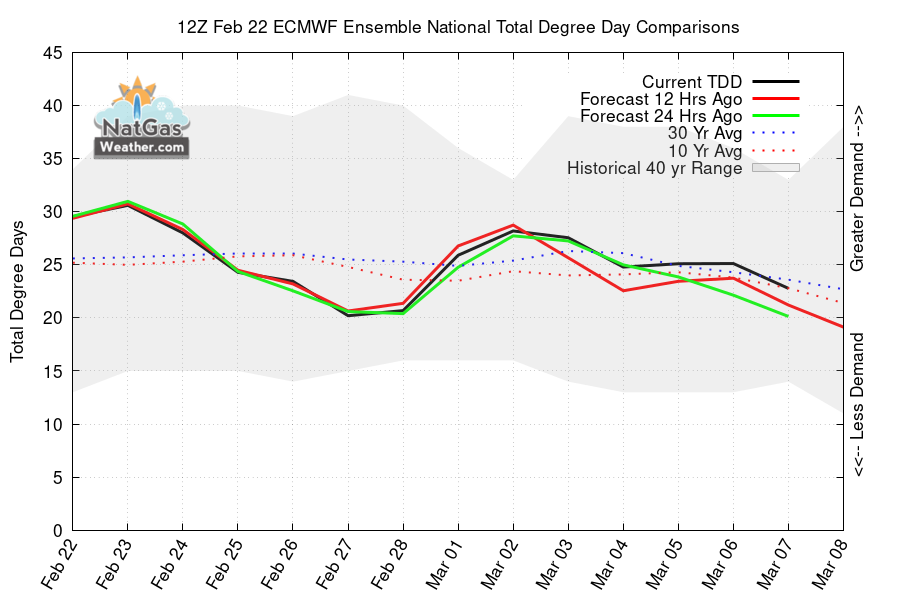
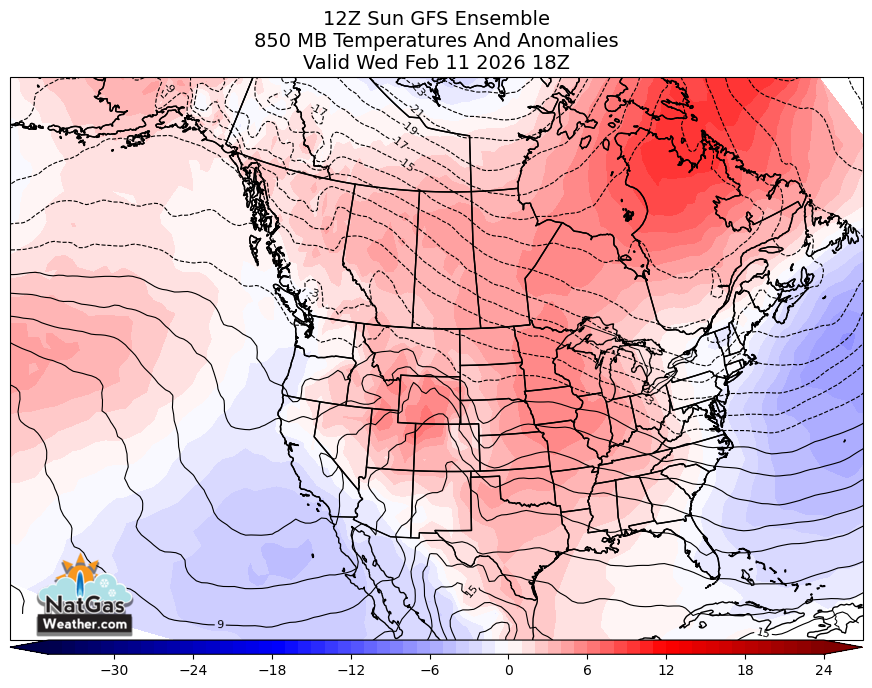
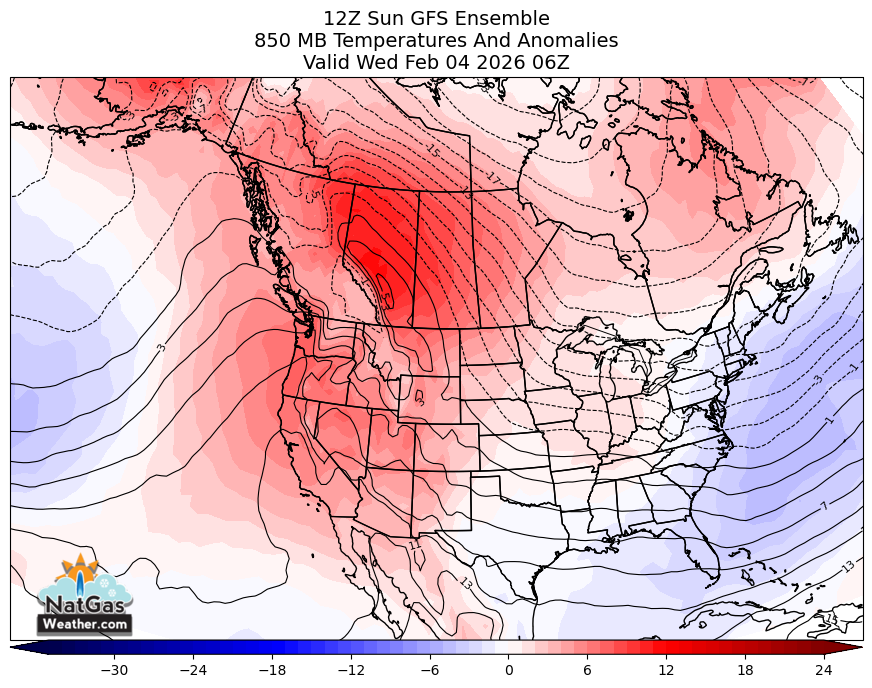
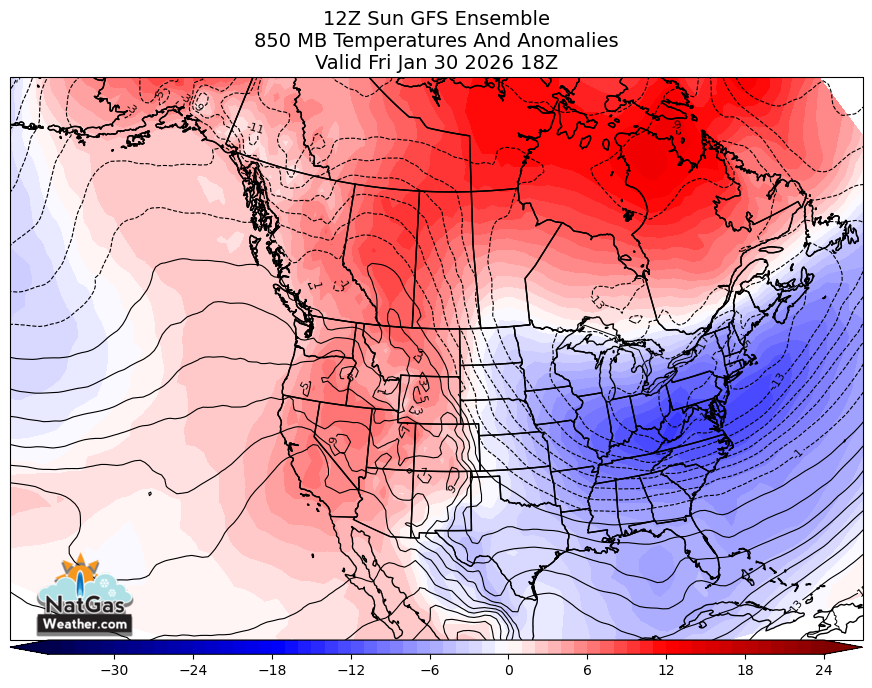
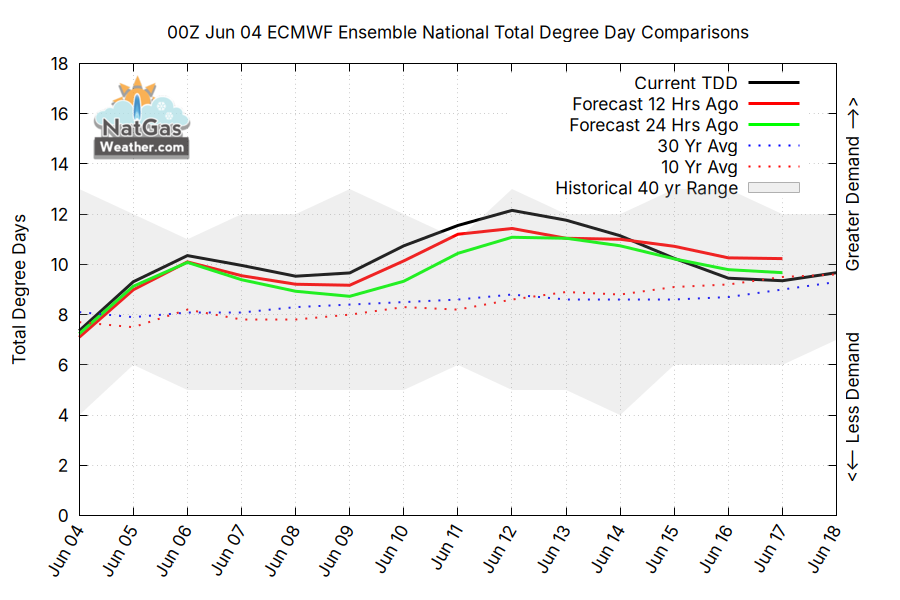
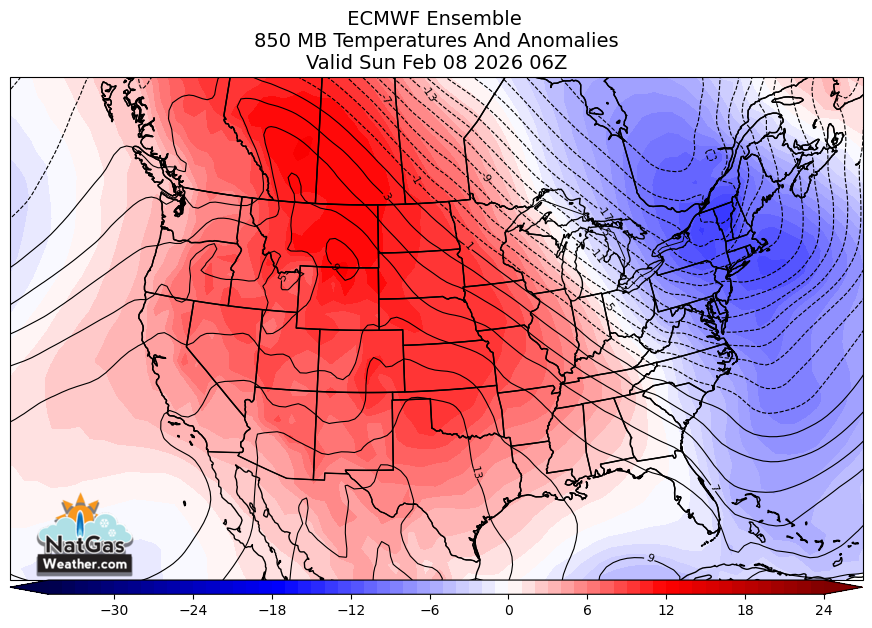
Weather data has steadily trended hotter since the start of the week, especially the EC weather data. Pattern decently hot across the East this weekend, then hotter Texas next week. Although, there are decent weather model differences. Will hotter trends continue? #natgas
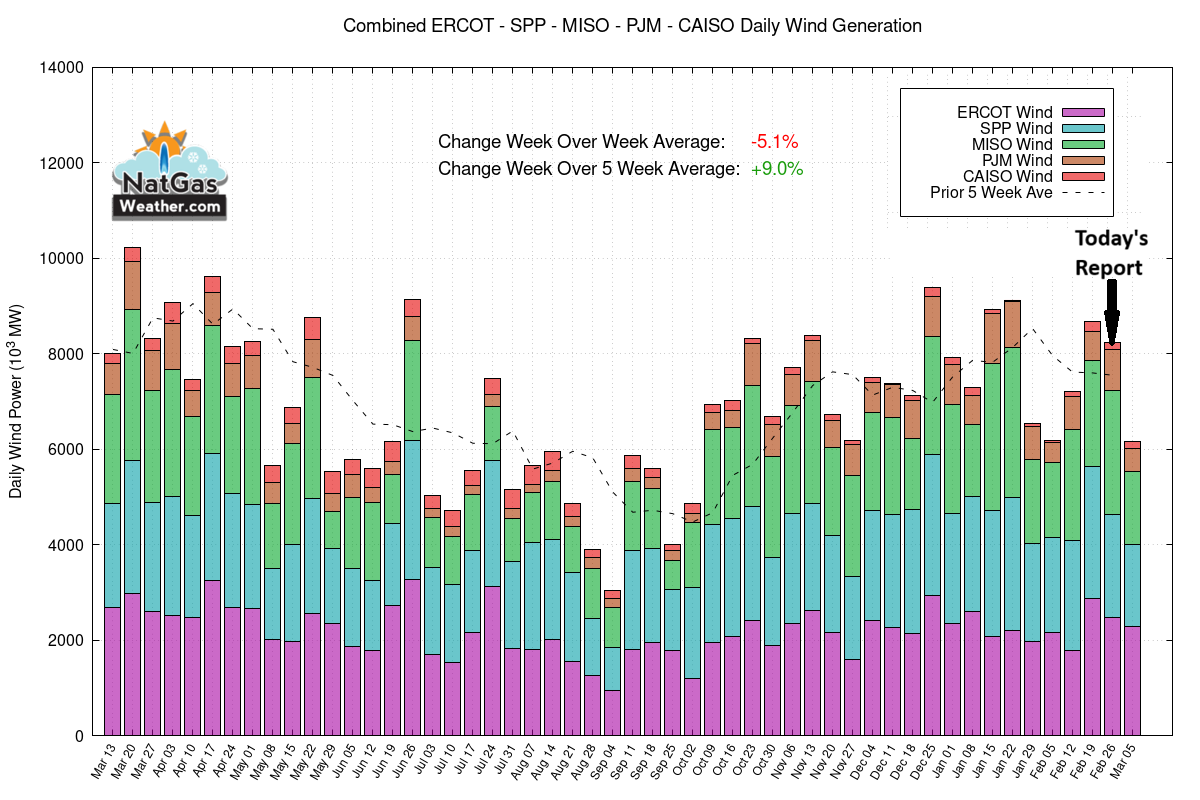
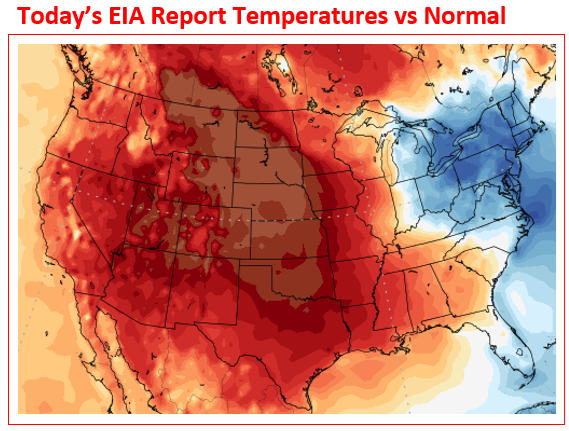
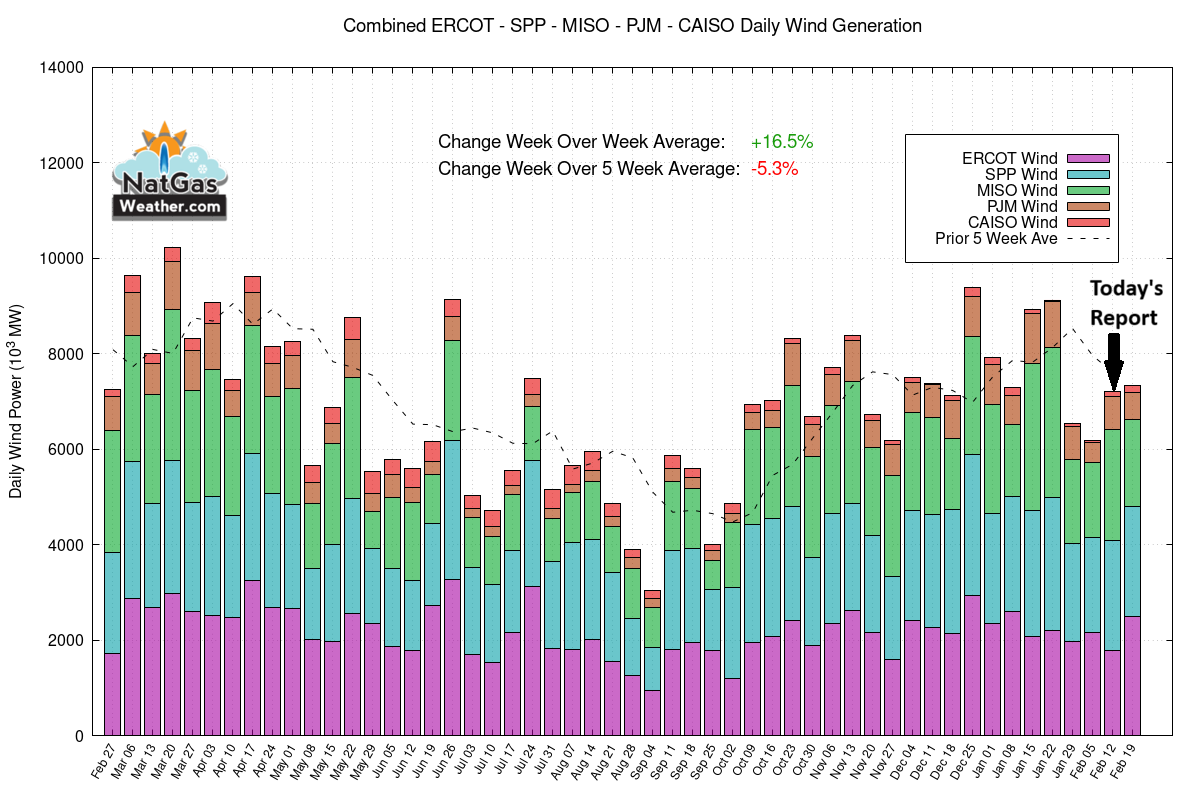
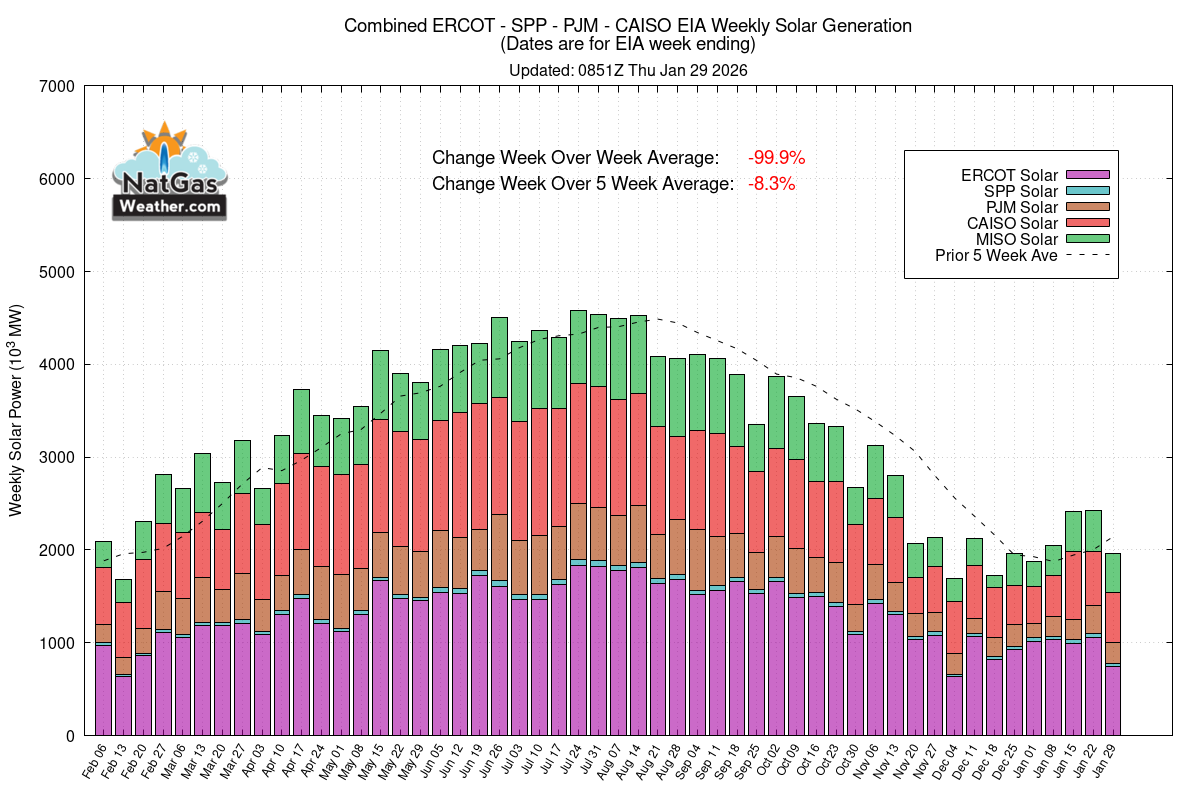
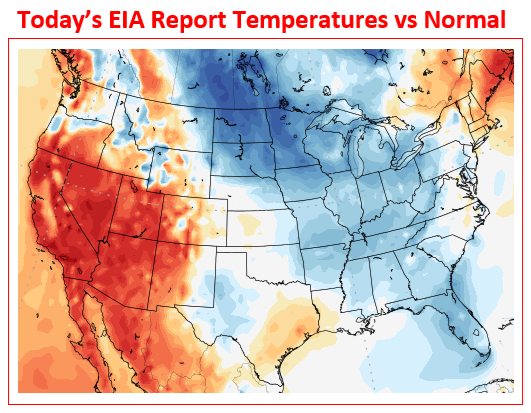
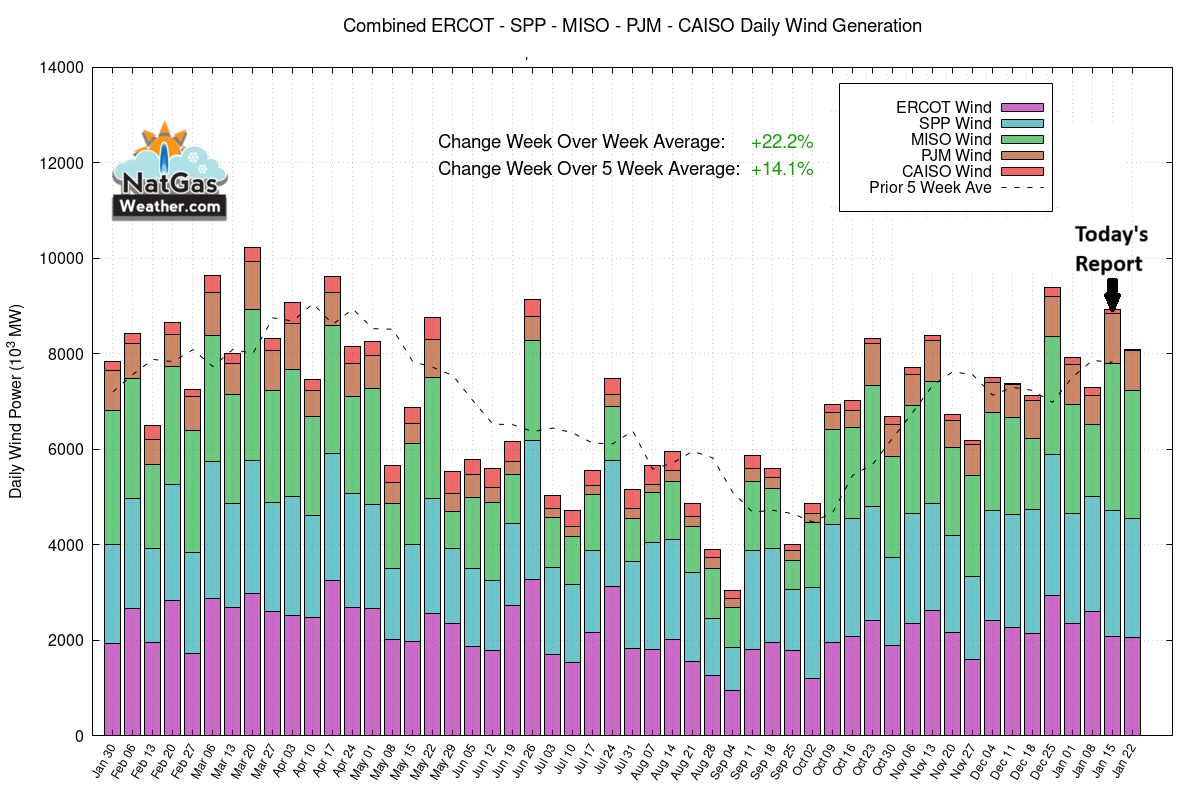
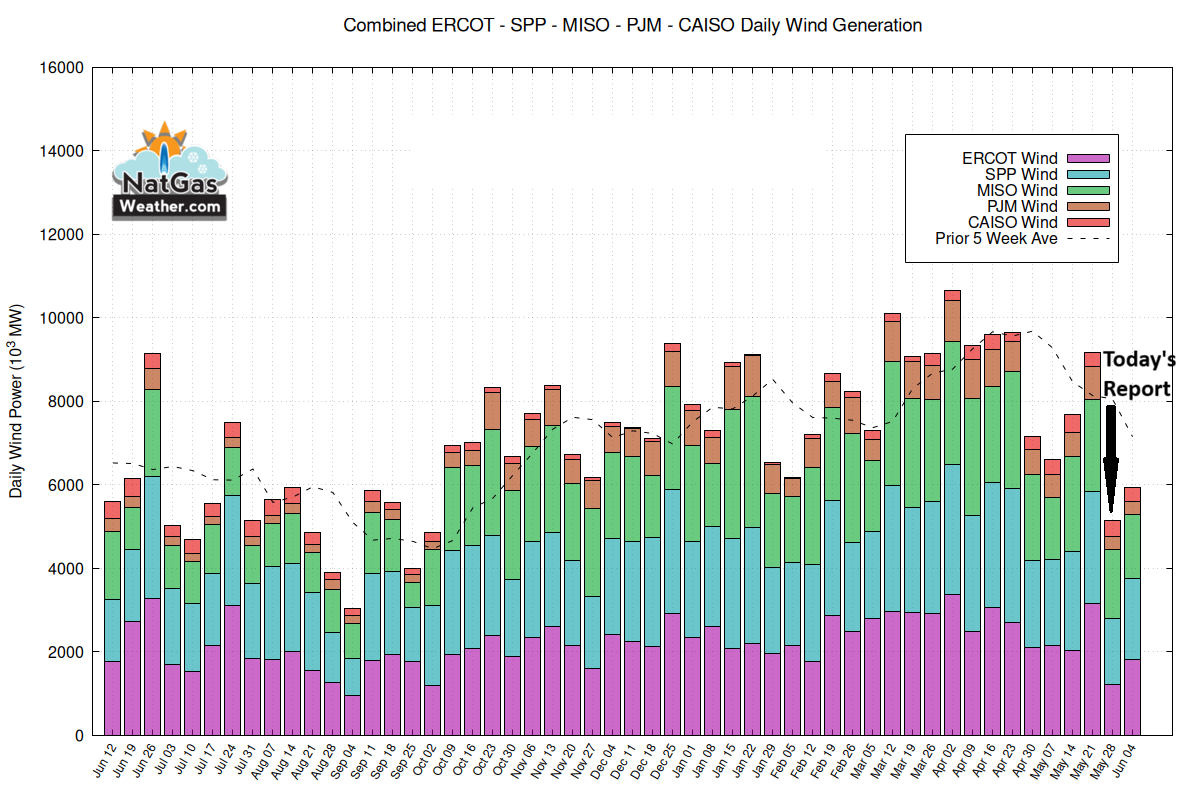
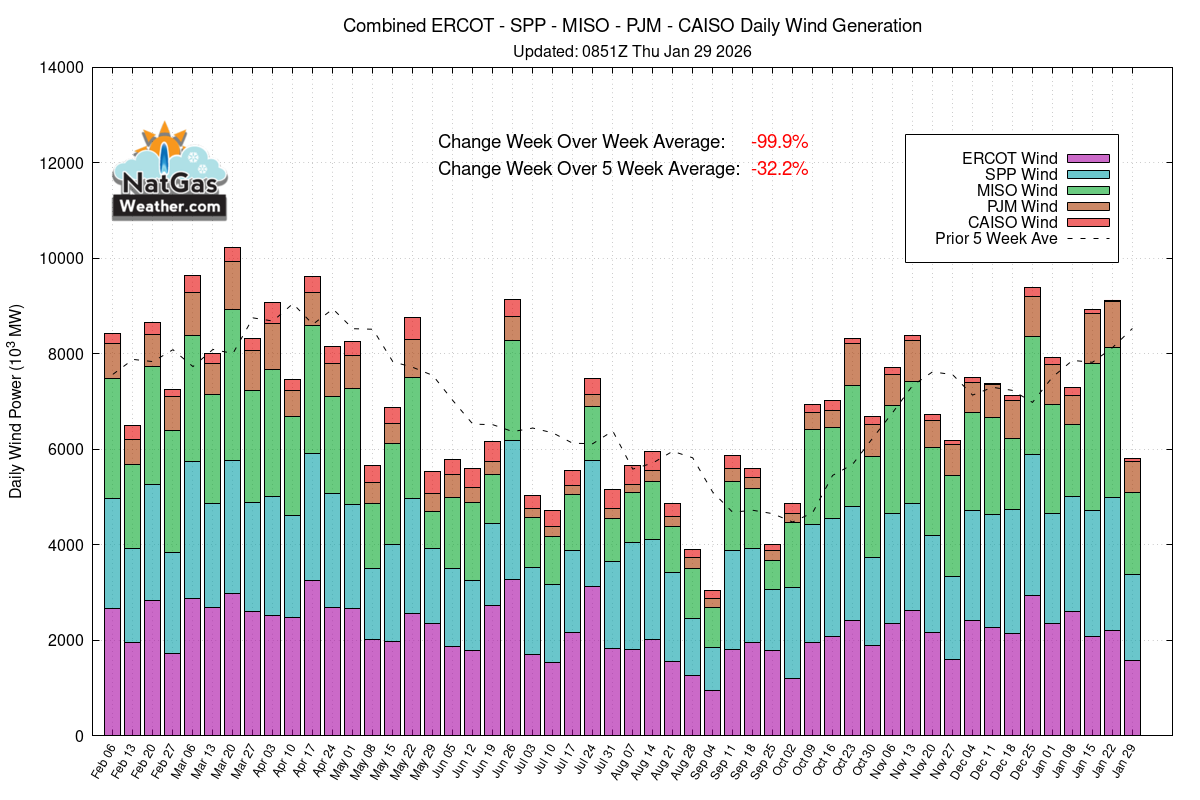
For the EIA report, survey averages suggest a build of +97-101 Bcf vs the 5-year average +101 Bcf. It was warmer vs normal across the NW and Midwest, while cooler than normal over much of California and Texas. We expect +93 Bcf, aided by much lighter wind generation. #natgas
For the EIA nat gas report, survey averages suggest a build of +93-95 Bcf, slightly smaller vs the 5-year of +97 Bcf. There was record breaking heat over the East last week, while it was cooler vs normal across the NW, Mtn West, and Plains. We expect +87 Bcf. #natgas#oilandgas
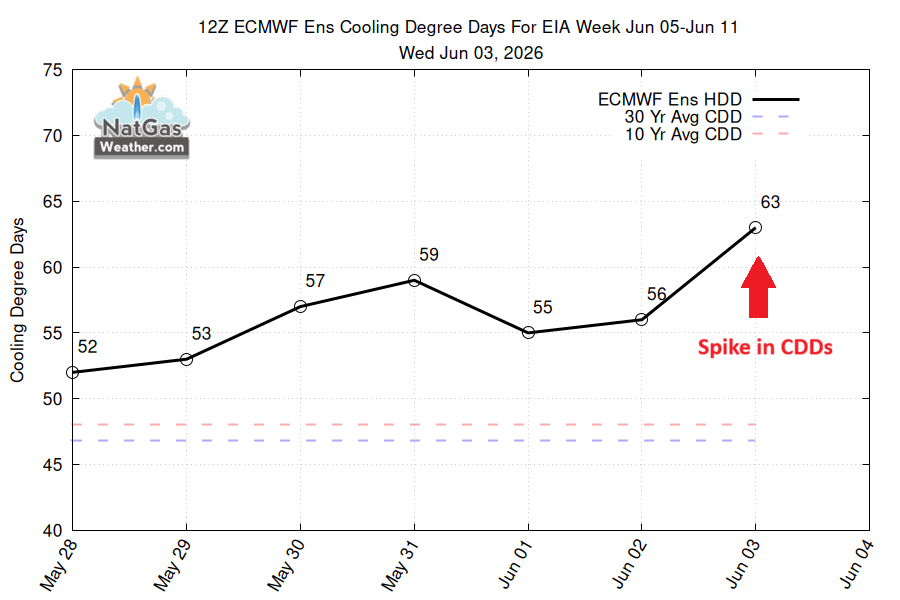
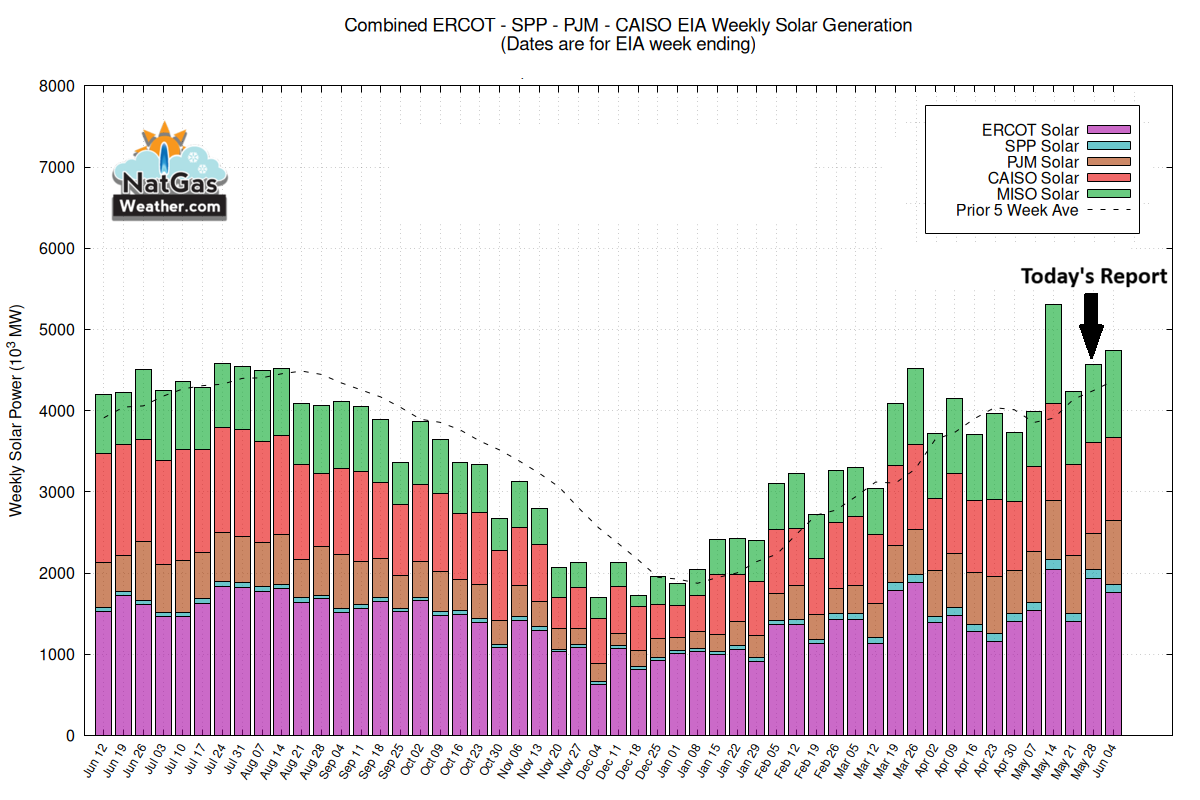
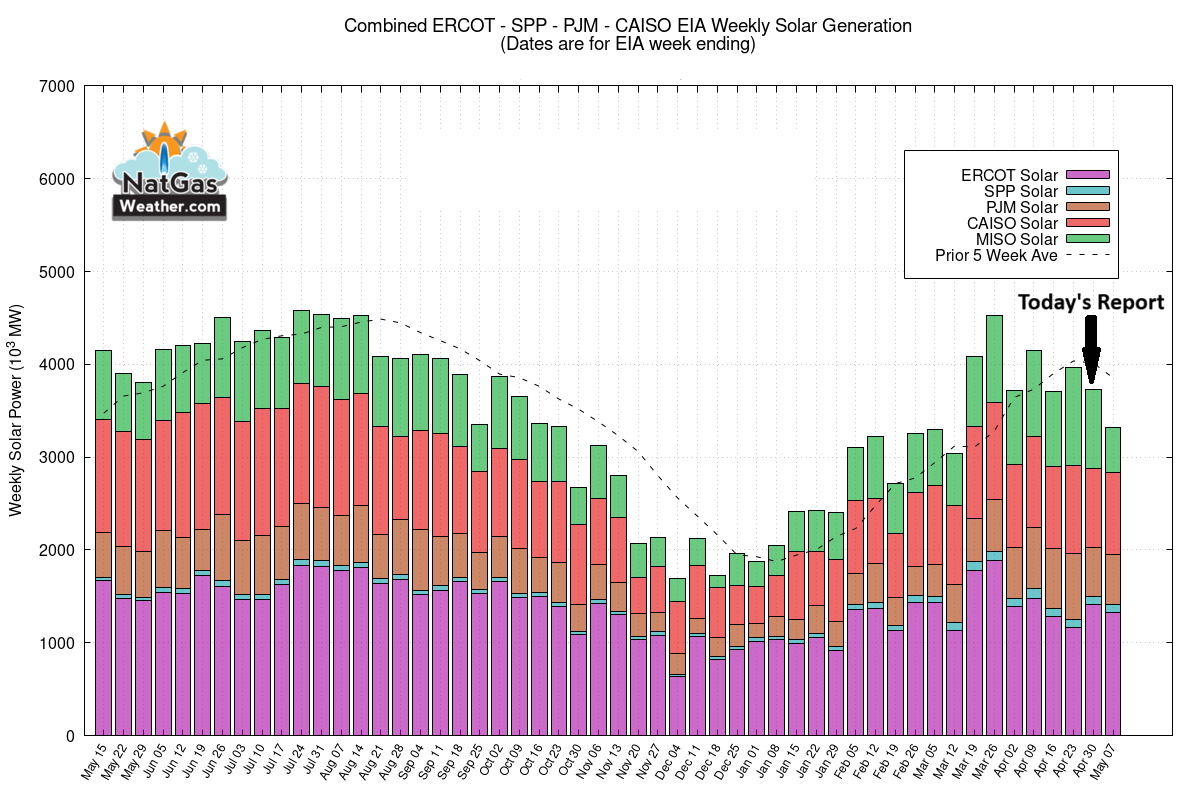
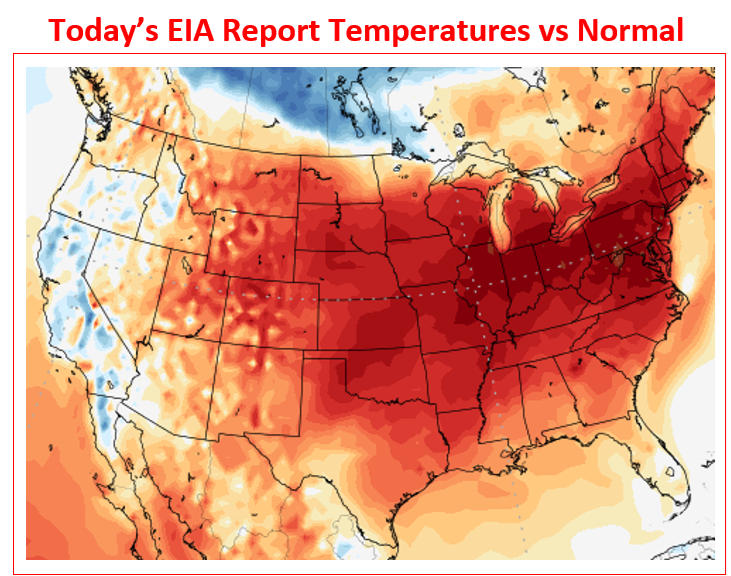
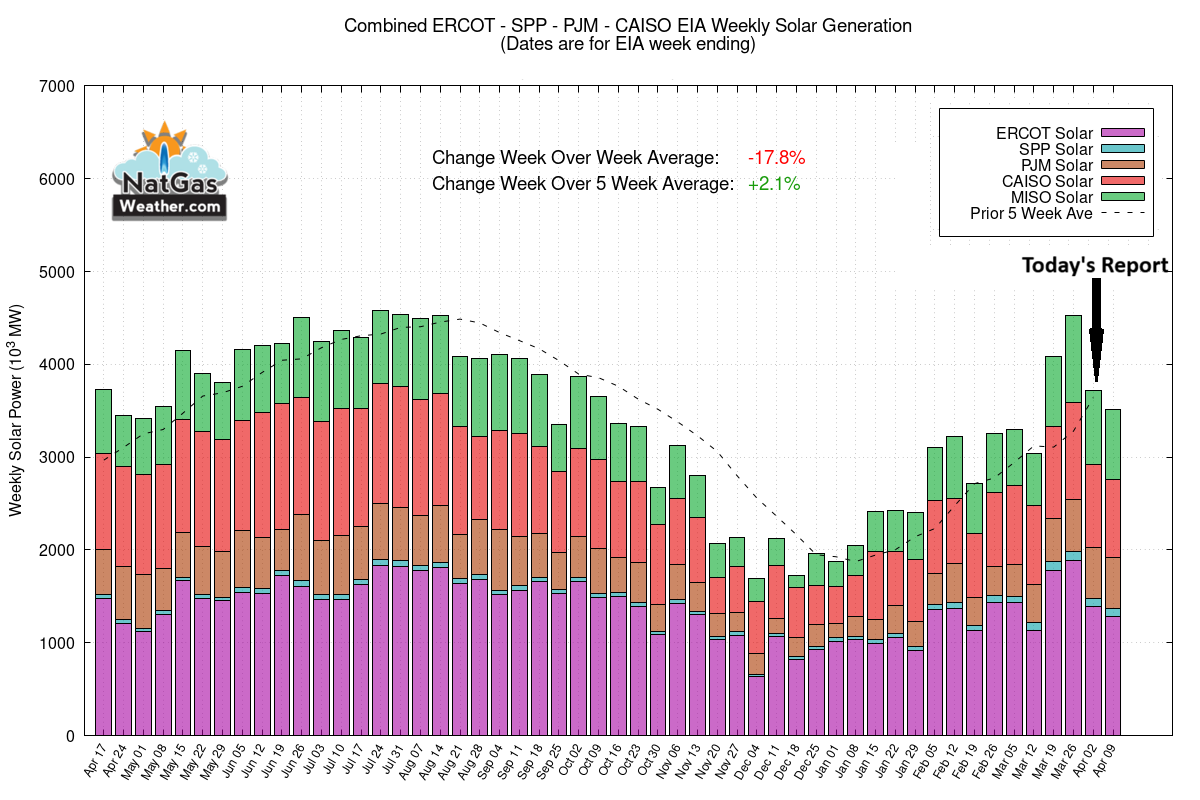
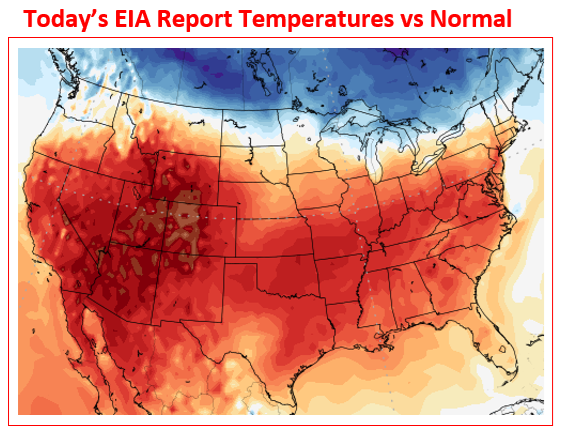
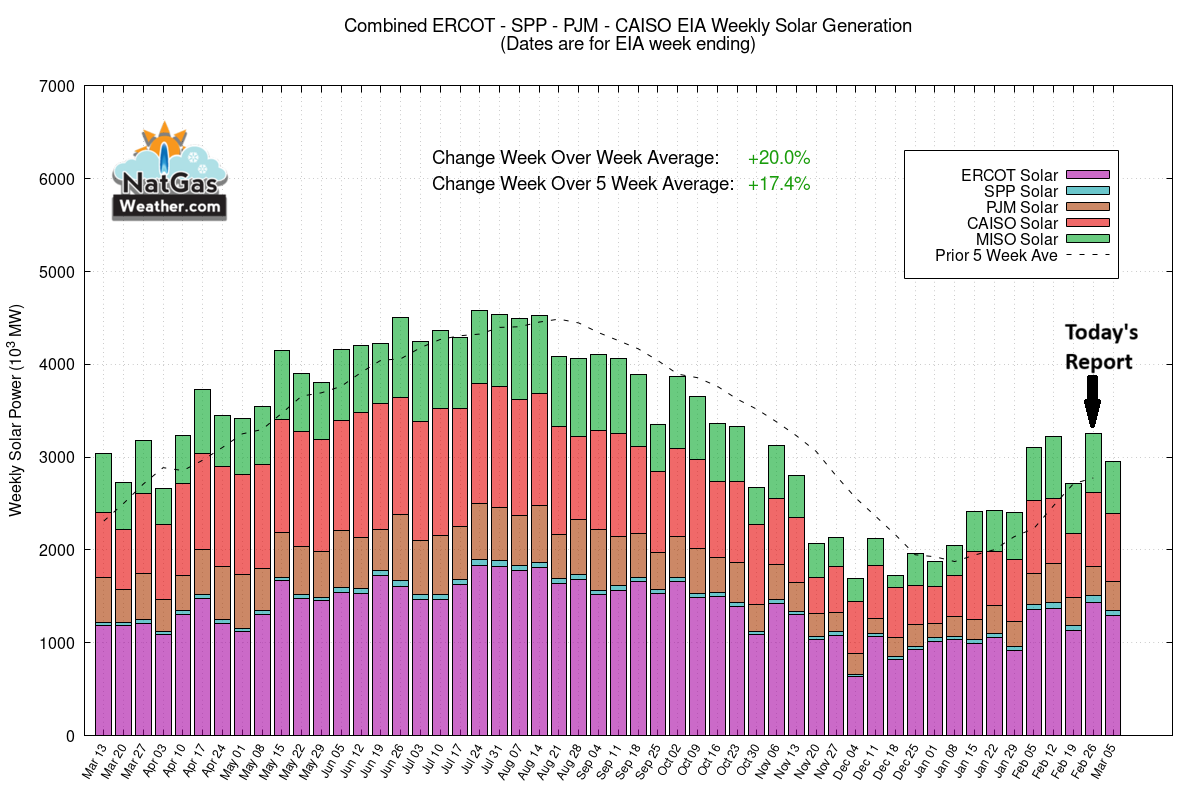
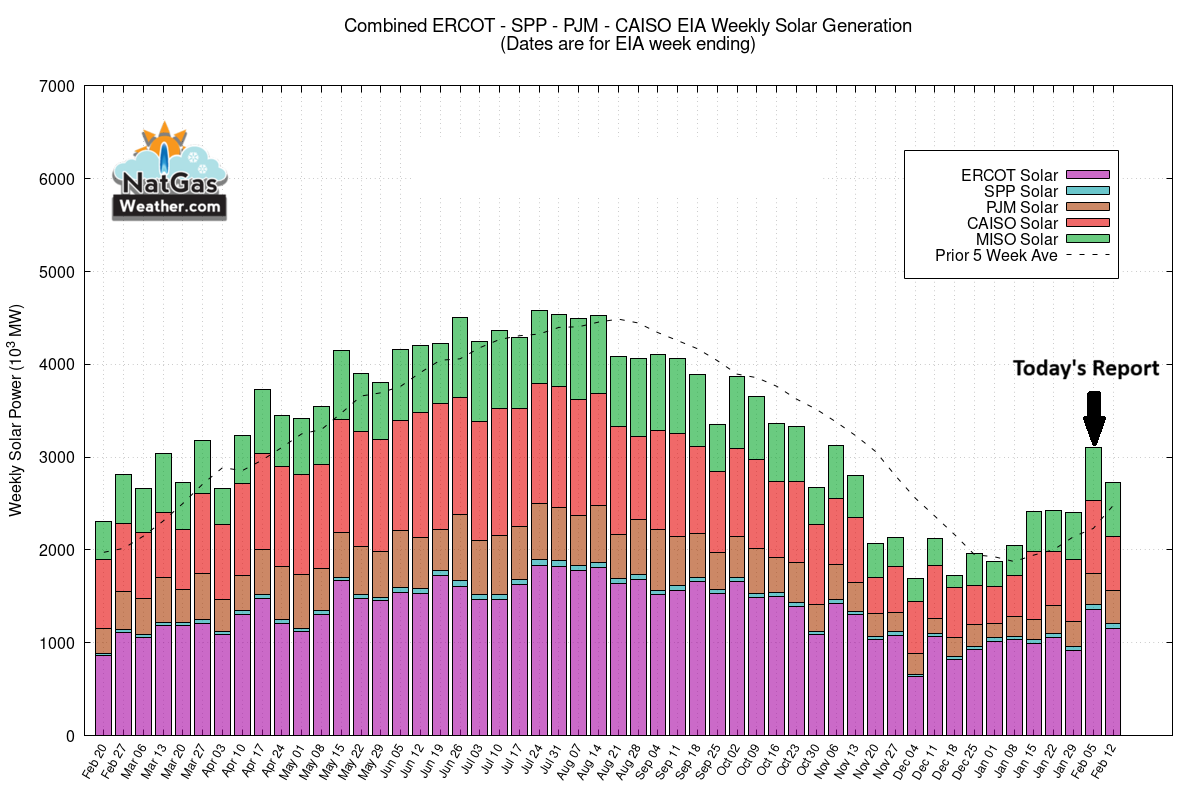
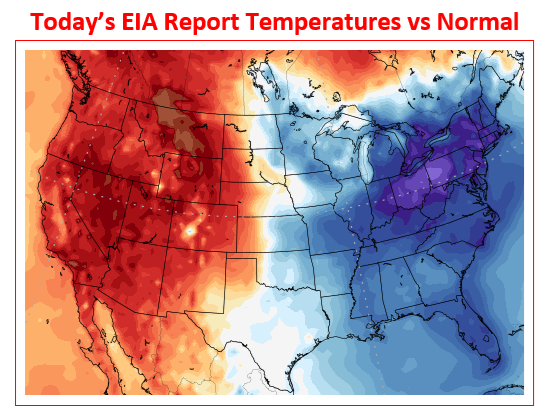
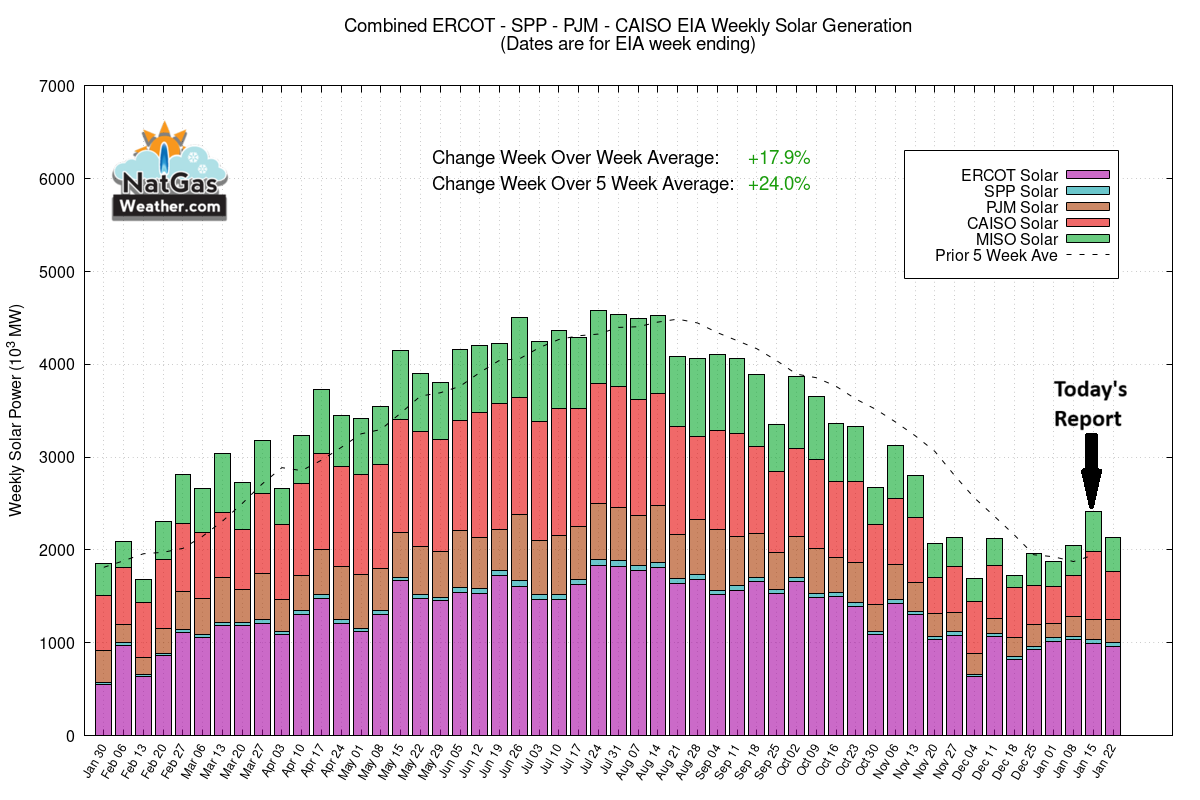
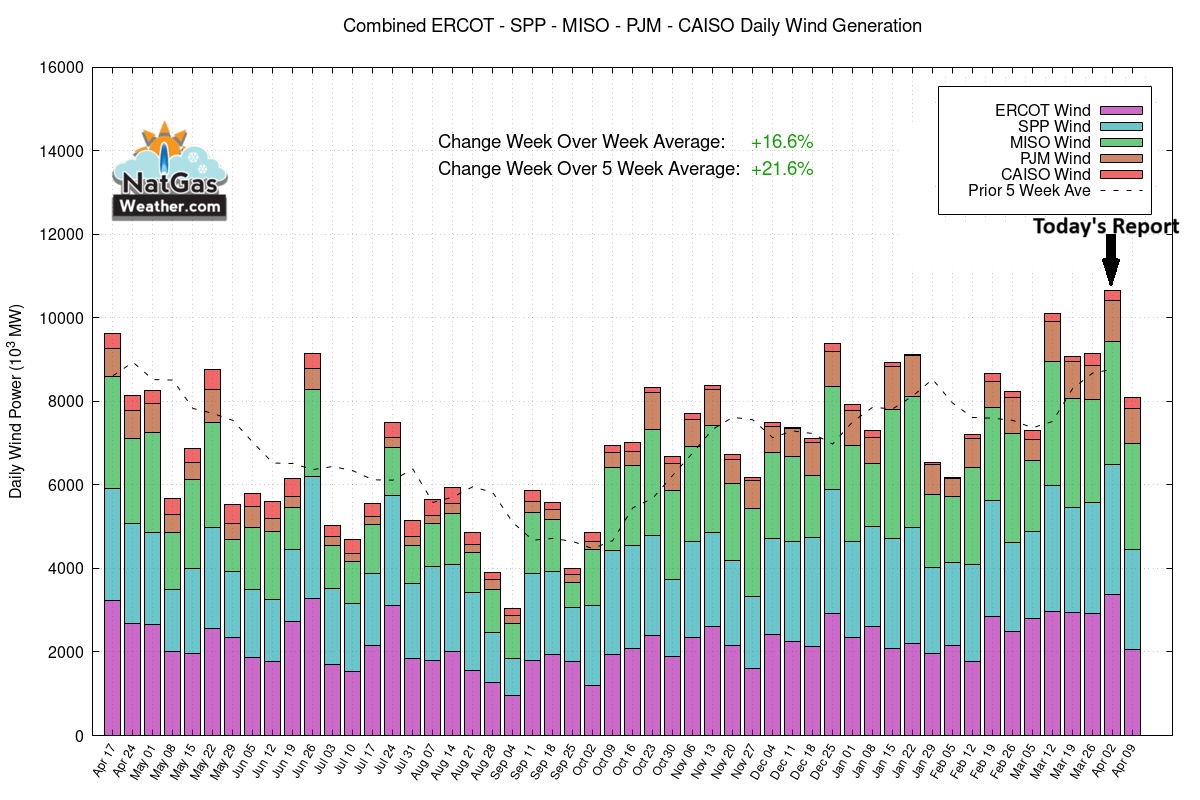
For the EIA report, survey averages suggest +95 Bcf, slightly larger vs the 5-year ave of +92 Bcf. It was warmer vs normal over the western 2/3 of US for the sample week, while the eastern 1/3 was cool vs normal. We expect +100-101 Bcf, aided by record solar generation. #natgas
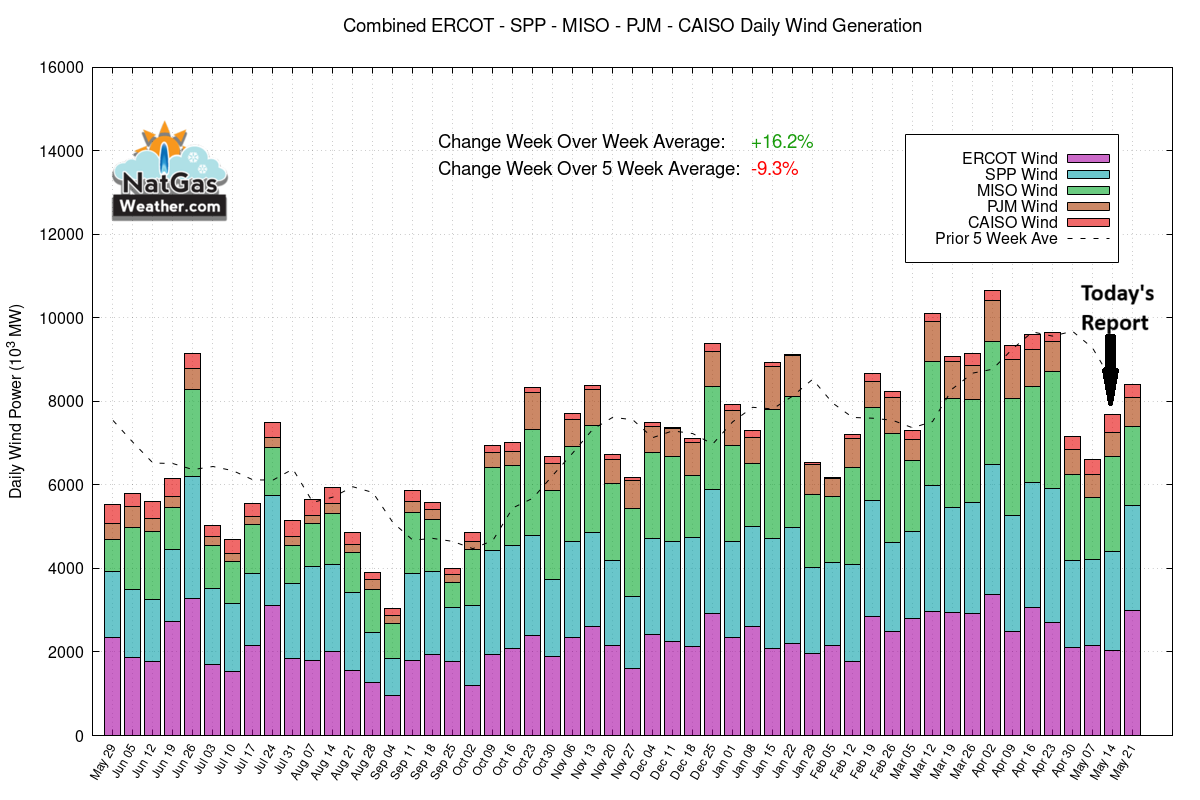
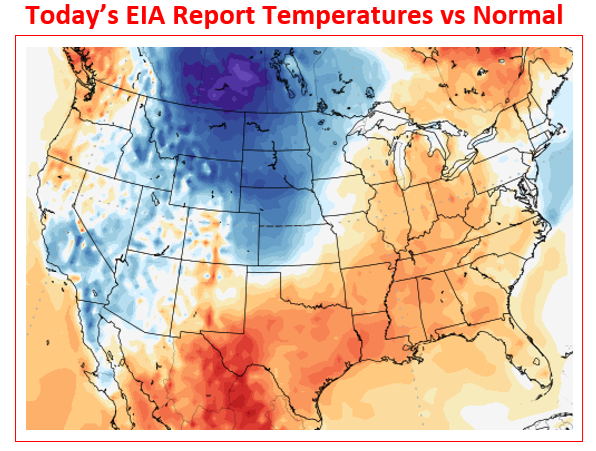
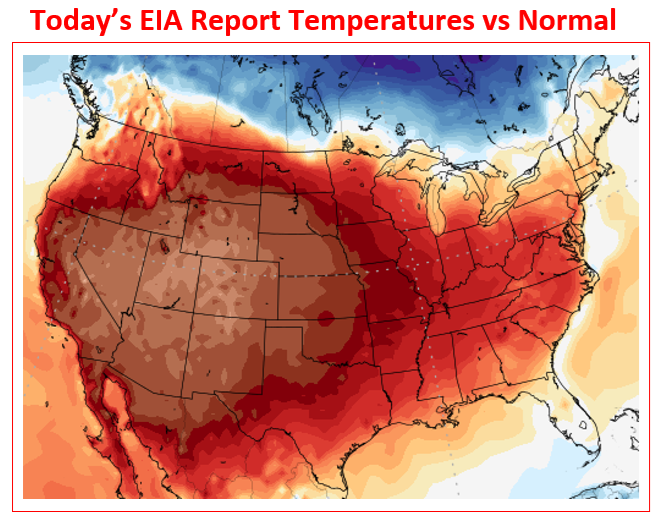
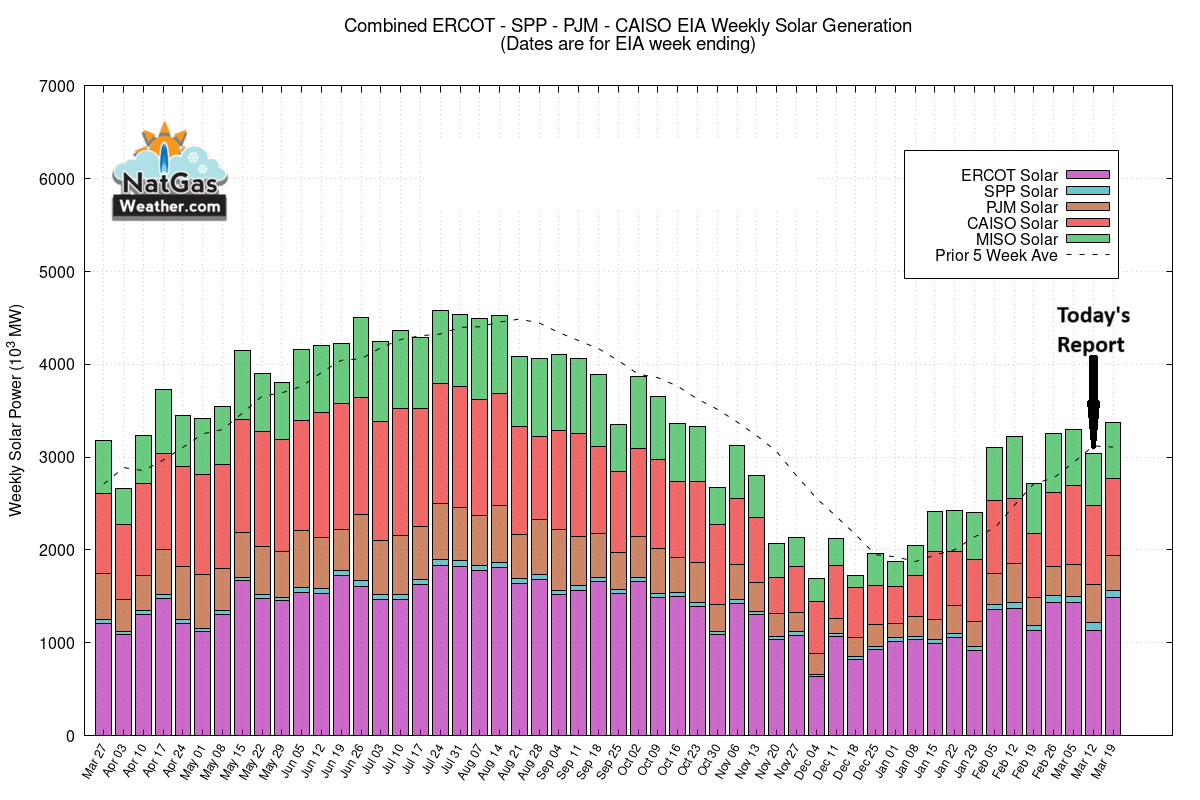
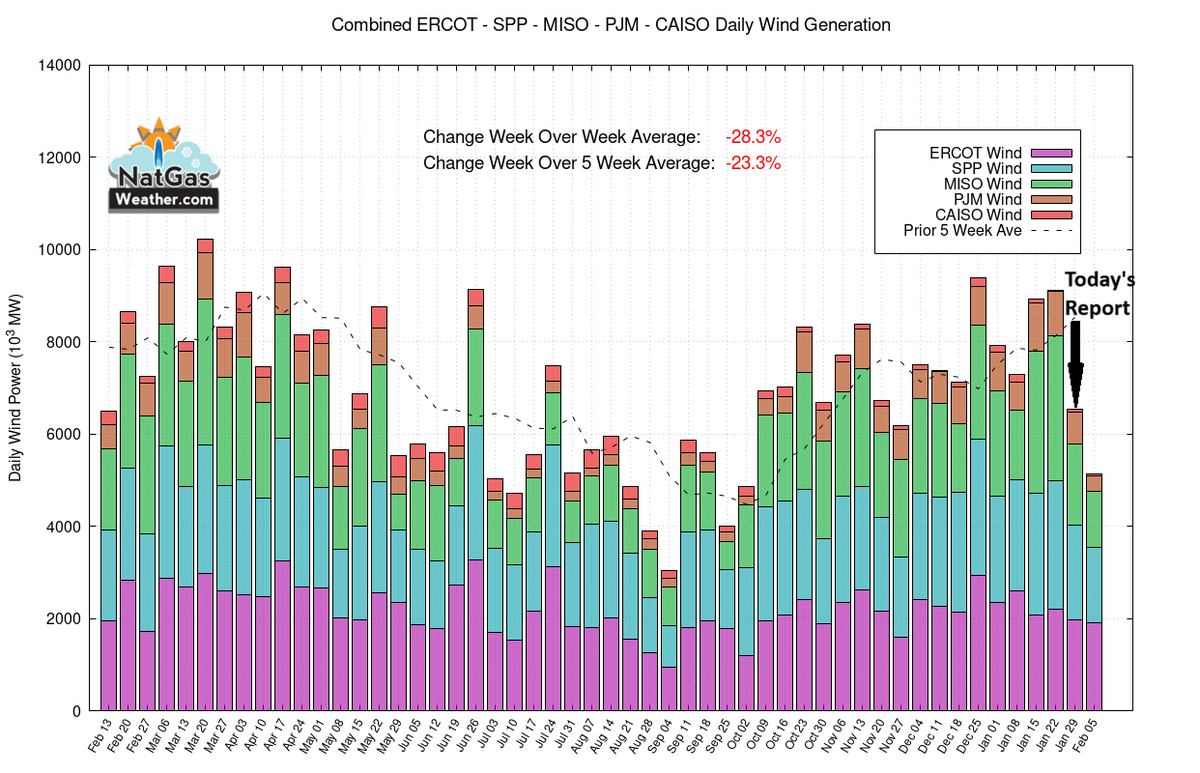
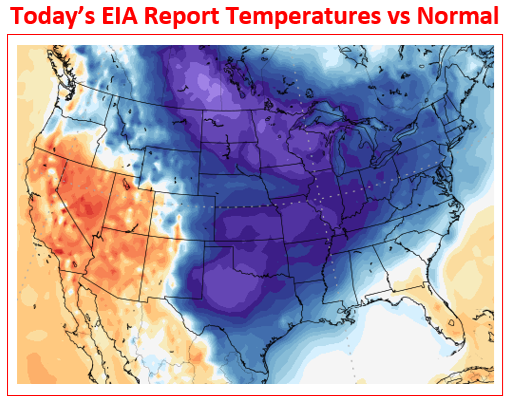
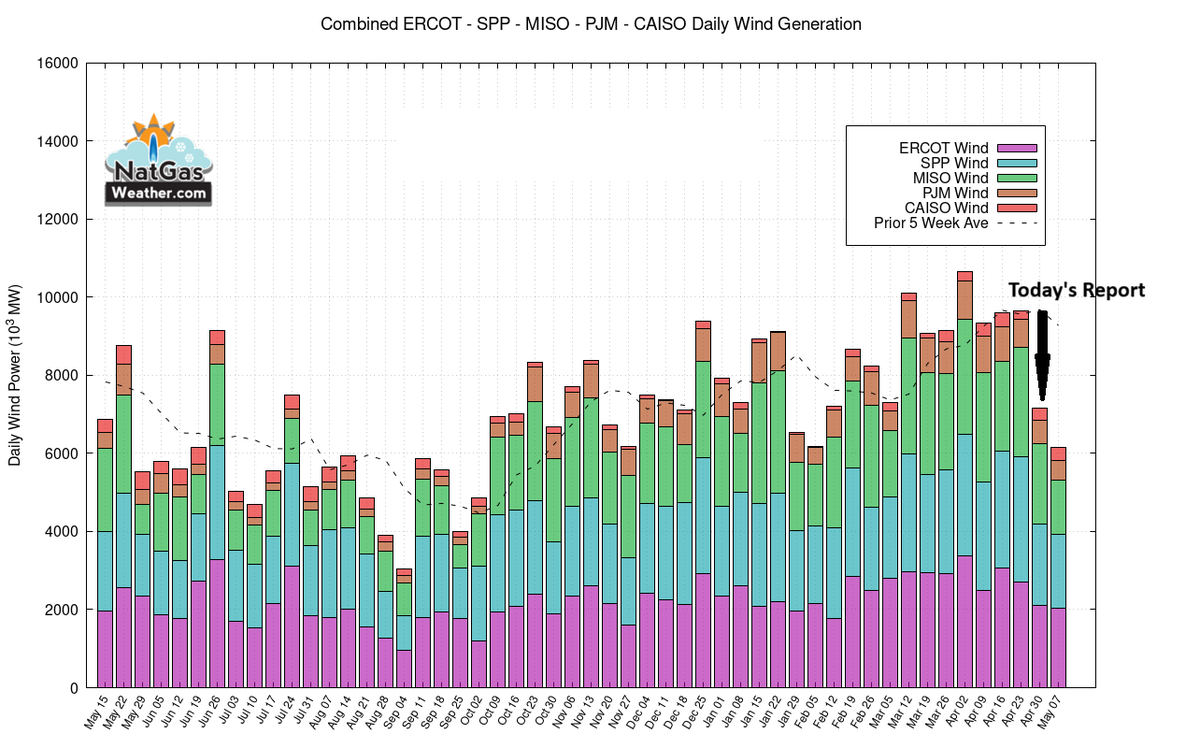
For the EIA report, survey averages suggest +74-76 Bcf, slightly smaller vs the 5-year average of +77 Bcf. It was warmer vs normal over Texas and the eastern ½ of US, while cool vs normal over much of the West & Plains. We expect +68-69 Bcf, aided by lighter wind energy. #natgas
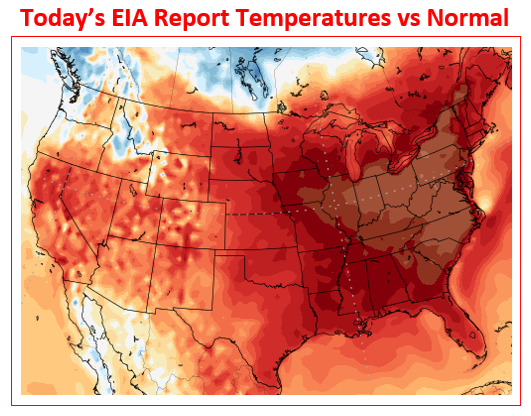
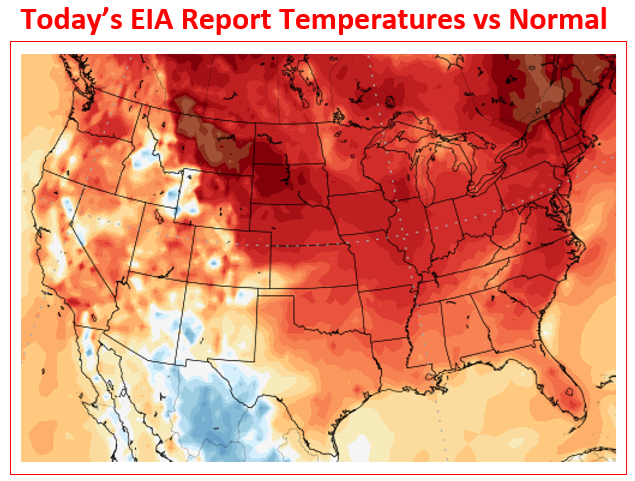
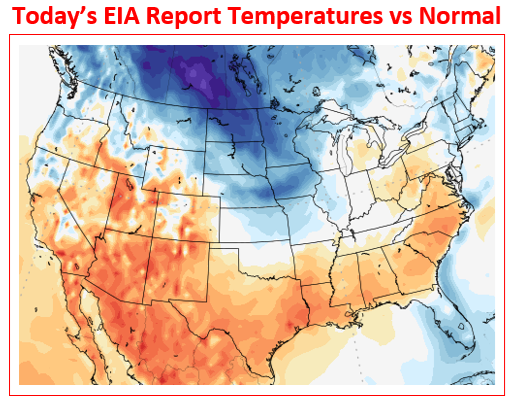
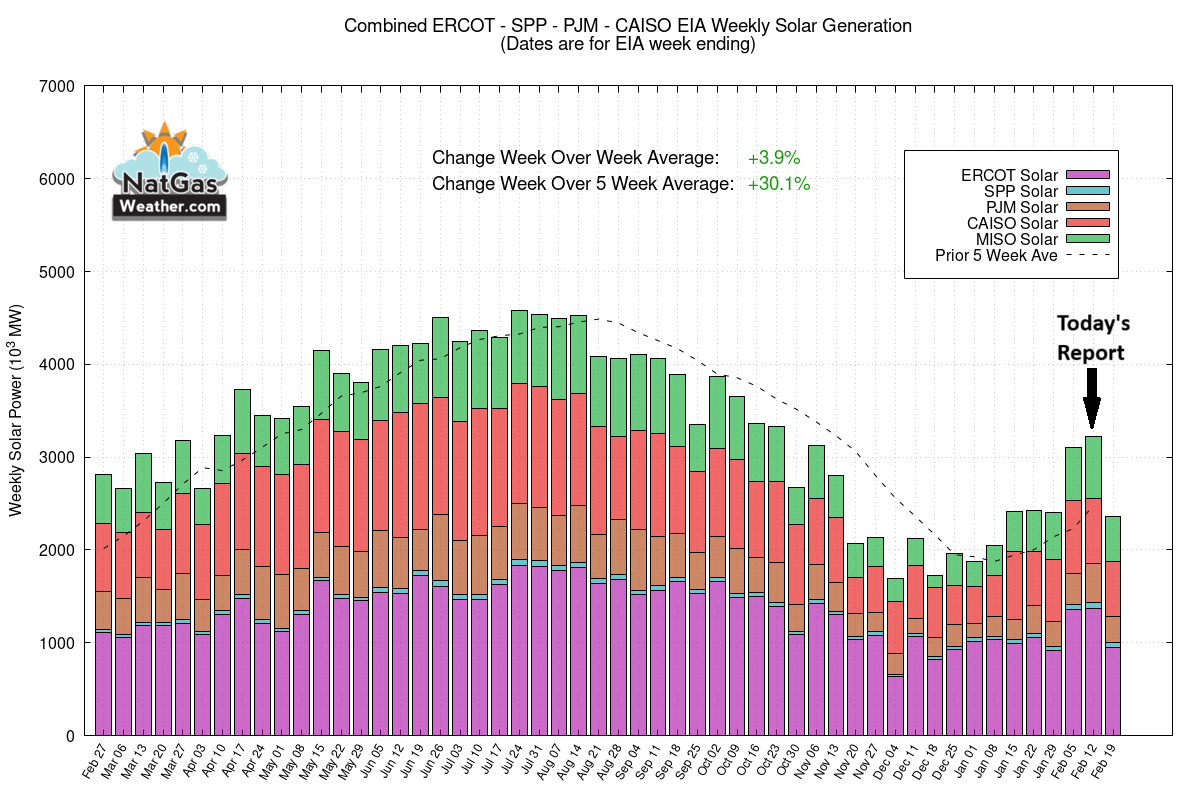
Today's EIA report is expected to print a build of +94-97 Bcf per survey averages, larger than the 5-year of +64 Bcf. It was warmer than normal over most of the US, while wind and solar energy generation were decent. We expect a build of +97 Bcf. #natgas#oilandgas
For the EIA storage report, survey averages suggest a build of +44-48 Bcf vs the 5-year average of +13 Bcf. It was hotter than normal over most of the US, while wind energy generation was quite strong but solar down week over week. We expect a build of +44-46 Bcf. #natgas
For the EIA report, survey averages show a build of +33-38 Bcf, lighter vs the 5-year ave of -4 Bcf. It was much warmer vs normal over most of the US, including widespread 90s-100s from CA to TX. Wind energy generation was flat but solar very strong. We expect +41 Bcf. #natgas
For the EIA storage report, survey averages suggest a build of +35-39 Bcf, much lighter than the 5-year ave draw of -29 Bcf. It was much warmer vs normal over the entire US, while wind energy generation was very strong. We expect a plump build of +41 Bcf. #natgas#oilandgas
For the EIA report, surveys suggest a draw of -121-125 Bcf vs the 5-year of -96 Bcf. It was warmer than normal over most of the southern US and up the East Coast, while near to colder than normal across the northern US. We expect -118-119 Bcf, aided by strong renewables. #natgas
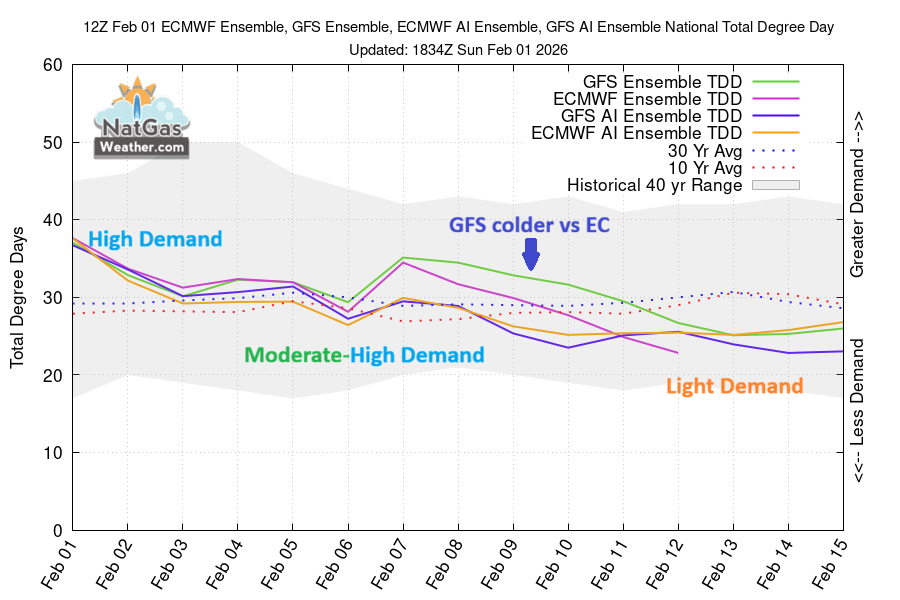
It should be an interesting open w/EC models trending 30-33 HDDs colder, and w/much of it March 1-6. The GFS trended 15 HDDs warmer and is quite a bit warmer than the EC Feb 25-Mar 6. Both are too warm March 7-10. And there's expiration of March'26 soon! #natgas#oilandgas
For the EIA report, survey averages suggest a draw of -150-153 Bcf, in line with the 5-year average draw of -151 Bcf. It was warmer than normal over much of the US besides colder vs normal over the Ohio Valley & Northeast. We expect a draw of -161 Bcf. #natgas#oilandgas
For the EIA report, it was much colder vs normal over the eastern ½ of the US, while warmer vs normal over the West. Wind generation was slightly weaker, while solar was stronger. We except a -254-255 Bcf draw vs the 5-year of -146 Bcf and market expectations of -261. #natgas
For the EIA report, a huge draw of -375 Bcf is expected by survey averages due to last week's Arctic blast. It’s a very tricky draw due to predict due to freeze-offs, widespread power outages, and lower LNG usage. We expect -369 Bcf vs 5-year average of -190 Bcf. #natgas
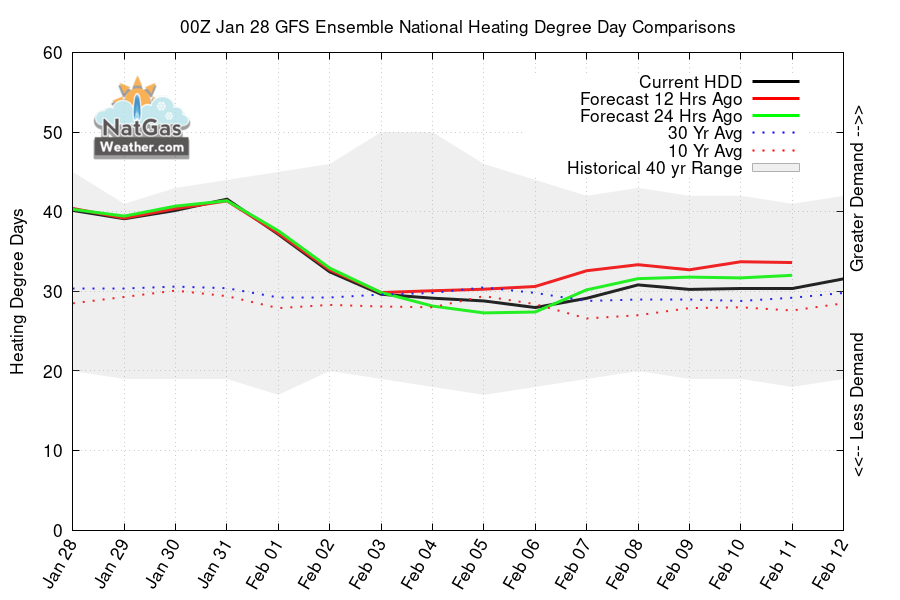
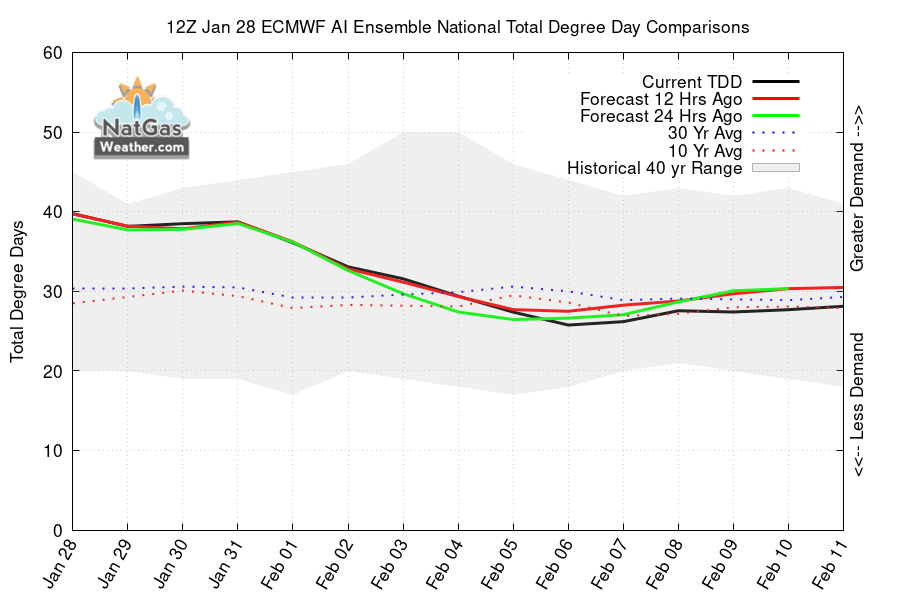
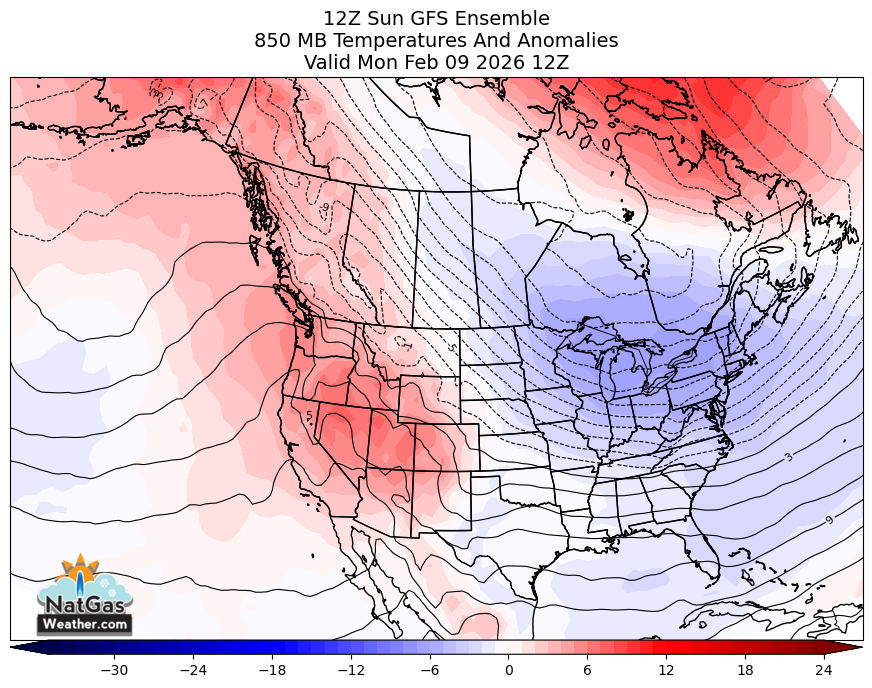
Weekend weather trends were to the warmer side as the GFS trended 14 HDDs warmer, while the EC and EC AI trended 23 & 16 HDDs warmer. There's still weather model differences but much of the data trended warmer over the eastern 1/2 of the US for Feb 8-15. #natgas#oilandgas
For the EIA report, survey averages are tightly clustered at -231-233 Bcf, larger than the 5-year average of -208 Bcf. It was colder than normal over the Midwest and eastern ½ of the US, while warmer than normal over the West. We expect a draw of -231 Bcf. #natgas#oilandgas
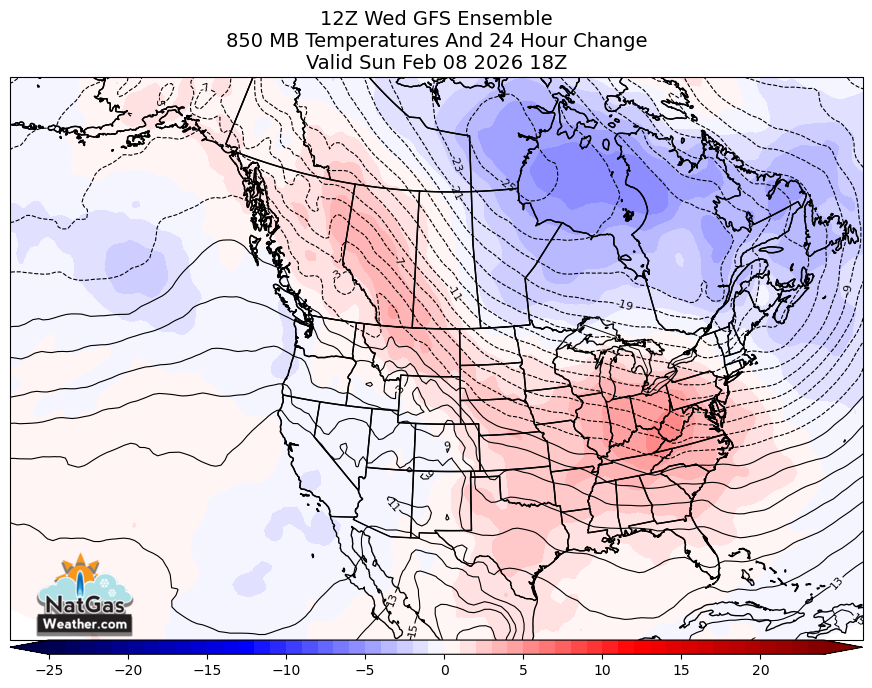
Weather trends warmer so far today as overnight GFS lost 21 HDDs. New midday EC AI just lost 9 HDDs for 8-15 day period. Most data not quite as cold for Feb 8-12 the past 12-hours. New traditional EC data starting to come in and trends for Feb 8-12 could be important. #natgas
Weekend weather trends are in vs midday Friday. The GFS trended +5 HDDs colder, EC +2 HDDs colder, & EC AI +6 HDDs colder.
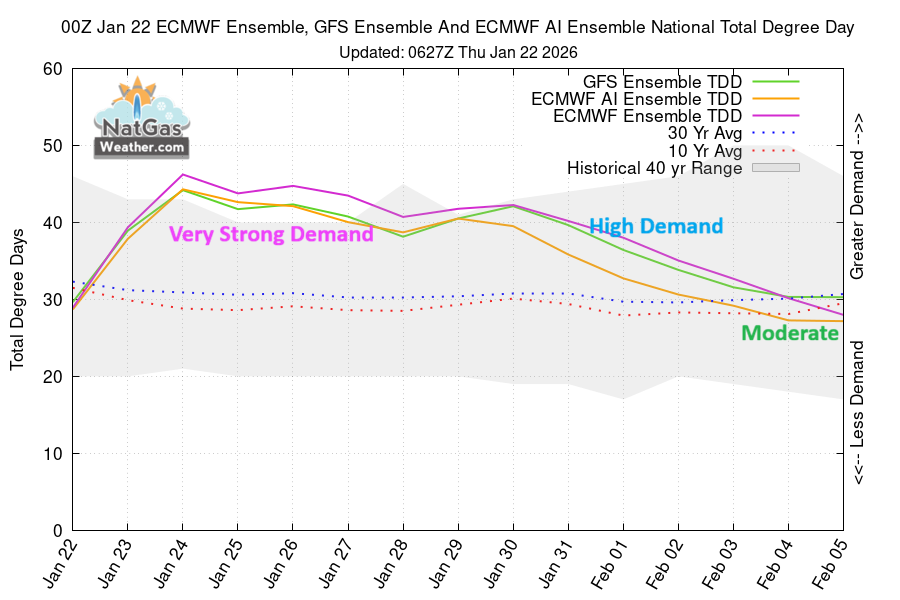
Very strong demand next 8-days. Still lighter demand Feb 2-7. However, data teases cold returning to Midwest & Northeast Feb 8-11. #natgas#oilandgas
Survey averages for today's EIA report suggest a draw of -103-104 Bcf, much lighter vs the 5-year average of -191 Bcf. We expect -101-102 Bcf, aided by warmer vs normal temperatures over most of the US. Although, the following 3 EIA reports will be much more important. #natgas