On October 18 we wrote down "about 5 GB a day" for our agents' uploads, when only 2.1 GB had gone out. The day ended at 14.5 GB, and 85% of that traffic came after we wrote the number.
The agents run on one Mac, and "uploads" here means the request bodies they send to the model. Two weeks after that note we added the log up by whole days and found we had been wrong in both directions: on October 11 we had estimated far too high, and on October 18 far too low. Both estimates had the same flaw. We took a short stretch, multiplied it up to a day, and wrote the result down as if it were the day.
Compression comes into the numbers, so one line on it. It means gzipping the request before it is sent, and what comes out is about 60% of the original. Uncompressed numbers have to be compared with uncompressed ones, and compressed with compressed.
Estimate one. On October 11 we took a 5-minute rate, which came to about 90 GB a day, and then wrote it into an earlier post of ours as "about 3.8 GB per hour" for readers to compare against. A whole day we can compare it with, October 15, was 28.6 GB, so 90 GB was 3.2 times that.
October 11 itself was different. It was the busiest day in our record, about 107,000 requests, and the busiest day since then had about 69,000. Splitting that day by its per-request size, 0.6 to 0.89 MB, puts the uncompressed total somewhere between 70 and 95 GB. So 90 GB may have been close for that one day. Our mistake was to turn the heaviest day we had into an hourly rate and hand it out as normal.
Estimate two. On October 18 we wrote 5 GB, compressed. That number only fits the night. In the roughly 15 hours before we wrote it, including the evening of the 17th, the Mac had sent 2.77 GB, which scales to 4.4 GB a day. After we wrote it, the rest of that day sent another 12.4 GB. The whole day was 14.5 GB, 2.9 times our estimate, and more than 85% of it happened after we had drawn our conclusion.
So much for the two wrong numbers. For a normal day we need a rule, because the Mac sits idle part of the time, with no requests and so no statistics lines. We kept only days with no gap over half an hour and more than 10,000 requests. There were 9 such days. Uncompressed they sent 15 to 36 GB a day, with a median of about 24 GB. After compression, the median actual upload was 14.5 GB, and October 18 happened to land on that figure.
Taken over a whole day, the average comes to about 1 GB an hour uncompressed and about 0.6 GB compressed. The 3.8 GB an hour from our earlier post was a busy-hour reading. We should have said so then, and we are saying it now.
Why a short stretch can't scale to a day. Take October 15, in bytes before compression. The quietest hour sent 20 MB and the busiest hour sent 4,968 MB, a 250-fold difference. If you had sampled only one of those two hours and multiplied by 24:
quietest hour, times 24: 0.5 GB a day
busiest hour, times 24: 119 GB a day
count the whole day: 28.6 GB a day
On that day 3.8 GB an hour was neither the average nor the peak. Only 1 of the 24 hours went past it, and the busiest one sent almost 5 GB.
Days measured after compression look the same. On October 18 the busiest 10 minutes were equivalent to 3.7 GB an hour, and the day's average was 0.61 GB an hour, six times lower. The busiest four hours held 58% of the day. Agents work in bursts, and the traffic comes in bursts with them.
Dividing a peak by a fixed factor does not work. Across the nine days, the busiest 10 minutes ran at 4.6 to 16 times the day's average. A factor that suits today is off by more than 3 times tomorrow.
Counting requests does not work either. On October 13 there were 10,417 requests and 23.7 GB before compression. On October 17 there were 40,722 requests and 25.9 GB. That is 3.9 times the requests for 9% more bytes, so a request count can't stand in for bytes.
We still think the product of upload per turn, turns per hour, number of agents, and hours is right for explaining where traffic comes from. For a daily total it isn't enough, because every factor moves. Use the product to decide what to cut, and the log to find out how much there is.
Start counting. Find a place that shows cumulative upload: vnstat on Linux (-h for hourly, -d for daily), the outbound traffic chart in a cloud server's console, or on a Mac the Network tab of Activity Monitor, which shows total data sent at the bottom. Note it in the morning and in the evening and subtract. Some users report that a restart resets it; we haven't tested that on our Mac. Before you look, write down what you think a day is. Then count three whole days in a row, by the hour if you can. Put three numbers side by side: your estimate, the busiest hour times 24, and the real whole-day figure. In any cost table, use the real figure.
The limits of our numbers: one Mac, three weeks, and request bodies only, without protocol overhead. Over the same period the network layer read about 15% higher. Your agents and habits will differ, so don't copy our absolute values; look at the shape.
On October 18 we had only the quiet night's numbers in hand and drew a conclusion for the whole day. On November 2 we tried not to. By 3:30 in the afternoon the Mac had sent 3 GB, and we waited. The day ended at 5.5 GB. Multiplying up at that point would have given 4.6 GB, off by about a fifth. That day the gap was small and on October 18 it was large, and before the count is finished you can't tell which kind of day you are in. A number written before the day is over describes the part of it you have seen.
We can't prove two shared-drive files match.
Our file scanner takes the file size and three 64 KB samples, from the start, the middle, and the end. If they agree it calls the pair "suspected same" and merges nothing. As of October 18, that is how our Local Context Engine treated shared-drive sources, where full reads are not allowed. On a local disk it hashes the whole file.
Two files of equal size that differ only between the samples would match. The code's own comments say a sampled fingerprint is not a full identity. So the match is stored as a relationship, and both locations stay in the index.
Take a made-up case. The same drawing sits in design, sales, and delivery folders, and the delivery copy went to the customer. A guess should not collapse the three.
Where a probable match can delete, merge, or hide a copy in your tool, make it suggest instead, and store how sure it was.
A debt 12x larger can rank below a small one.
In an overdue list we built for businesses in China, each customer gets a score from four parts. In the version we reviewed on October 17, the default weights were 50 points for amount overdue, 30 for days overdue, 10 for customer grade, and 10 for broken promises.
Take two made-up customers. A owes a fifth of the amount ceiling, is 5 days late, has the weakest grade, and has missed two promises. A scores 31.3. B owes one twelfth as much, is 120 days late, has the top grade and no promise on record. B scores 33.8 and goes first, because 120 days earns the full 30 points.
That is the formula working as set. With the weights written down, "why B before A" is a sum a bookkeeper can redo on a calculator.
Score your three largest overdue customers by hand with your own four weights, then compare with the order you would ring them in.
Summing token usage line by line from Claude Code's record files gives 2.03 times the total you get by counting each message once: about 1.06 million assistant lines, from about 500,000 distinct messages. Each line carries the whole message's usage, so the miscount was ours.
We recounted on November 8, across the main record files under Claude Code's project folders on one Mac. The fix is to count each message once, by its id.
Why we went back. In September we ran a cost comparison between another provider's coding plan and Claude. At 17:47 on September 1 the answer was that the other plan cost 4 times as much. Eleven minutes later our new count said it was 1.7 times cheaper. The next day it was 2.6 times more expensive, and when we wrote it up in early October it was about 6 times. We had kept a table of retired numbers, and it says why each one went.
The 4 times was a single window extrapolated without deduplication. The 1.7 times divided cumulative tokens by the week's credits, also without deduplication. The 2.6 times mixed in a looser window from August 31, and the table's reason for retiring it doesn't mention deduplication. Two other numbers, "278 requests hit the limit" and "286 turns", were record counts, not request counts: the same mistake of treating lines as events. Two earlier token totals were marked "not deduplicated by message id, counted 2 to 3 times too many". So deduplication explains some of the errors, and it is the one that never throws an error and still hands you a big, plausible number.
What a message looks like in the record. Open any record file under ~/.claude/projects/ and each line is a JSON object. One model reply is an assistant message with its own id, and it can hold several content blocks: some thinking, some text, a tool call. In our files each block is written as its own line, and every line carries the message's complete usage field.
Here is one three-block message, block types and four usage numbers only, no content:
block input output cache read cache write
thinking 2 301 74,233 22,263
text 2 301 74,233 22,263
tool call 2 301 74,233 22,263
Cache read is context this request reused, and cache write is what it newly stored; both get large in a long conversation. The three lines are identical. The message's real total is 2 + 301 + 74,233 + 22,263 = 96,799. Adding the lines gives 290,397, three times as much.
That is how the record is written, and Claude Code recorded nothing extra. Every line is individually correct. The mistake is treating three lines as three calls, and you only see it when you put the line count next to the count of distinct ids.
The recount. The script is under twenty lines, and it is at the end of this post. For each file it adds every assistant line, and it also counts each message once, keeping the largest of its lines. It scans only the main record files in each project folder. Record files of subagents sit one level down and are not included; counting them too gives about 2.0 times. On the afternoon of November 8, on that Mac, it gave the 2.03, and a longer version that also counts lines and ids gave the rest:
- 17,650 record files, about 1.06 million assistant lines, about 500,000 distinct ids. That is about 2.1 lines per message.
- Adding lines gives 2.03 times the deduplicated total.
- About 360,000 messages, roughly 72%, took more than one line.
The ratio depends on how many tool calls your records hold. Taking only the 127 most recently changed files we got 1.83, and a run in early November over the latest files gave 1.95. Between 1.8 and 2.1, depending on the sample, so please do not use our "about two" as a conversion factor. Deduplicate your own records.
We checked whether the lines of one message really match. Of 1.06 million lines, only 43 differ from the other lines of their message. Taking the first line, the largest, or the last gives nearly identical totals and the same 2.03, so in the main record files you only need to deduplicate and it doesn't matter which line you keep. Subagent files are different: there the output tokens often differ between the lines of one message, so keep the largest, not the first line.
What deduplication leaves uncounted. Some ids repeat across files: a little over 10,000 of them, about 2% of the distinct ids. The script deduplicates within a file only, and we haven't looked into those 2%. The four token types are different things with different prices; we add them together only to compare how many times something was counted, so the sum can't estimate a bill. And one gap is still open. For the September comparison the other provider's dashboard showed 2.18 billion tokens in total, while we can trace about 490 million, deduplicated, in our own records, a gap of about 4 times. We listed a few possible sources, including record files that were deleted, and haven't confirmed any of them. Deduplication fixed the numbers on our side; we don't yet know how theirs are built.
Three things to do before you trust your own usage numbers. First, count two numbers: assistant lines, and distinct ids. If they match there are no repeats; if the first is clearly larger, you are counting twice. Second, count each id once, keeping the largest of its lines (in main record files any line gives the same result, but with subagent files the first line undercounts output). Third, write both totals, before and after deduplication, into the report, so that when a method changes later you can see it.
Our script:
import json, glob, os
K = ('input_tokens', 'output_tokens', 'cache_read_input_tokens', 'cache_creation_input_tokens')
naive = 0
best = {} # (file, message id) -> largest total among that message's lines
for f in glob.glob(os.path.expanduser('~/.claude/projects/*/*.jsonl')): # add subagents: projects/**/*.jsonl with recursive=True
for line in open(f, errors='ignore'):
try: d = json.loads(line)
except ValueError: continue
m = d.get('message') or {}
if d.get('type') != 'assistant' or not isinstance(m.get('usage'), dict): continue
t = sum(m['usage'].get(k, 0) or 0 for k in K)
naive += t
key = (f, m.get('id'))
best[key] = max(best.get(key, 0), t)
uniq = sum(best.values())
print(naive, uniq, round(naive / uniq, 2))
If a cost conclusion can flip in eleven minutes, you had no fixed way of counting. Pick the counting method first, write it down, and only then argue about what the number says.
Remove one member, ask again: 12 of 12.
We gave a judgment model, Jev, 12 groups of four people in short Chinese paragraphs and asked "is the cooperation in this group close?" Then we removed each member in turn and asked again. In every group, the removal that moved the reading most was the right person.
Reading the same answers against a fixed 0.5 line got the whole pattern right in 6 of 12. We had predicted 50 to 80 percent. Every miss sat in the six groups where one member was friends with everyone and the other three dealt with each other only for work. All four in, they read about 0.29, and minus one of the three, about 0.32. We had labeled both close. The judge may be right there.
The groups were assembled from components on September 26, with no human labels, and we picked the change comparison after seeing the main result.
How do you attribute a verdict to one input today?
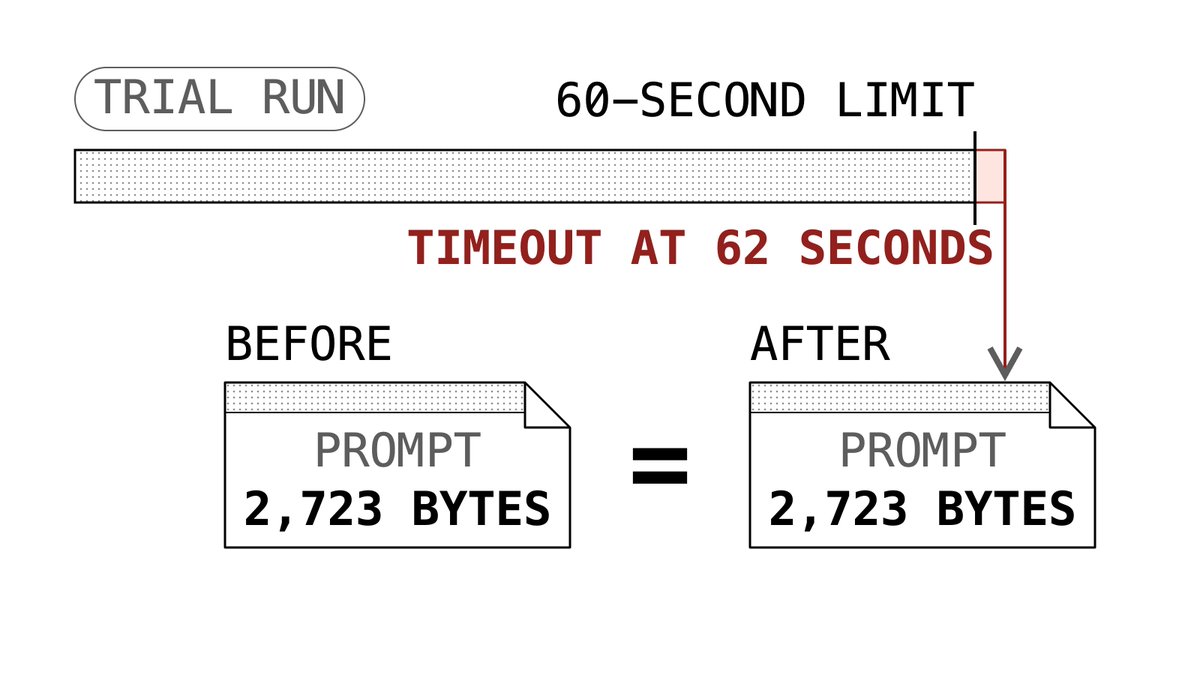
Our context step timed out at 62 seconds.
The limit was 60 seconds. On September 7 we trial-ran it on production records and one real task, with no agent launched. The step was built to assemble what one agent hands to the next. Fetching the sources used the whole 60 seconds, and it reported a timeout at 62.
The prompt fell back to the one already in use, 2,723 bytes before and after. The right behavior was to hand over nothing new. That day we switched automatic dispatch of this step off, and it was still off when we checked on October 18.
The rule we wrote: material that could not be prepared is never handed over as prepared.
List how your context preparation can fail (timeout, budget, missing source) and read what the next agent receives in each case. Can it tell which one happened?
In the minutes our 24 GB Mac reported memory pressure, the Claude Code processes were not using more memory: a median of 6.0 GB against 6.6 GB in calm minutes. There were more of them, 39 against 30.
We went in expecting the opposite. On October 19, a set of Python child processes grew to nearly 40 GB and froze the machine, and we had to force a restart. On October 24 it froze again, with about twenty background agents resident on it. So we started logging memory once a minute, to find out afterward who had filled it.
Each minute the logger writes one line: the pressure level macOS reports (normal, warning, or critical, which sysctl returns as 1, 2, or 4), the percentage of memory free, compressed memory, swap, and the number of Claude Code processes with the memory they hold in total, followed by the 15 biggest processes. At warning or above it also saves the top 30 with their command lines.
Those saved lists, from October 24 to November 7, come to 1,728 entries at warning or worse, 2 of them critical: October 26 at 22:58 and October 27 at 17:40. At the second, 17 of the top 30 processes were Claude Code, the largest was 363 MB, and all 17 together held about 2.7 GB. A 24 GB machine was in trouble and no single process was big enough to explain it.
The minute-by-minute log runs from October 31 to November 8 at 13:55: 11,732 minutes, 1,081 of them warning (9.2%), none critical. In August we logged the pressure level for an hour, and 1,604 of 1,617 readings were 2, even as the load changed. This log is a different case: 10,651 of its minutes read normal, so the level does move. The October and November logs come from this one machine over about two weeks.
The number we expected to track pressure was the memory held by Claude Code processes. In the 1,081 warning minutes its median was 6.0 GB. In the minutes with no warning it was 6.6 GB. If anything, it was a little lower while the machine was struggling.
The count of processes did track pressure. It is not the number of agents: a background agent is at least two Claude Code processes, a main process plus a terminal host that holds only a few dozen MB. We took every minute with 20 or more processes, sorted them into three bands, and counted how many minutes in each band were warning.
20 to 29 processes: 3,954 minutes, 0.5% warning
30 to 39 processes: 6,802 minutes, 8.0% warning
40 or more: 962 minutes, 54.1% warning
The last band needs care. 580 of its 962 minutes came from a single day, November 1. Without that day the band has 382 minutes and 21.5% warning. That is far below 54%, and still more than twice the band below it, which reads 8.2% without that day.
On that day, from 10:04, the system sat in warning for 239 minutes in a row, nearly four hours. Throughout, there were between 42 and 47 Claude Code processes. In the top 15 processes of each minute, the largest single process was 1,035 MB, and Python and node never passed 240 MB. No build and no multiprocessing pool showed up there. The average Claude Code process held about 170 MB. The pressure arrived when a large crowd of processes like that ran at once. We ran no controlled test, so this is two things happening together and proves nothing about cause.
Our guess for why the total looks small is that macOS compresses inactive pages when memory runs short, and the resident-memory reading of each process shrinks with it. Compressed memory had a median of 8.4 GB in warning minutes and 5.3 GB in the others, which points the right way. We haven't tested the guess on its own. If it holds, the total reads low when the machine is tightest, and it is a bad signal to gate anything on.
Now the big jobs. A production build, a Python pool, or a render each takes a lot of memory at once, and the October 19 jobs were exactly that. The nine days say nothing about whether big jobs should queue, because the bands above describe ordinary pressure. The case for queueing is the freeze, plus the next number.
Suppose each agent checked "how much memory is free?" before it started a big job. Among the minutes with 45% to 49% free there were 1,266, and 572 of them were warning. The same reading was warning in about 45% of minutes and normal in the rest. An agent that sees "47% free" cannot decide anything from it. So the line for letting a job start is the pressure level the system reports.
We had already written a small wrapper for this on October 24: heavy-run. On our Mac, a big command gets it in front: heavy-run npm run build. It does three things:
1. Lets one big job run on the whole machine at a time, using a lock directory.
2. Starts the job only when the pressure level is normal and it holds the lock.
3. Otherwise looks again every 15 seconds, waits at most 30 minutes, and exits with code 75 if it never gets in.
The decision is one line (lockdir stands for the lock directory, shortened here):
[ "$(sysctl -n kern.memorystatus_vm_pressure_level)" = 1 ] && mkdir lockdir
If the process holding the lock has died, the next one in the queue clears it. The job itself runs under nice -n 10, so it has lower priority. Waiting can outlast the two-minute default timeout of the command tool the agents use, so we run it in the background.
We made two choices here. One is to queue instead of giving each agent a memory quota. A quota means guessing how big each task will be, and a wrong guess is either a freeze or an idle wait. A queue only asks whether the machine is loose right now. The other is to read the pressure level the system reports, not a number each agent estimates for itself.
There is a cost, and it sits in the usage rules. The gate opens only at level 1, so when the level sits at 2, as it did for almost all of that August hour, a big job waits the full 30 minutes and exits with code 75 having done nothing. It then goes to another machine or runs later. Anything we expect to need 8 GB or more now goes straight to another machine instead of queueing on this one.
What heavy-run can't help with: it looks at pressure only before a job starts and stops looking once it runs. It doesn't cap the process count or how many agents run together, so it could not have helped during those four hours on November 1, when no big job was running. And not every freeze is memory. On November 7 the last record, at 21:28, said pressure normal and 60% free. Two minutes later the machine restarted. We didn't look into why.
Keep the log longer than we did. Ours deletes itself after eight days, and for October 29, which had 393 warning records, only the top-30 lists survive, so we can no longer say how many processes there were that day.
Tonight, on any machine your agents share, write one line a minute: pressure level, free percentage, process count, and the total memory those processes hold. On a Mac the level is one command, sysctl -n kern.memorystatus_vm_pressure_level. After three days, check whether your warnings follow the total or the count.
6 of 8 withdrawn dependencies were ignored.
That was the count a code comment recorded when we fixed our scheduler on September 13. Of 8 withdrawn dependencies on disk, 6 had never taken effect when it worked out which tasks could run.
Before the fix the scheduler only added up dependencies that had been created and never read the withdrawals. A task could keep waiting for something the plan no longer required. The graph algorithm was fine. It was given an outdated set of edges.
The fix made the readiness check and the longest-chain analysis use the same set of currently effective dependencies.
Test a scheduler with a plan revision, not only a fixed graph. Add a dependency, see the block, withdraw it, and check that the next scheduling decision releases the task.
Recall was 0.575. Random is about 0.555.
We merged five retrieval methods with Reciprocal Rank Fusion. On the 37 cases with labeled relevant candidates, Recall@100 went from about 0.538 for BM25 to about 0.575. The 95% interval for that gain, about -3.32 to +11.50 percentage points, includes zero.
Each case had only about 180 candidates, so a random ordering would be expected to find about 0.555 in its top 100. Both figures sit close to that. Precision at 10 was about 0.134 for random, 0.130 for BM25, and 0.108 for fusion.
The labels come from model judges, so none of this stands in for what real users would see.
Before you trust a recall gain, compute what a random ordering scores on the same candidates.
The eight files from this post. Each rule's stage is set in checks/rules.py, and checks/run.py runs the rules by stage, logs hits, and writes the baseline. The README and code comments are in Chinese:
https://t.co/hxaMC2uLbb
The first commit our new check blocked changed one word: the check's own stage.
In a practice repo, the check stopped it over 2 lines elsewhere in the repo. One was there when we installed the check. The other was written while the check was only watching. Neither line was in the commit.
This was a scripted walkthrough, run on October 19 in a practice repo, of the rule setup we publish as a template. It shows what happens when a rule goes straight to blocking: every existing violation in the repo fails at once, and the commit that switched the rule on can't go in. A rule that blocks every commit on its first day tends to get called noisy and turned off. Turning it off may be the earliest way a rule gets loosened, and the least noticed, because the rule never really started.
The practice: give every check a stage, start new ones at shadow, and switch one to blocking only on the day a person writes down what was already there.
The four stages, written next to each rule:
- shadow: when the rule finds code it covers (a hit), it writes a line to a local log, checks/hits.jsonl, and says nothing.
- warn: reports on every commit and blocks nothing.
- enforce: blocks the commit.
- retired: no longer runs. Its hit log stays.
The first three borrow from two existing designs. Kubernetes Pod Security Admission has enforce, audit, and warn modes (reject the violation; record it in the audit log; warn the user and let it through), and one namespace can run all three at once. A browser's Content-Security-Policy-Report-Only header reports violations without enforcing the policy, so you can fix them before you turn it on.
Here is the walkthrough step by step. The new rule flagged a bare except: clause, one with no exception type. In shadow it ran for two commits, logged its hits each time, and both commits went in. At warn, the commit printed 2 extra lines, each marked as a reminder that doesn't block. At enforce, the commit was blocked, and the message listed the same 2 except: lines.
The fix is a baseline. On the day a rule goes to enforce, a person runs one command that writes the existing violations into checks/baseline.txt, and from then on enforce blocks only what is outside it. PHPStan and detekt use the same idea under the same name: record today's problems, then report only new ones.
Each baseline line holds the rule name, the file, and the code on that line. It matches the code, not the line number, so a line that moves within its file still passes, and a line that changes has to pass the rule again. Agents may only delete from the baseline. Adding to it takes a person. A baseline is a different thing from an exception list: an exception list lets through a few places, each with a written reason, and a baseline lets through what was already there on the day the rule started blocking.
In the walkthrough, a person wrote the baseline (2 lines), approved it, and the commit went in. The repo's other rule, which flags requests calls without a timeout, had been at enforce since install, with 1 existing call in its baseline. When a new call without a timeout was written, the commit was blocked. With the timeout added, it went in.
What to look at while a rule is in shadow: a count isn't enough. A rule that fires everywhere and a rule that never fires can have the same defect, which is that what it reads doesn't change with the thing you care about. Say a timeout rule only looked for the word requests: it would fire on every call, with or without a timeout, and tell you nothing about timeouts. Before enforce, read every line in the hit log and decide whether each one is a real problem. Then write one example shaped like the mistake you want to stop, and check that the rule fires on it.
Retiring is the last stage, and the template treats it as loosening a rule. Each commit is compared with the version of the rules a person last reviewed, and anything that loosens them, including retiring a rule, is blocked until a person approves. The block message carries the rule's record. In the walkthrough, retiring the timeout rule printed this (translated from Chinese):
Rule requests-timeout changed from enforce to retired; it hit 2 places, blocked 1 time, most recently 2026-10-19T21:02:20
A rule with no record prints "no hit records for it on this machine". A person reads that line, then approves.
Deleting a rule that never caught anything and deleting one that blocked a commit last month look identical in a diff. The record shows what the deletion costs at the moment you make it.
Zero hits alone is no reason to retire a rule. A hard block that guards something you can't undo can go months without firing, because what it guards is rare. Before you retire a quiet rule, ask two things: is what it guards rare, and does what it reads ever change?
What this walkthrough leaves out:
- One scripted walkthrough, one toy repo, two rules. No agent took part in these steps.
- The hit log lives on one machine. A new clone starts from zero, so a team that wants a shared record needs CI to write it.
- The check runs as a git pre-commit hook, and git commit -n skips all of it, including the approval step for loosening a rule. Run the same check in CI.
Take the last check you added to a linter, a hook, or CI, and write down its stage. If it went straight to blocking, list what it would flag in the repo right now, then decide which of those you fix and which go in a baseline.
X can turn file names into links, so copy checks/rules.py, checks/run.py, and the rest from the repo linked in the first reply. If you copied checks/rules.py from our earlier post on check rules, some files here have the same names as files in that set but different content, so try this one in a separate repo.
What's the last check you turned off because it was too noisy on its first day?
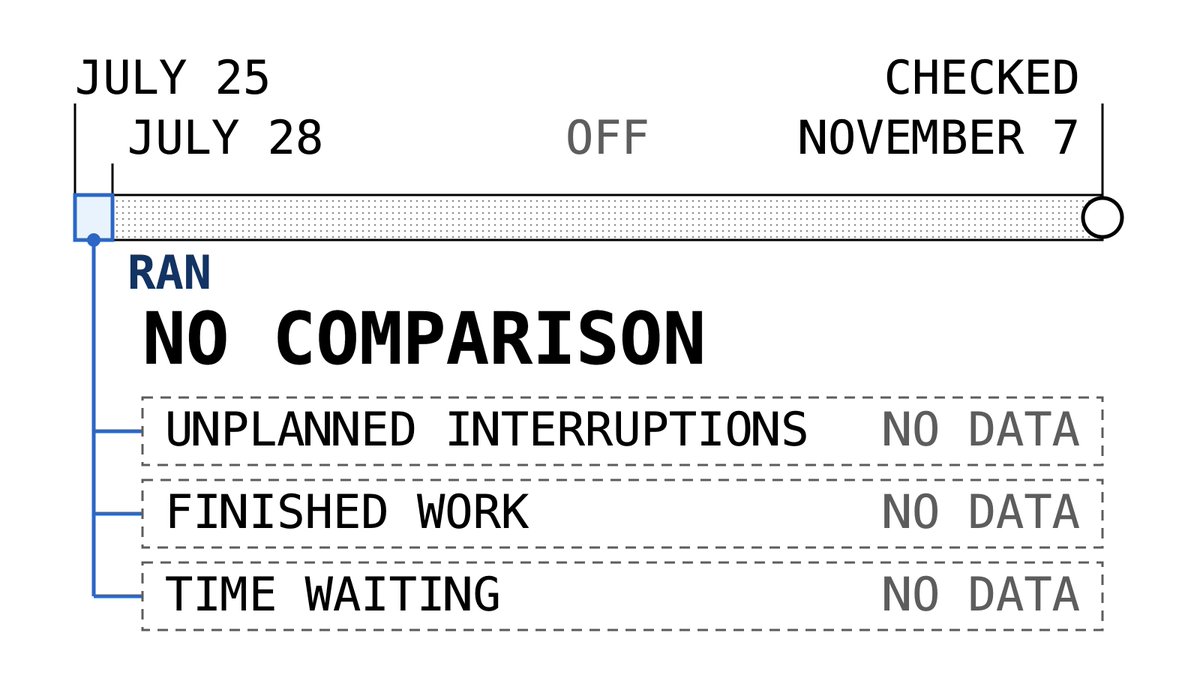
Our quota planner ran July 25 to 28, then stopped.
It reads how much of a usage window is spent, how fast it is being spent, and how long until reset. From those it works out how many agents may run, and whether to stop taking new work. On our server it ran from July 25 to 28, and its plan applied only to newly opened work. Running agents were left alone. It has been off since July 28, and the timer was still disabled when we checked on November 7.
It left no comparison of cost or quality. We cannot say whether it prevented a single interruption.
The right test is the same workload with and without it, comparing unplanned interruptions, finished work, and time spent waiting. We have none of those numbers.
Before you turn on a throttle, write down those three numbers for a baseline week.
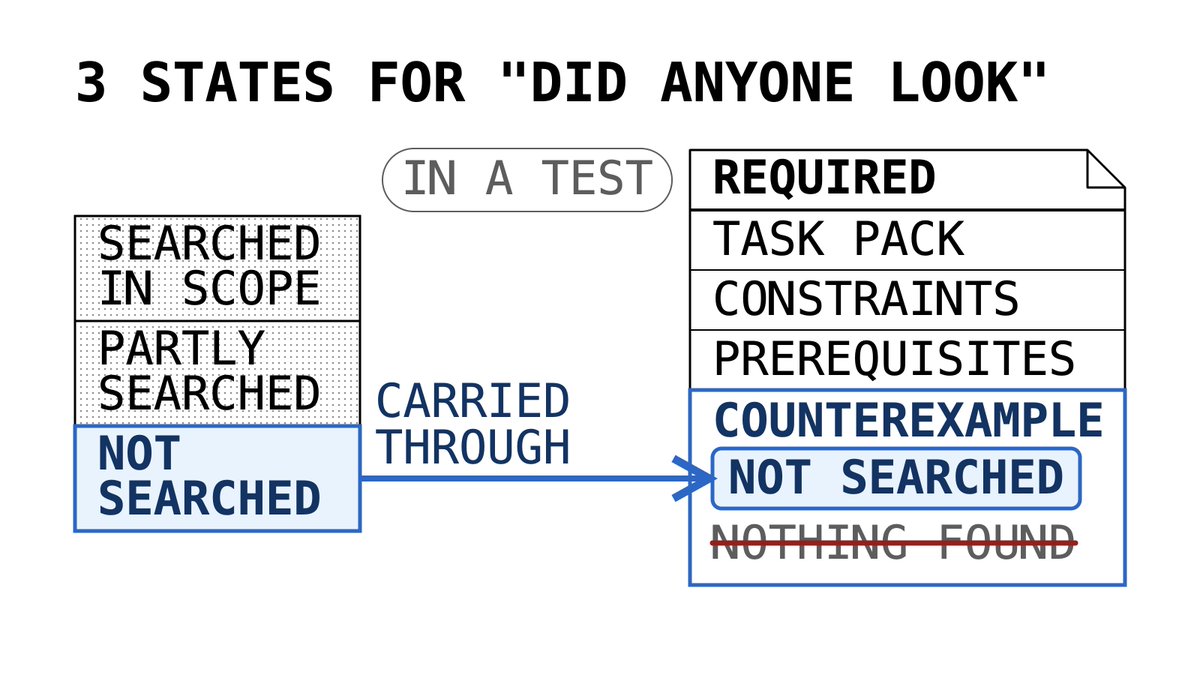
Our handoff module tracks 3 states for "did anyone look for counterexamples".
When one agent hands material to the next, the module is built to set by role what must be read. An executor needs the task pack, the user's constraints, known counterexamples, and the prerequisites. In a test, a caller marked a known counterexample optional and put it last. The module still made it required reading.
Upstream records one of three search states: not searched, partly searched, or searched within the declared scope. The module carries that state through. It does not turn "nobody looked" into an empty list that reads as "nothing found".
It can only enforce what upstream registered. On October 18 the code and tests were in place and all 72 tests passed, but the module was not switched on for automatic dispatch.
Check whether an empty list in your handoff means "none found" or "not looked".
The folders the 15 questions point to, one tested Claude Code setup each. Each folder's README says which files go where and what to do before using them. The READMEs are in Chinese:
https://t.co/pfDsW02VRA
Our system judged a background agent dead. Less than 3 hours later, it was working again.
The agent had been silent in our event log for nearly 10 hours. Our system saw that Claude Code had recorded its status as failed and that the work hadn't been delivered, and judged it dead. Less than 3 hours after that, its original conversation was picked up again with --resume, Claude Code's flag for continuing an earlier conversation, and it carried on working. We have no record of who or what ran that command.
At your desk you would have looked first. In front of you, you run checks without calling them checks: the diff scrolls past, you open the result when it says done, only one agent is editing the repo, and when it stops you can see where the terminal stopped.
When you step away, your config doesn't change and those checks just stop. Each later step (subagents, parallel agents, the background, months of running) drops another one.
We sort those steps into five levels. At each level you stop trusting one more thing and replace "trust it" with "check it". Driving automation has levels too, but in a car something takes over each job the driver drops. With agents, nothing takes over unless you install it: a hook, a script, or a fixed step.
Below are 15 yes/no questions across the five levels, each with something to check today and the folder in our repo that holds a tested setup for it. Start from level 1 even if your agents went into the background on day one. Higher checks stand on lower ones: a watcher that asks whether finished work reached main assumes that work was verified first.
Level 1: you no longer write the code. Stop trusting the agent's own account, and rules that are only written down.
1. When the agent says it's done, does acceptance go to an agent that didn't watch it write the code and can't change it? (01-independent-verifier) Today: read the prompt your last verifier got, and look for "here's how I implemented it".
2. Does your delete guard recognize what is being deleted, not how the command is written? (03-guarded-delete) Today: in a scratch repo, deny a folder of fake files and ask Claude to delete it with one line of Python. It counts only if the folder survives.
3. For every "must" and "don't" in CLAUDE.md, can you say what enforces it? (04-rule-tiers) Today: mark each one always loaded, loaded on demand, or hard-blocked.
4. Are your red lines somewhere that loads every time, CLAUDE.md or a hook, not left for the model or a file path to load? (04-rule-tiers) Today: search your Skills and path-scoped rules for "never" and "forbidden".
5. Does the agent stop to ask you only about direction, things that can't be undone, and conflicts with what you told it? (06-one-way-doors) Today: of the last ten times it asked, count how many fall outside those three.
Level 2: you no longer give every instruction yourself. This starts with your first subagent or first context compaction. Stop trusting what is relayed: numbers in a summary, and "the brief is clear". It reads clearly to you because you know the background.
6. After compaction, does a script recompute the test count, changed files, and current branch, instead of trusting the summary? (07-handoff-recompute) Today: after a compaction, ask how many tests there are, then run them yourself.
7. Does a subagent brief give the goal, what done looks like, what's hard, and what's easiest to get wrong, and does an agent with no background read it before it goes out? (07-handoff-recompute) Today: count how many of the four your last brief had.
Level 3: you no longer set the order. This starts when two agents edit at once. Stop trusting "git merge will catch conflicts". Git flags only changes to the same place. One agent changes a registry, the other writes a test that goes around it, git merges cleanly, and the system breaks after the merge.
8. Before two agents start, do you write down the files each will change, wiring points and tests included, and keep overlapping tasks apart? (05-file-claims) Today: check whether anyone wrote and compared those lists before your last parallel run started.
9. Before merging back, do you check whether main changed those files since the work began? (05-file-claims) Today: check whether anyone looked at main's changes before your last merge.
Level 4: you aren't there. This starts when you leave an agent in the background and walk away. Stop trusting silence, heartbeats, and "a retry will fix it".
10. When a background agent goes quiet, do you check whether its transcript is still being written, whether its workspace has half-finished work, and whether its process exists, before you touch it? (the agent at the top) Today: for the last "stuck" agent you restarted, check whether anyone looked at those three first.
11. Does your monitoring watch output, meaning whether finished work reached main, and not only the heartbeat? (02-output-watch) Today: list unmerged branches and the age of each one's last commit.
12. If a watcher stops, will something tell you? (02-output-watch) Today: ask of each watcher what it looks like once it has stopped.
13. Before a failed task is retried, does something check what this attempt has that the last one didn't? (08-retry-gate) Today: compare the inputs of your last retry with the attempt before it.
For question 10, never treat "don't know" as "dead". Judging an agent dead only means its work needs someone to pick it up. The original may still come back, as ours did.
Level 5: you can't remember. This starts when the same kind of bug comes back, or CLAUDE.md gets longer than anyone reads. Stop trusting "that's already fixed" and "every rule we added does something".
14. When you fix a bug, do you first write a check rule that catches the whole class, then prove it fires on a new example? (09-fix-the-class) Today: look for a check rule in your last bug-fix commit.
15. If a "must" in CLAUDE.md gets changed to "should", will something stop it for a person to look at? (10-rule-lifecycle) Today: count the "must" and "never" lines that went away in the last few changes to CLAUDE.md.
How to use them. Your level is the furthest step you've taken: subagents or compaction is 2, two agents at once is 3, a background agent you walked away from is 4, a bug class that came back or a CLAUDE.md nobody reads in full is 5. Otherwise you're at 1.
Then answer from question 1 down and stop at the first no. One exception: question 2 guards things you can't undo, so if question 1 is a no, answer question 2 too, and if both are no, fix both first. If the first no sits at your level or below, fix it before going on. If it sits above, your checks still cover what you've handed off so far; fix it before the next step back.
Our view: get a yes on every question at one level before you step back to the next.
The costs. Once finishing requires a verifier's verdict, even a one-line README edit gets stopped once. A throwaway script or a prototype doesn't need even level 1 in full. And lots of yes answers only mean these checks exist. This list doesn't cover cost control, storage, or read performance.
About the agent at the top: the "less than 3 hours" and the --resume come from a process listing noted the next day. The raw output is gone.
To start today, write down your first no.
X can turn file names into links, so open each folder from the repo linked in the first reply instead of copying names from this post.
Which question was your first no?
Step 5 was rejected. The next 24 steps were recorded.
In a research prototype, language models play several parties and draft plans. A checker applies each step to a copy of the ledger, and a step that fails is dropped. In one run a referral had one slot in the ledger. Step 4 gave it to one party and step 5 to another. Step 5 was rejected and the 24 steps after it were recorded as usual. The referral stayed with the first party, and nothing went back to reassign it.
We chose to reject a single step, so one over-allocation does not void the plan. The cost is that the rejected party gets no alternative, and the checker does not decide who should. The slot count of 1 is a prototype default the models never see. Across 38 runs and 603 steps, 92 were rejected, and only 2 were over-allocations.
If your checker rejects one step, write down who is meant to notice the gap it leaves.
Made-up data: an index lookup returned 5 of 7 events, no error.
Say seven events belong to one task, and the two oldest have moved into cold archive. Our event index reads only segments that are not archived, so a lookup by task through the index returns the other five. There is no error and no warning, only a smaller number. A comment in the index code says so, dated July 31.
The archived events are not deleted. A lookup by a single event ID does go to the archive, and a command-line task query scans the archive too, at the cost of parsing all of it each time. We left the archive out of the index on purpose. A duplicate check at commit time reads the index, and adding old events would change what it accepts or rejects.
If you archive old records, run one query that should hit both sides and compare its count with a direct count. A smaller number may be the only symptom you get.
The verifier's instructions from this post, in the version our last three runs used. Step 2 holds the three example breaks. The hooks and scripts that go with it are two folders up, in 01-independent-verifier. Its README is in Chinese:
https://t.co/W59aTNm7e7
11 verifier subagents we ran in Claude Code had return None listed in their instructions as a break to try. None tried it.
Every one of them flipped a condition. When one changed a return value, it changed it to another number, such as return 1. The verifiers in the three runs after those flipped a condition too, and none tried return None.
The setup: Claude Code 2.1.293 background agents on Sonnet, a small Python todo CLI, and a read-only verifier subagent that the main agent sends to check its work. The verifier's instructions say to copy the repo to a temp folder, break each changed line one at a time "(flip a comparison, return None, drop a branch)", and confirm that every break turns at least one test red. Which breaks to make is up to the verifier.
Why return None mattered in this app: the entry point runs the command and returns its result or 0. So a command that returns None exits with code 0, the same as one that returns 0.
Before the verifier picked its own breaks, we used a mutation script with fixed classes, applied to the changed lines only: comparisons, +, True/False, and return x turned into return None. In two runs, Claude added a command (stats, then count) with a test that checked the command's return value only through the entry point, main([...]) == 0. Both times the script turned the command's return 0 into return None, the tests stayed green, and the verifier failed the work. In the stats run, Claude added one line to the existing test, assert cmd_stats([]) == 0, and the second verdict passed. The count run went the same way.
Then we moved to a shorter setup, where the verifier makes the breaks itself. In the first run of that setup, Claude added a count command again, with the same kind of test. The verifier made 6 breaks: it flipped the filter, changed a 1 to a 2, made the command return 1, swapped the filter for a plain length, deleted the command's registry entry, and pointed that entry at the wrong function. All 6 turned the test red, and the verifier passed the work.
return 1 is caught by == 0. return None is swallowed by or 0, and the verifier never tried it. Going by the two earlier runs, the script would have failed this change. That last part is our inference; we didn't rerun it.
Don't leave the choice of breaks to the verifier alone. Put the classes you care about in a script that tries each one on every changed line, and let the agent add its own on top.
The script and the agent each earn their place. In that run, the agent's 6 breaks included kinds the script's rules can't produce, like deleting a registry entry. By our count, the script's rules would have made 1 break on that change, the return None one, and it would have survived. The agent goes wider. The script is steadier: it tries every fixed class on every line, and the agent misses whatever kind it doesn't think of.
Mutation testing tools already do what the script does. mutmut for Python and Stryker for JavaScript change everything they can across the whole codebase by default, and a run takes a long time. For an acceptance check, the lines the agent changed are the ones that matter most.
One more call the verifier made on its own. In a later run it made 10 breaks, and one left the tests green: it deleted the or 0 itself. It judged that an equivalent mutation, a change that doesn't change behavior, and passed the work. It was right, because every command returns an integer. Its instructions, though, said every break must turn a test red, so it ruled outside them. If you allow equivalent mutations, say so in the instructions, and ask for the reason in the evidence.
What this does not show:
- One toy repo, one model, one Claude Code version.
- Whether instructions that require every listed class on every line would change the picks. We didn't test that.
- Whether this gap mattered to a user. From the command line, None and 0 both exit with code 0, so you can argue the return None break is equivalent too. The test still couldn't see what the command returned.
- How often agents skip a class on real code. We counted 14 agents on one small app.
Open the evidence in your last few verifier or reviewer verdicts and list the kinds of break they actually made. If a kind your instructions name never shows up, move it into a script.
X can turn file names into links, so copy the verifier's instructions (.claude/agents/verifier.md) from the repo linked in the first reply.
Which kind of break do your review agents never try?
44 of 45 stop verdicts on our published briefs said "enough".
Before an interview becomes a design brief, an evaluator agent checks four required premises, scores four quality dimensions, and recommends one of three outcomes: enough, conditionally enough, or still not enough.
From June 1 to September 23, 80 interview briefs were published, in the records we can read. 46 carried the evaluator's verdict, and 45 of those recorded a conclusion: 44 enough, 1 conditionally enough. The other 34 skipped the evaluator and had the four checks computed mechanically.
A "still not enough" verdict blocks publishing, so none can appear here. And we have no comparison with human judgment. So 44 of 45 shows what got through, not whether the verdicts were right.
Look at your own stop rule, whether a turn count or a score, and count how often it has said "not yet". Then check a few past cases by hand.