We try to help investors of any kind understand what’s driving markets and what could come next by making institutional research frameworks more accessible.
The October 1, 2026 Treasury curve raises an allocation question: how much extra rate exposure is the yield pickup worth?
This guide connects that choice with what happens when corporate spreads move against the rate view.
• Where extending maturity adds yield
• How real yields changed alongside nominal yields
• What a rate rally can leave exposed in a credit portfolio
The guide works through those comparisons before turning to position size: https://t.co/bl1Lsm3OCo
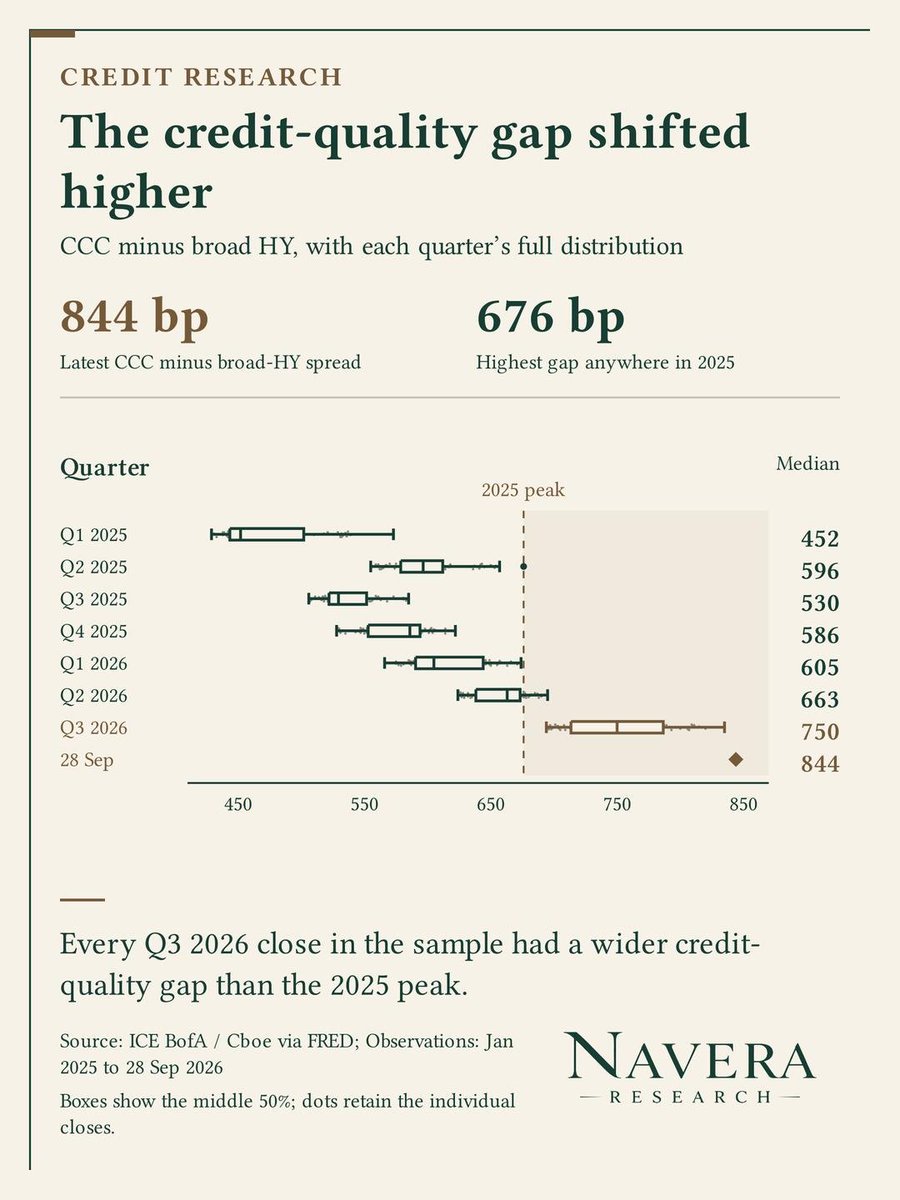
At a 302 bp broad-HY spread, CCC reached 1,146 bp on 28 Sep 2026.
Earlier periods with similar headline credit conditions had substantially narrower CCC spreads.
• 141 earlier closes had HY spreads within 5% of 302 bp.
• Their median CCC spread was 885 bp, leaving a 261 bp difference.
• Their 90th-percentile CCC spread was 946 bp, still 200 bp lower.
• The CCC-HY gap reached 844 bp, above the 676 bp peak recorded in 2025.
The unusually large weak-credit premium remains visible even at comparable broad-HY levels.
A stable headline spread would not fully capture this deterioration.
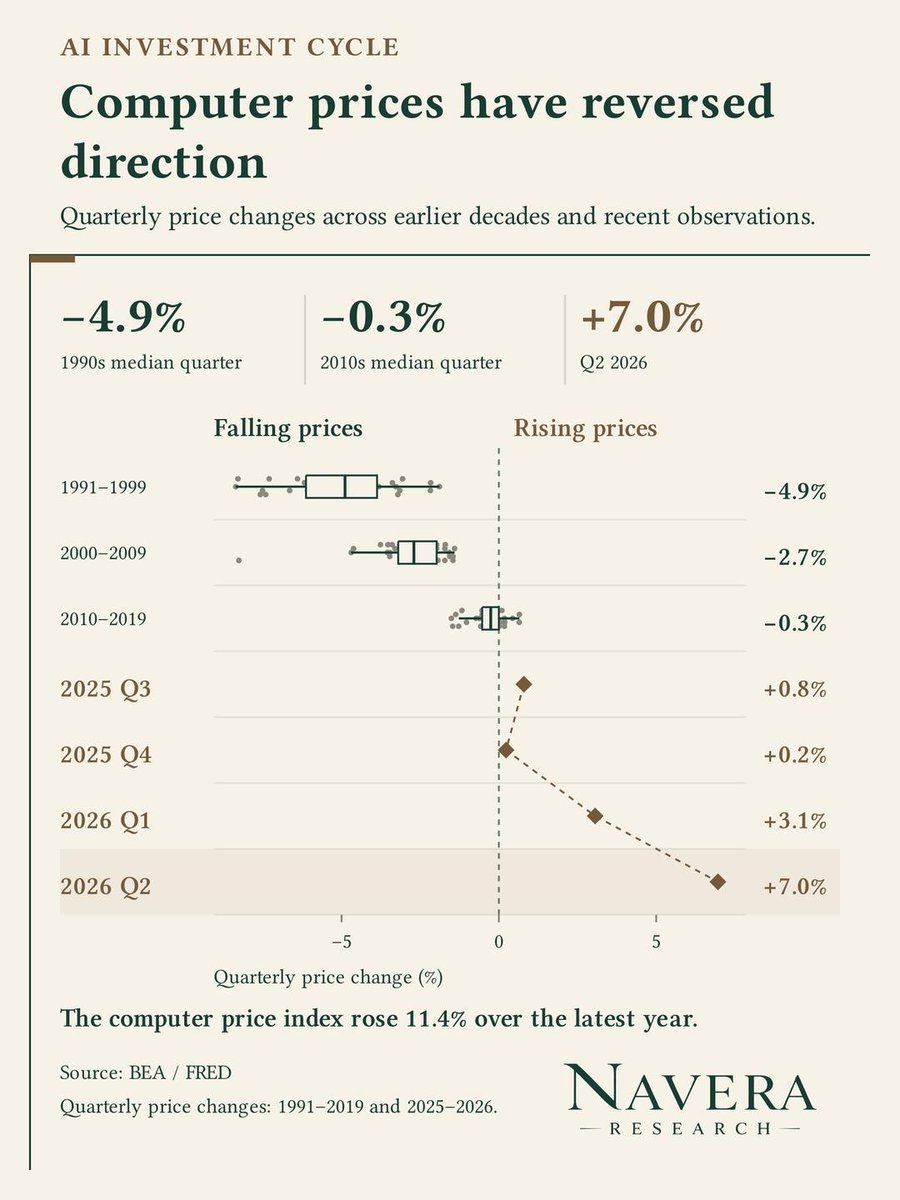
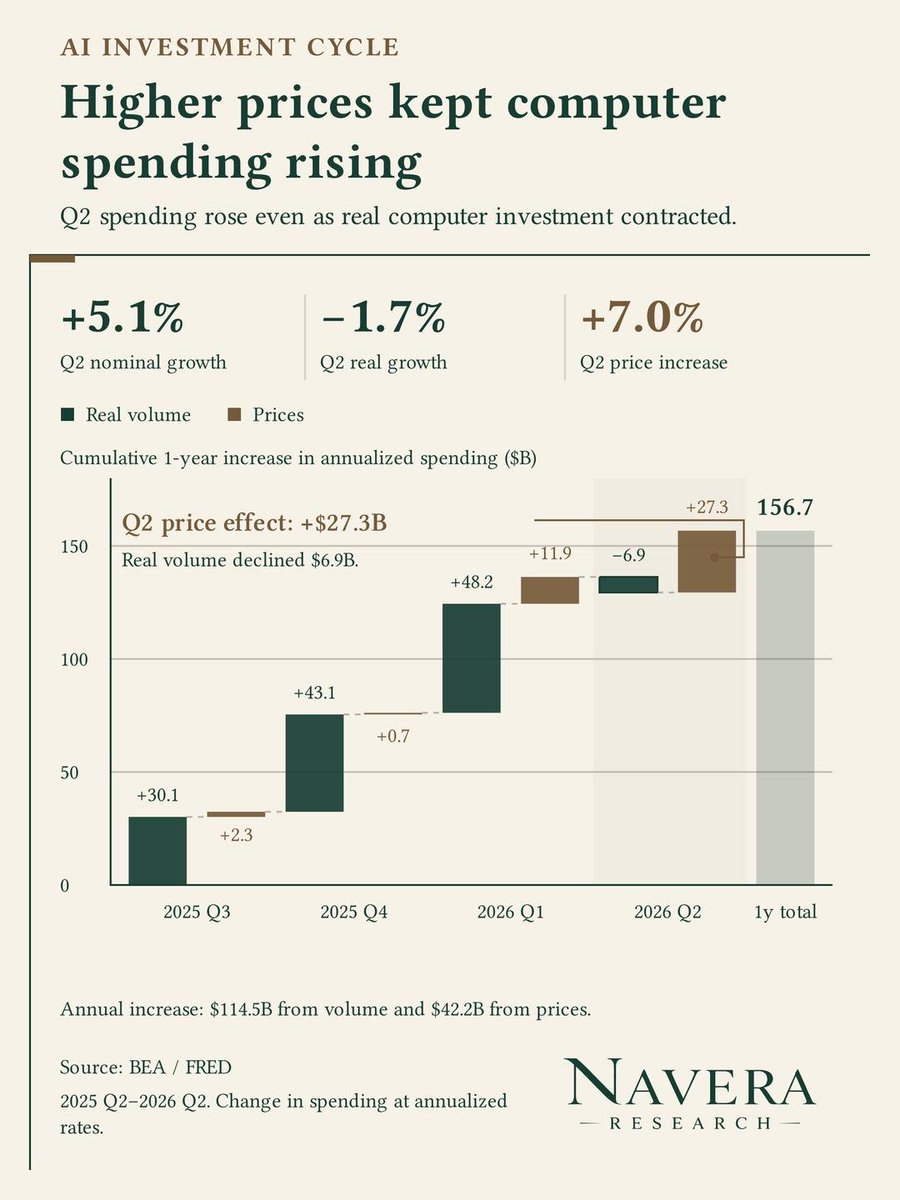
The computer category carrying part of the AI buildout grew in dollars but contracted in real terms in 2026Q2.
Higher prices explain more than the entire increase in nominal spending.
• Nominal investment: +5.1% quarter-over-quarter
• Real investment: -1.7% quarter-over-quarter
• Computer price index: +7.0% quarter-over-quarter
• Volume effect: -$6.87 billion at an annualized rate
• Price effect: +$27.33 billion at an annualized rate
The resulting nominal increase was $20.46 billion annualized rate.
Real investment remained 43.3% above a year earlier despite the quarterly decline.
U.S. macro tape is splitting in a way that matters for rates. August PCE came in cooler than feared, but today’s factory data say the inflation problem has moved upstream rather than disappeared.
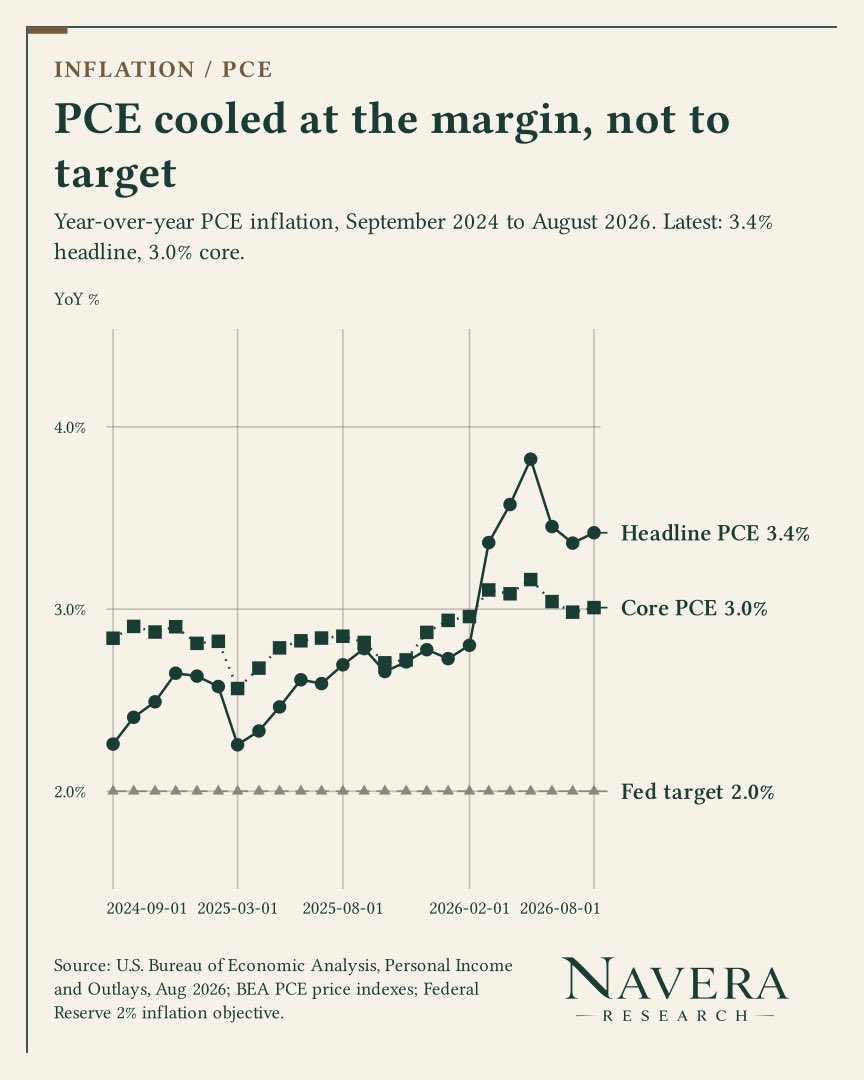
- Headline PCE was 3.4% YoY and core 3.0%, both 0.3 pp below consensus; consumer spending still rose 0.9% MoM.
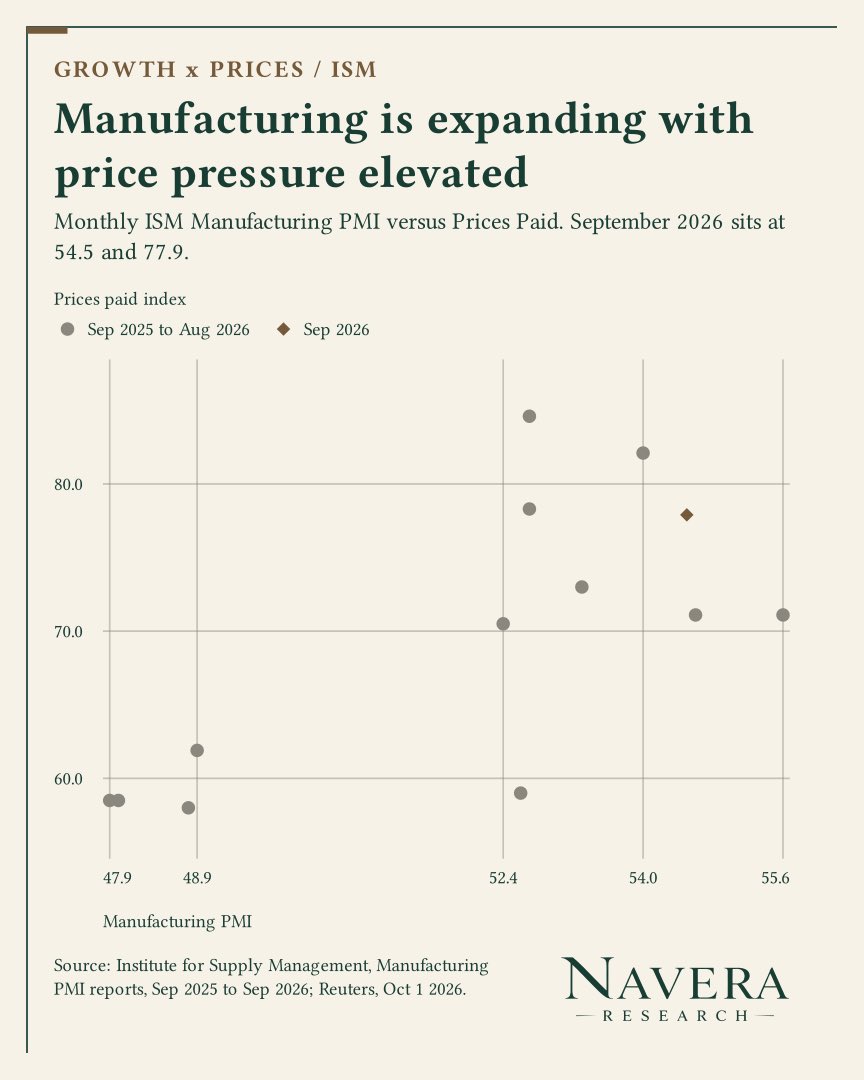
- ISM manufacturing held at 54.5, with new orders at 55.3 and employment at 52.7. Demand is expanding, not collapsing.
- ISM prices paid jumped to 77.9 from 71.1, reversing recent easing in factory input costs.
- Claims were 197K, continuing claims 1.701M, and Q2 GDP was revised to +2.2%. hard-data floor remains firm.
Cleaner read is disinflation at consumer level without a corresponding demand break.
That buys time at the front end, but 77.9 prices paid is number that keeps the long end like $TLT and in general $RSP in tension.
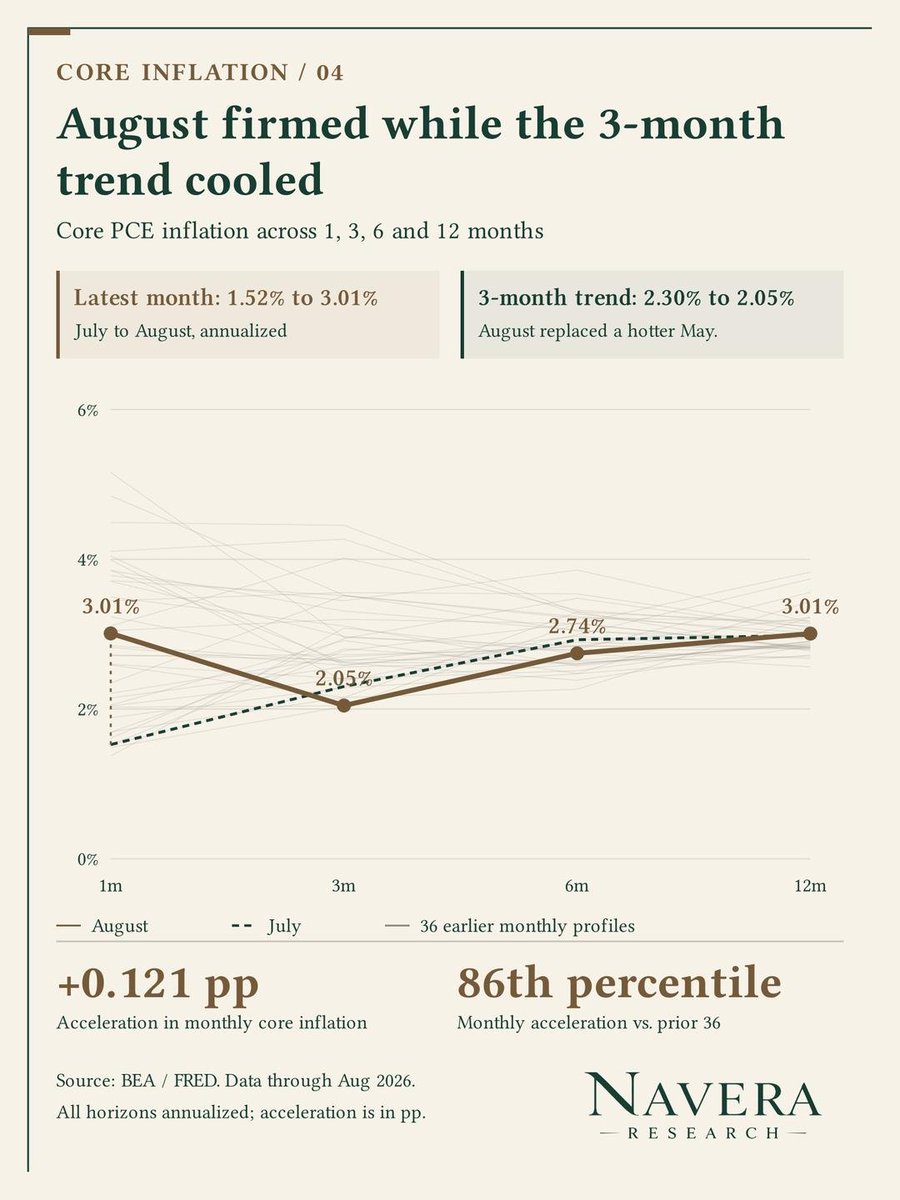
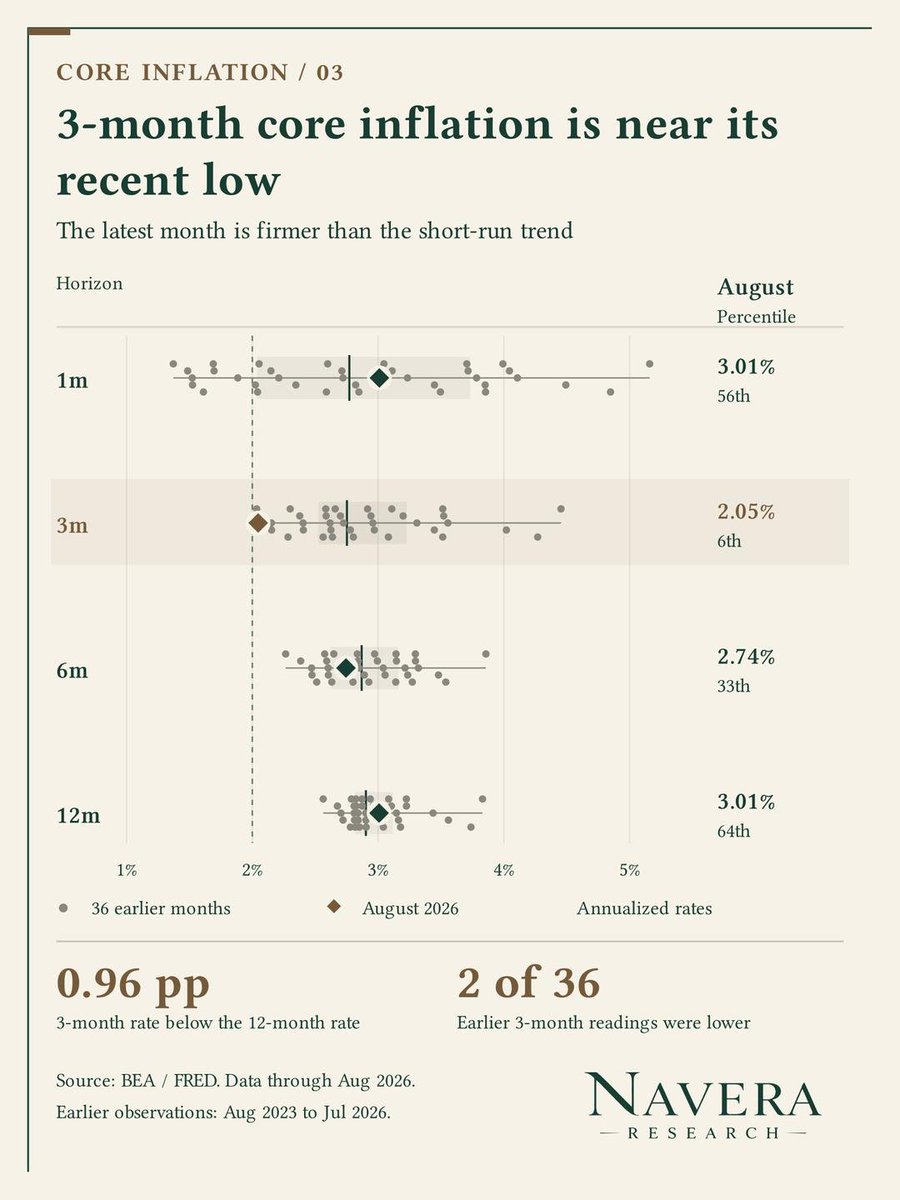
August core PCE inflation accelerated even as its 3-month trend cooled.
The 2 moves came from different comparisons, and both matter for the demand outlook.
• Core prices rose 0.247% in August, after 0.126% in July. The 0.121 percentage-point acceleration exceeded 31 of the preceding 36 monthly changes in the inflation rate.
• The 3-month annualized rate fell to 2.05% from 2.30%, the 3rd-lowest reading across 37 months.
• August replaced May's 0.310% increase in that 3-month window. August was firmer than July, but smaller than the month dropping out.
• The latest month annualizes to 3.01%, matching the 12-month pace. The 6-month rate was 2.74%.
The short-run disinflation trend remains intact, but August's monthly pace is no longer as soft as June or July.
Further firm monthly readings would make the 2.05% trend harder to sustain.
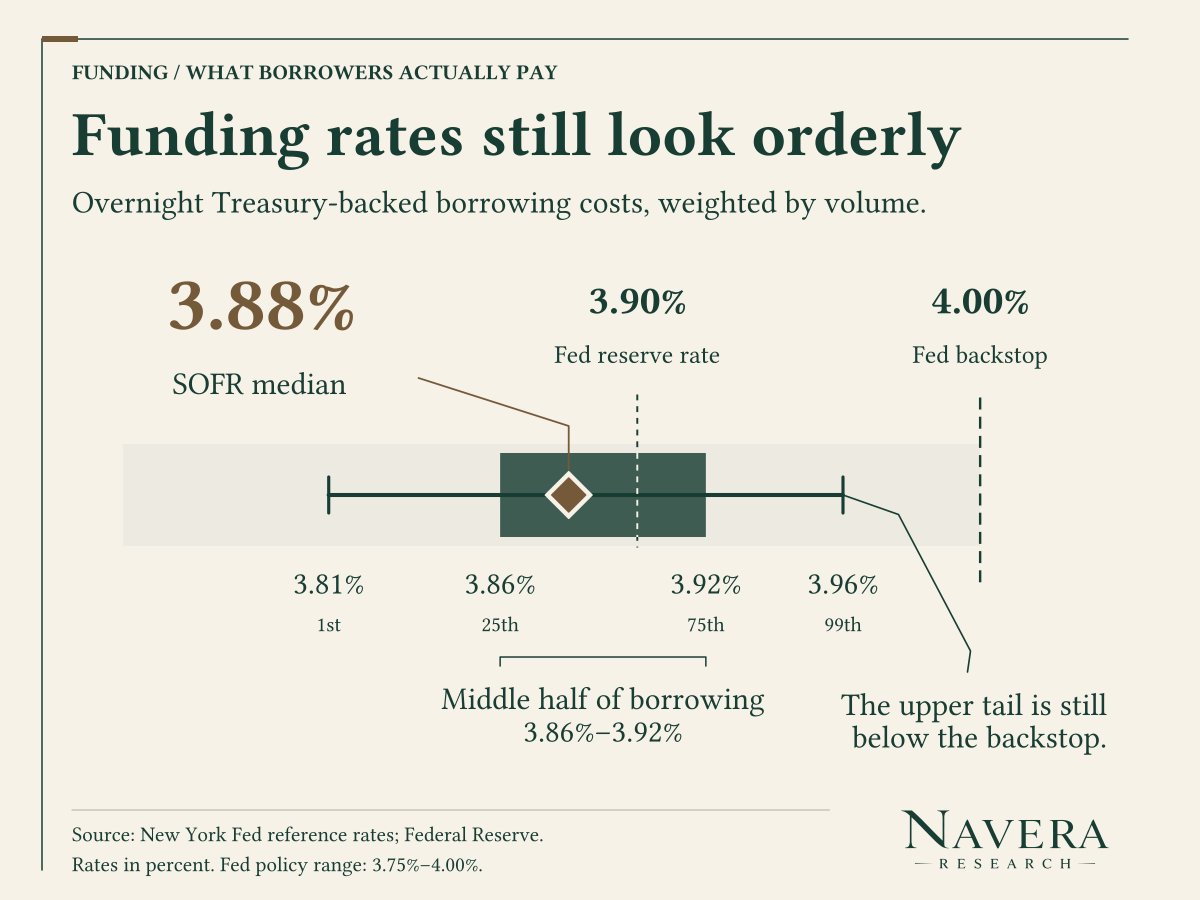
Bank cash fell, but funding is still orderly.
• Reserves: -$83.6B, -2.8%
• Treasury cash: +$100.1B
• SOFR: 3.88% vs Fed reserve rate: 3.90%
• 99th-percentile repo: 3.96% vs 4.00% backstop
The drain is real. Funding stress has not confirmed it.
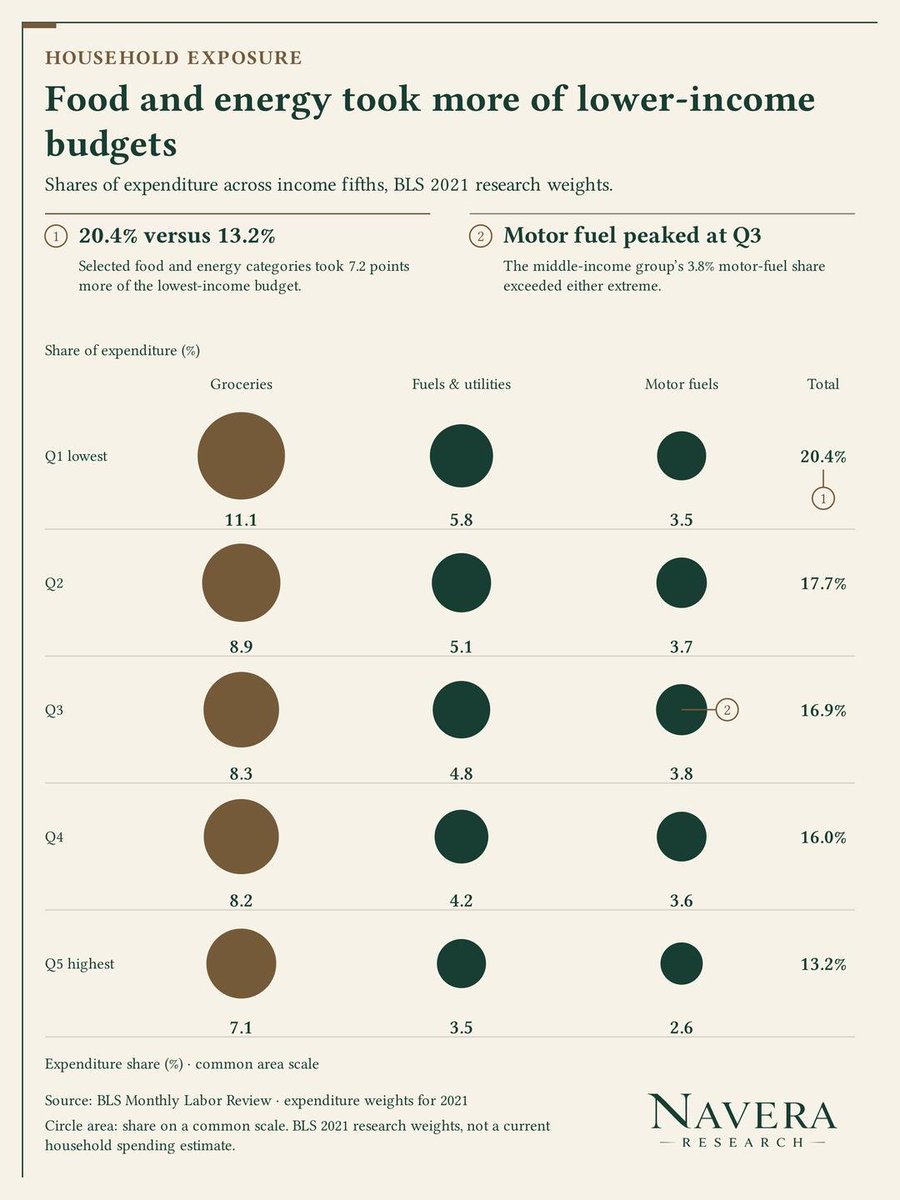
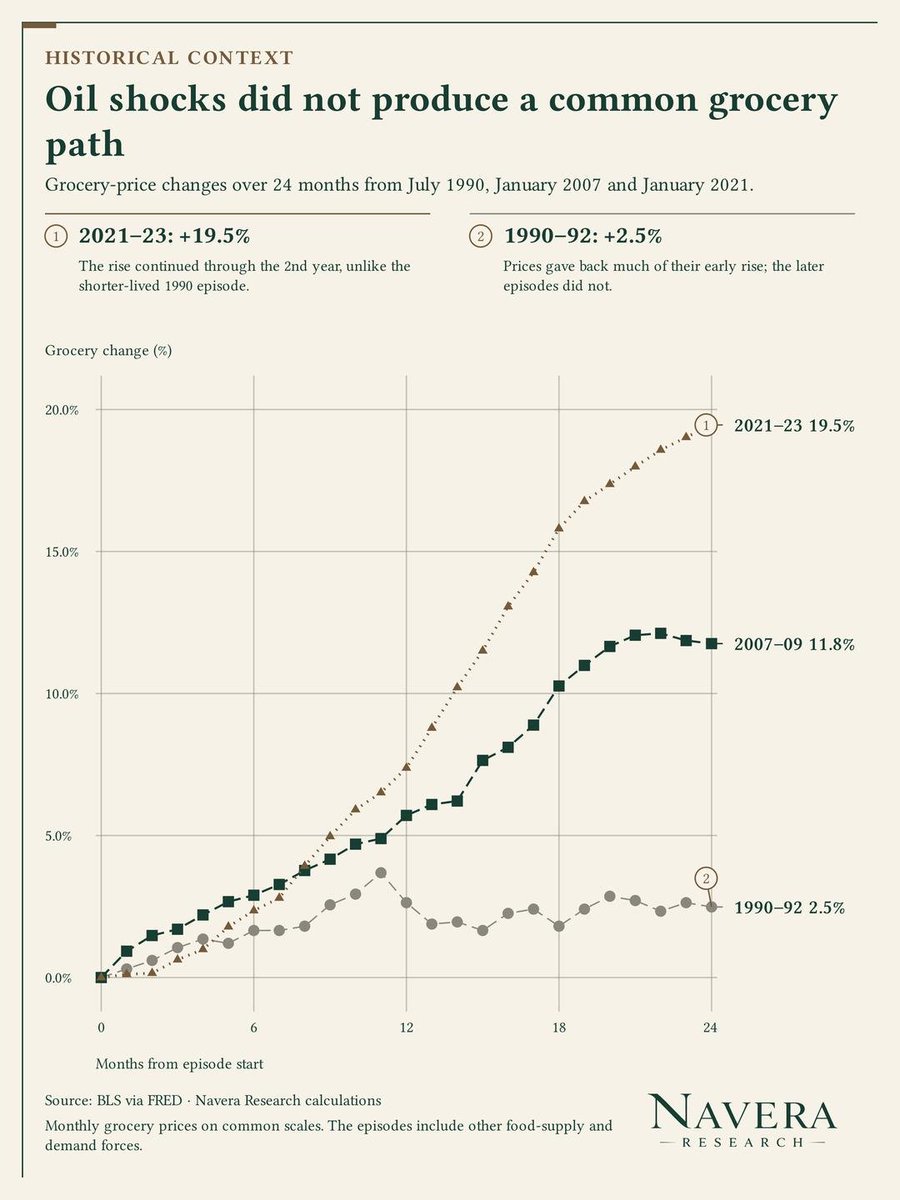
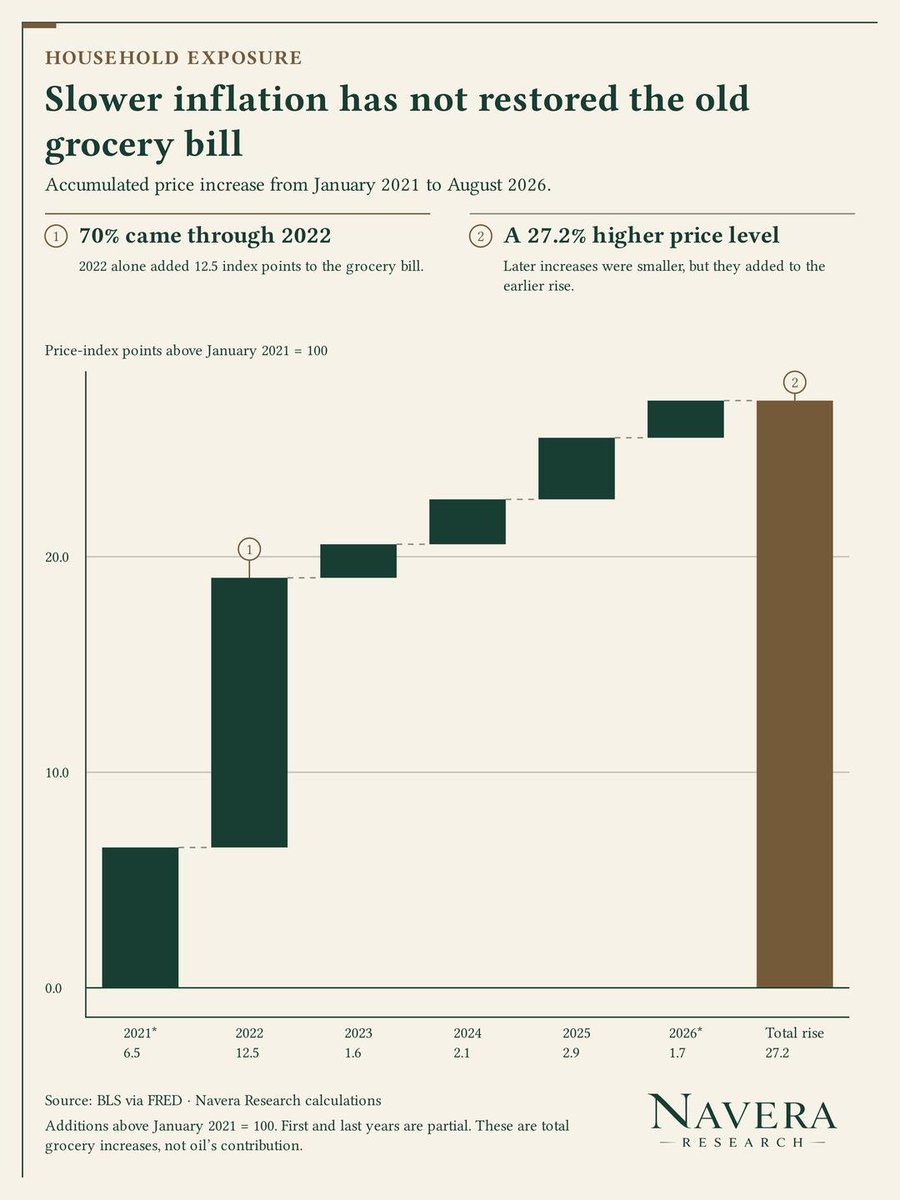
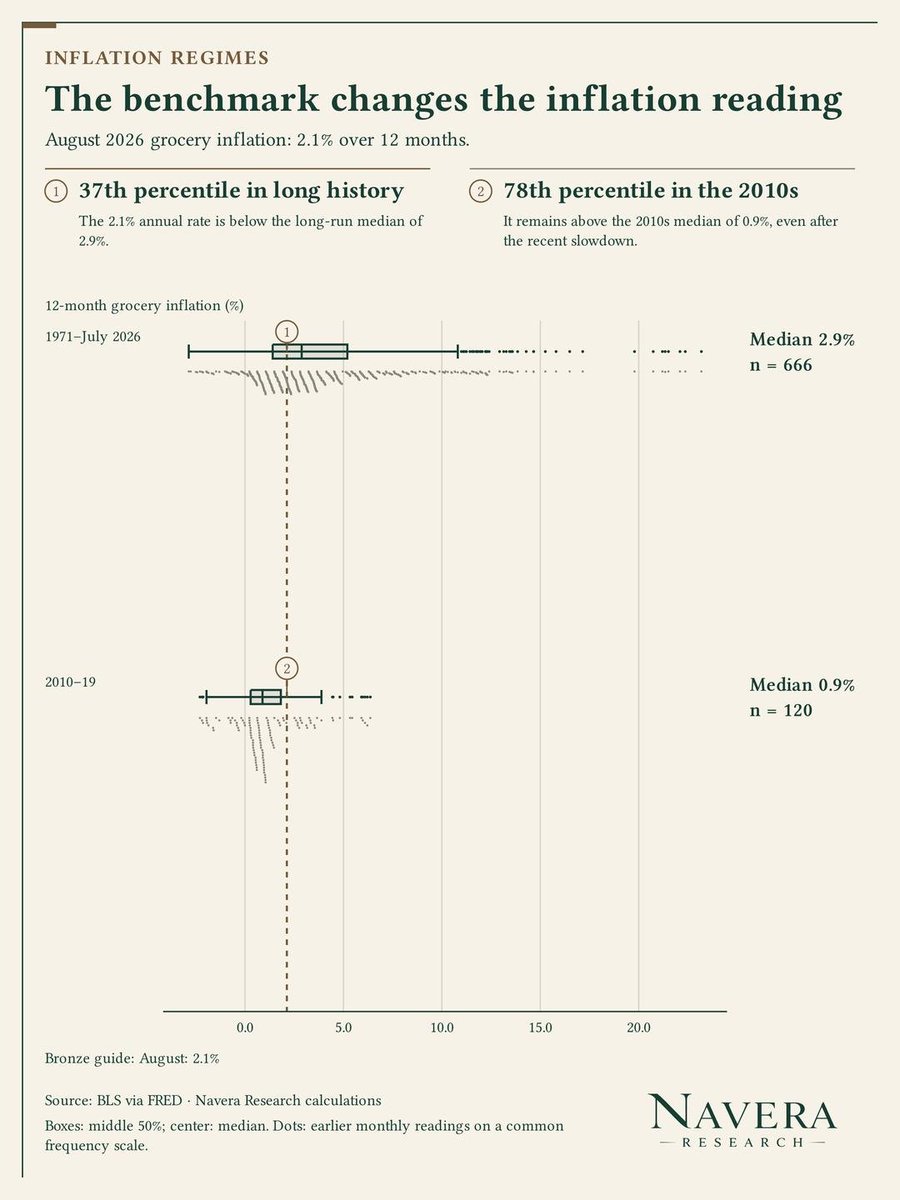
Grocery inflation has slowed to 2.1%. The bill has yet not come down.
Our guide separates new increases from the level in place:
• How much of the 2021 to 2023 rise remains
• Which budgets carry food and fuel together
• What that means as energy rises
Read it here: https://t.co/wfhDyQnyuo
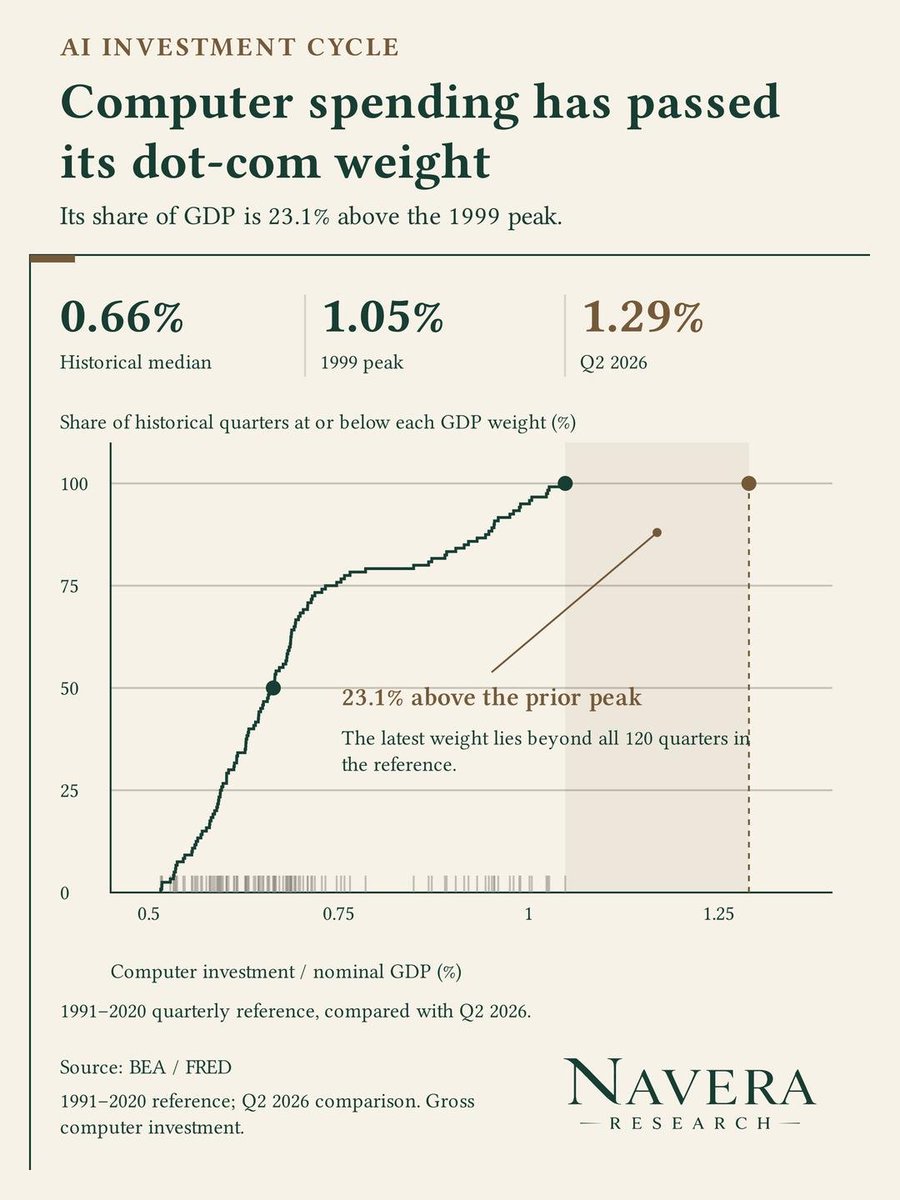
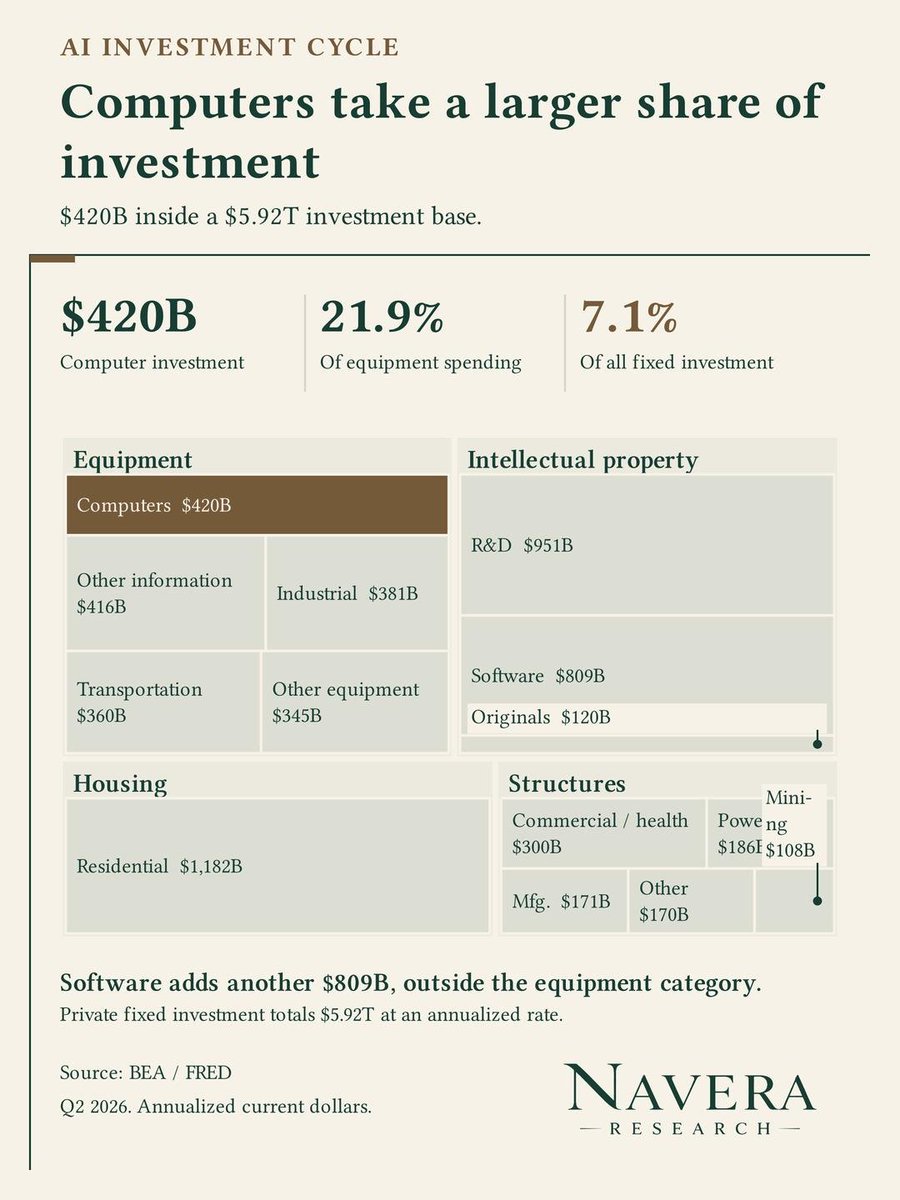
Computer investment now has more economic weight than it did at the dot-com peak.
GDP share is a better scale measure than a record dollar total.
• $420.1 billion at an annualized rate in 2026Q2
• 1.29% of nominal GDP, versus 1.05% at the 1999Q2 benchmark high
• 23.1% above that earlier GDP-share peak
• 21.9% of business equipment investment
• 7.1% of total private fixed investment
AI investment also reaches software and construction.
The buildout's economic footprint extends beyond the computer-equipment category.
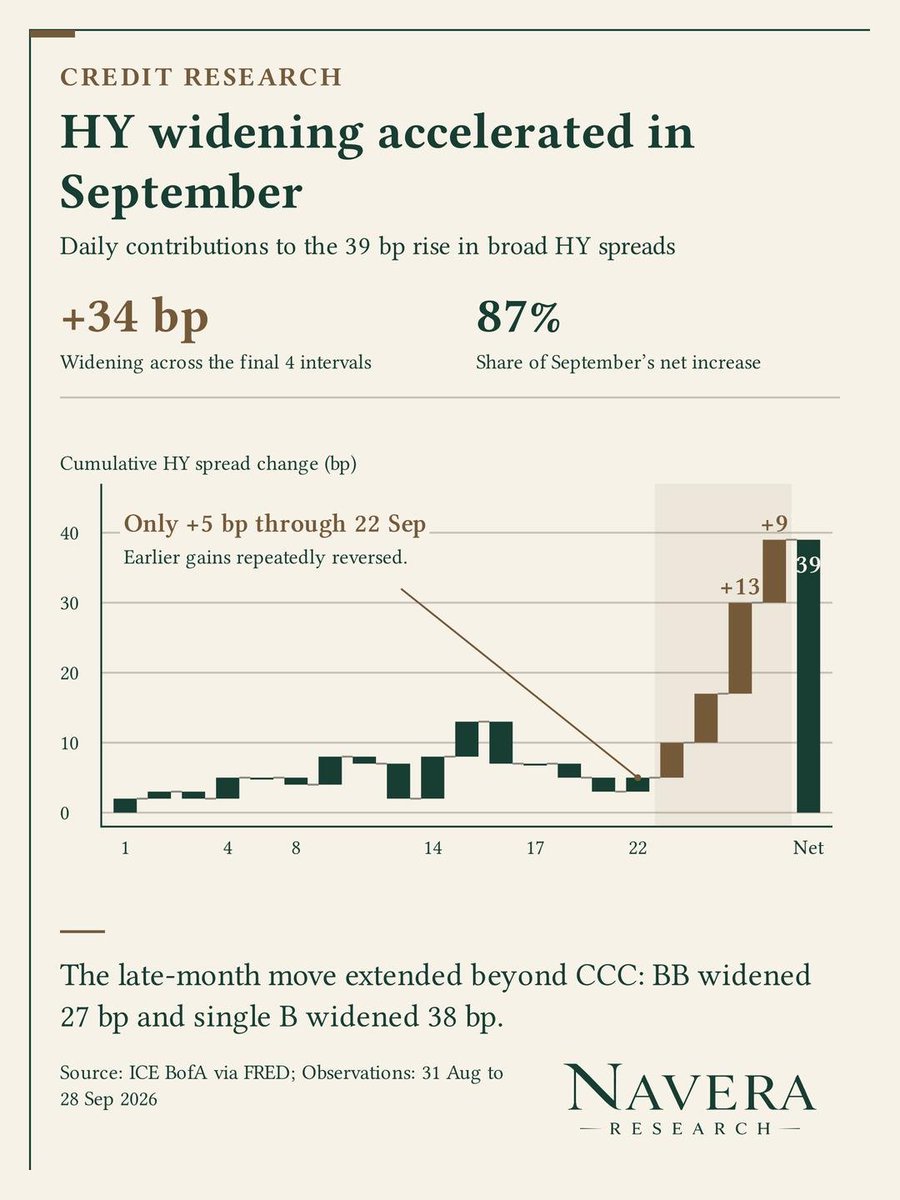
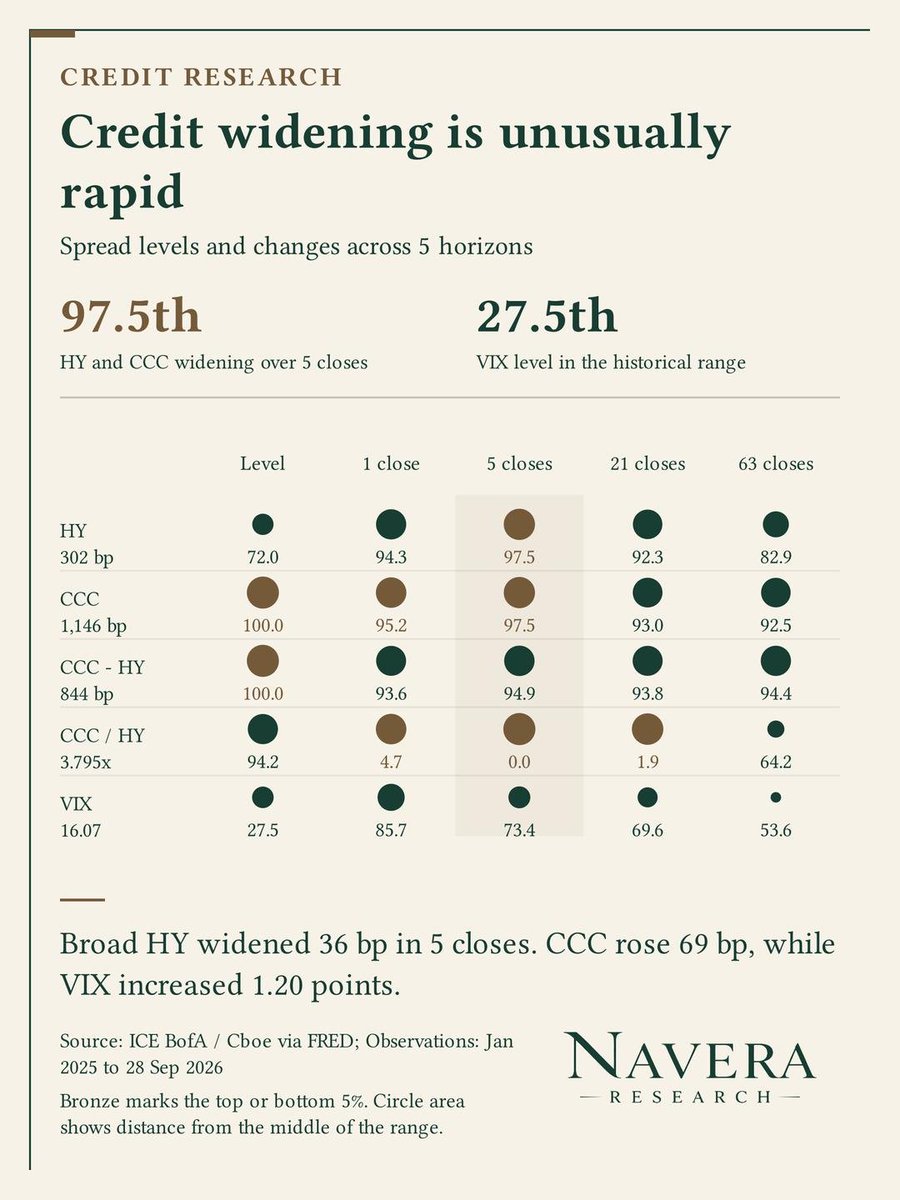
Broad high-yield spreads rose 45 bp in September through the 29 Sep 2026 close.
89% of that increase arrived after 22 Sep, with stronger rating tiers widening alongside CCC.
• HY widened 40 bp over 5 closes, above the 97.5th percentile of earlier 2025-2026 moves.
• CCC widened 82 bp over the same window, also above the 97.5th percentile.
• Late-month widening reached BB at 27 bp and single B at 45 bp.
• VIX stood at ~16 intraday (roughly the 27th percentile of its 2025-2026 range).
The acceleration extends beyond the weakest borrowers.
Participation across rating tiers now carries more information than the headline HY spread alone.
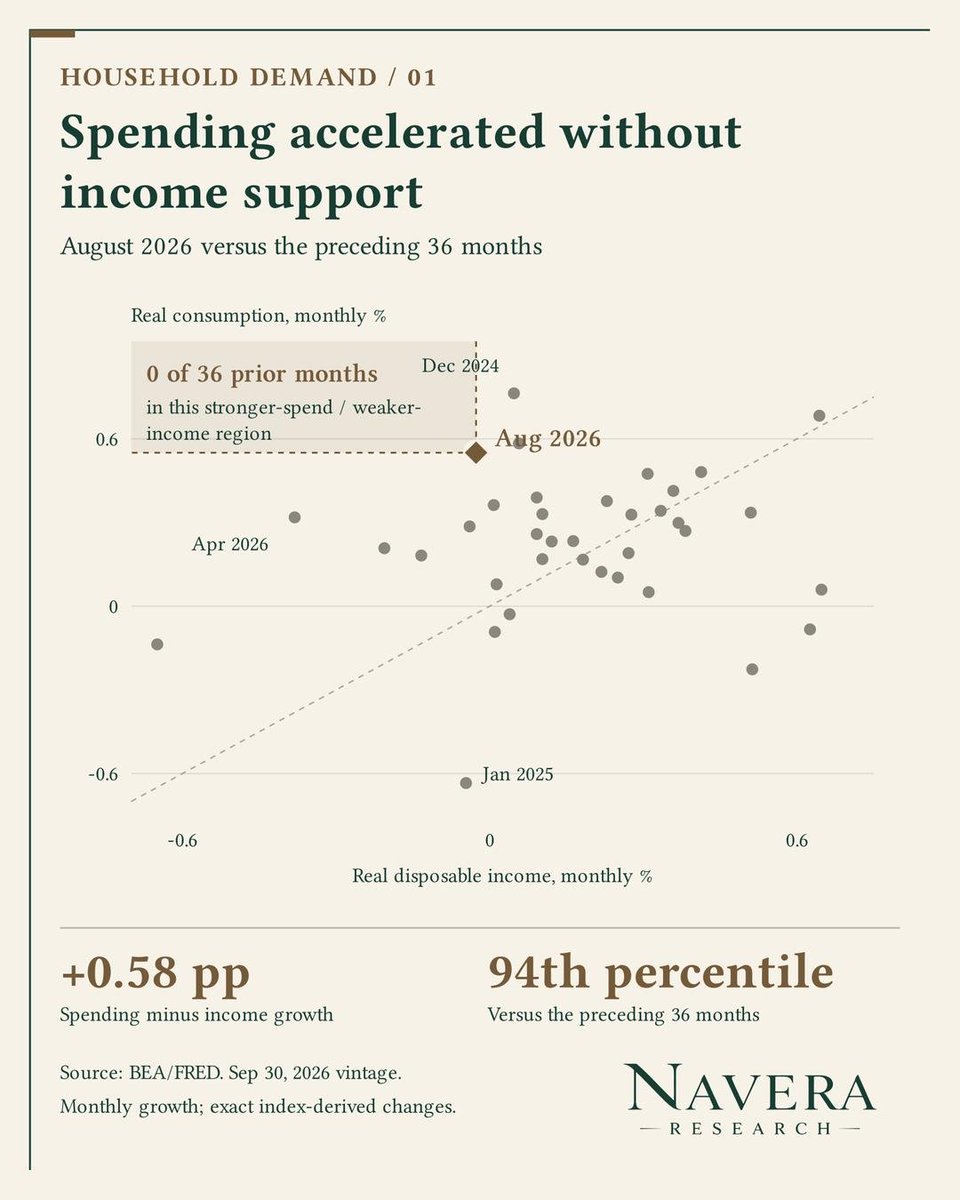
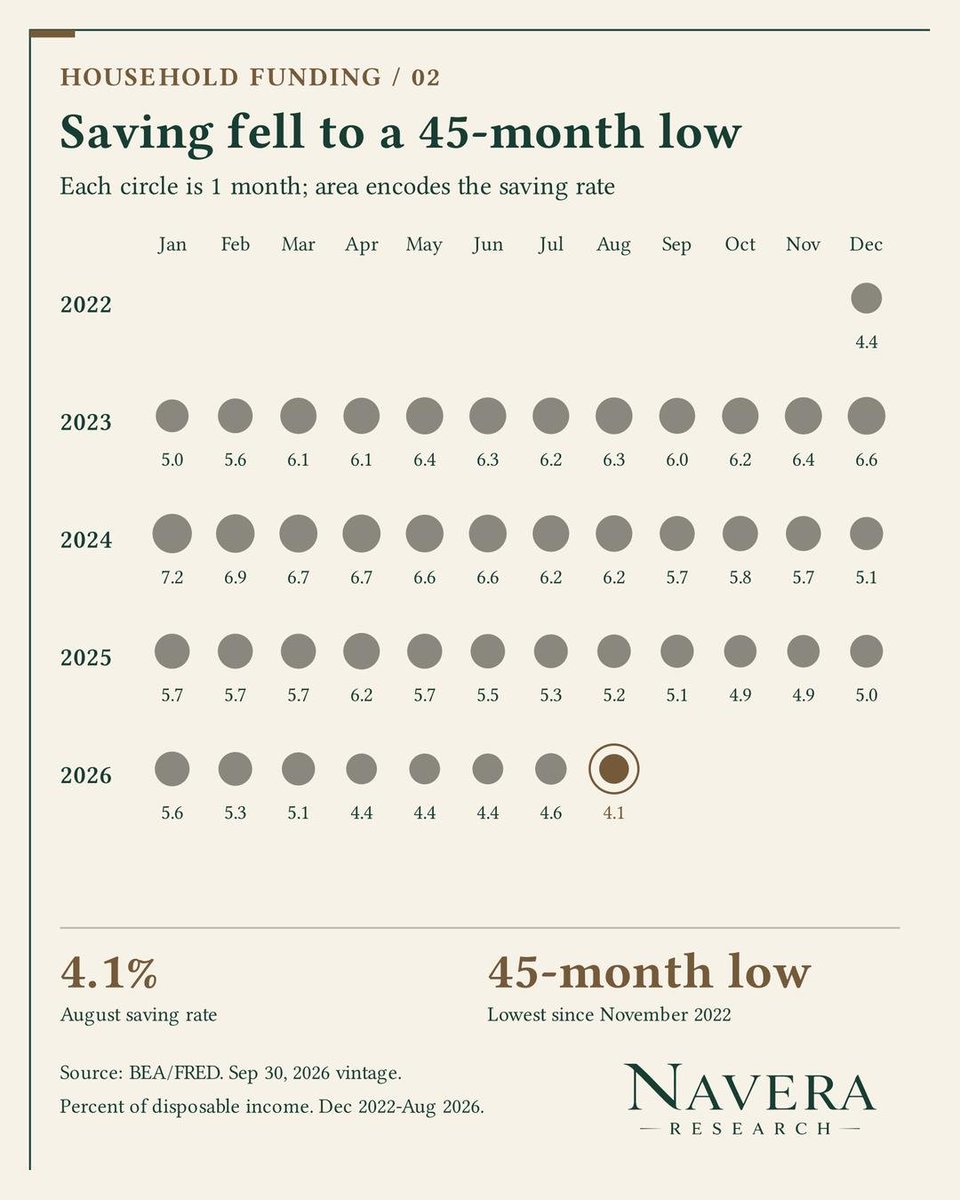
This morning’s BEA release showed August consumption accelerating while real income stalled.
• Real spending: +0.6%, vs +0.1% in July.
• Real disposable income: 0.0%, vs +0.3%.
• Saving rate: 4.1%, vs 4.6%.
Stronger spending supports near-term growth, but households are saving a smaller share of income.
Next test is whether income catches up or consumption slows.
Brent is averaging $113 in September, 24% above August.
When does that reach the grocery bill?
Our new guide answers with 50 years of U.S. data:
• 3 routes from energy to food
• Groceries after past oil shocks
• Does oil improve a grocery forecast?
Read it here: https://t.co/wfhDyQn0EQ
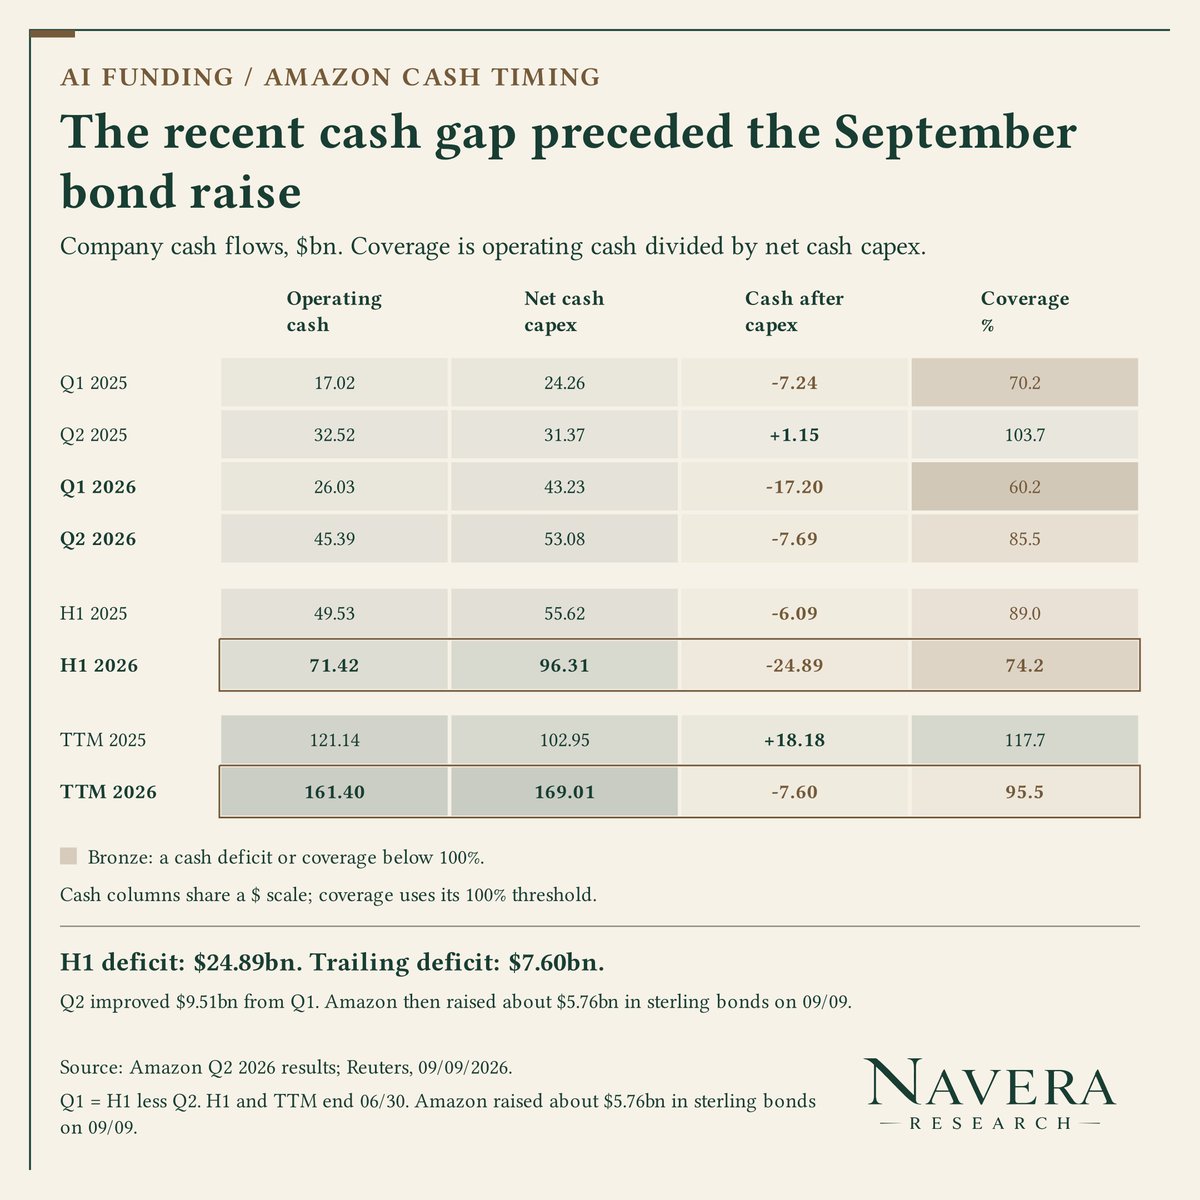
AI funding is splitting by borrower.
• $MSFT cash-capex surplus: $66.99bn
• $AMZN Sep bond raise: $5.76bn
• $CRWV Sep convert: $4.20bn
• AI-linked IG ~115 bp vs broad IG 78 bp
Broad spreads can stay calm while financing-dependent AI borrowers pay more.
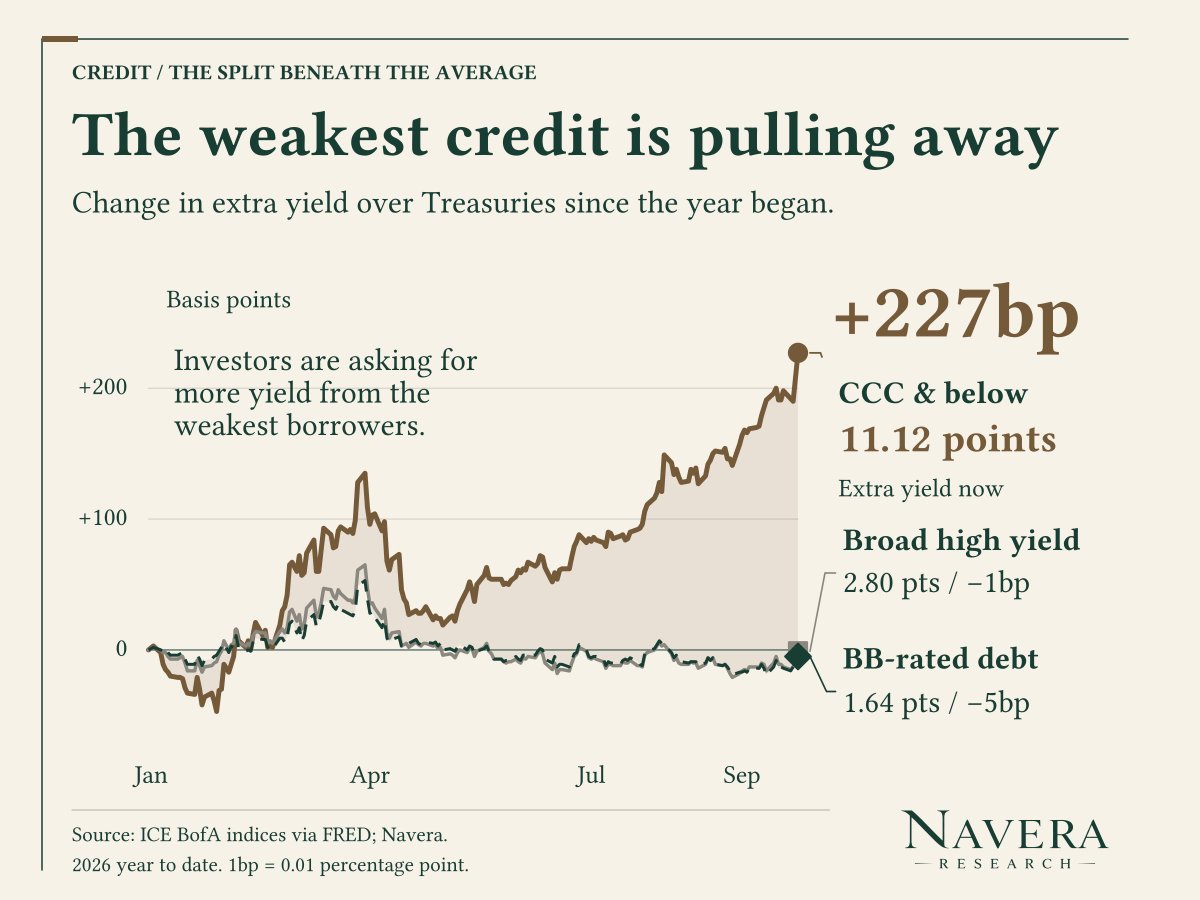
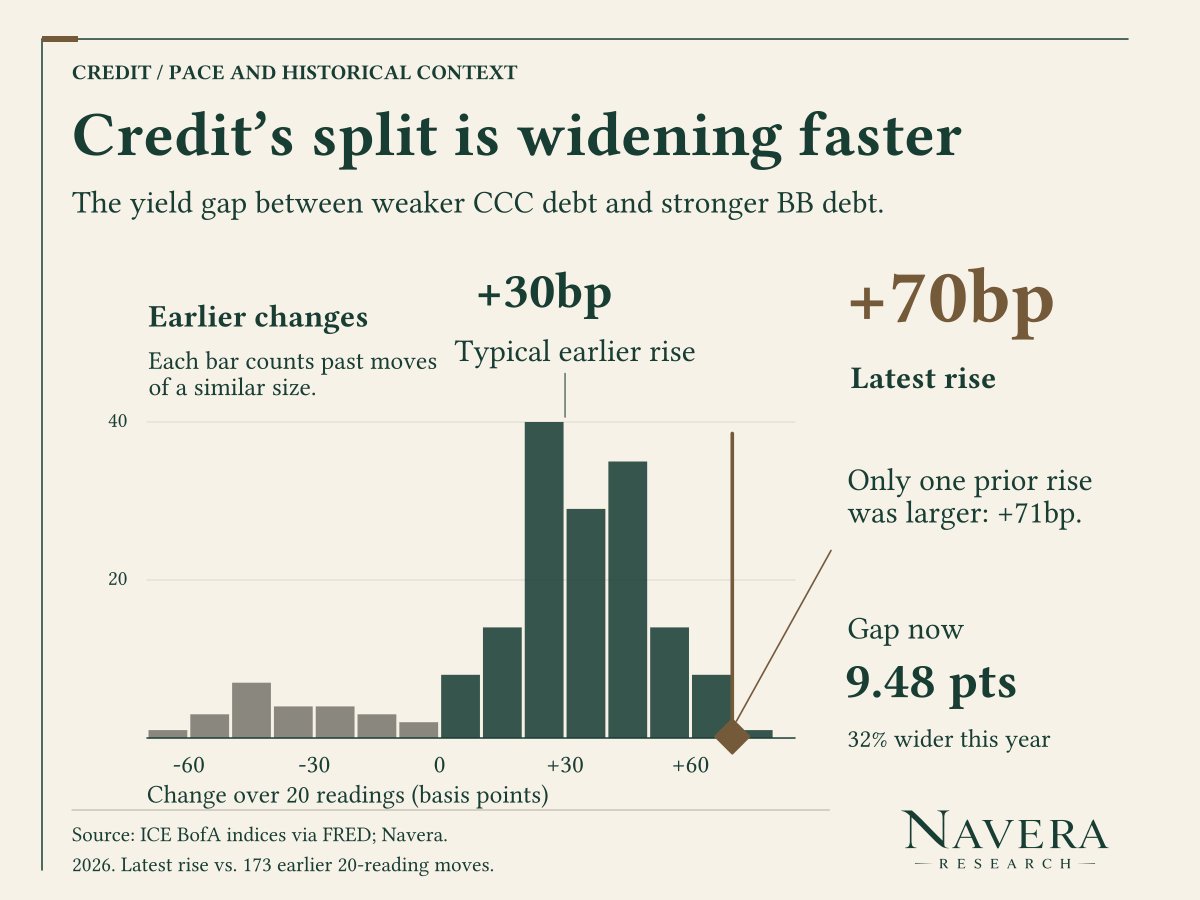
High yield looks calm. The weak end does not.
• Broad HY: 2.81% → 2.80%
• CCC: 8.85% → 11.12%
• CCC-BB gap: +32%
• Latest 20-reading gap move: +70 bp, with only 1 earlier move larger
Stress is still concentrated. Watch whether it spreads up in quality.
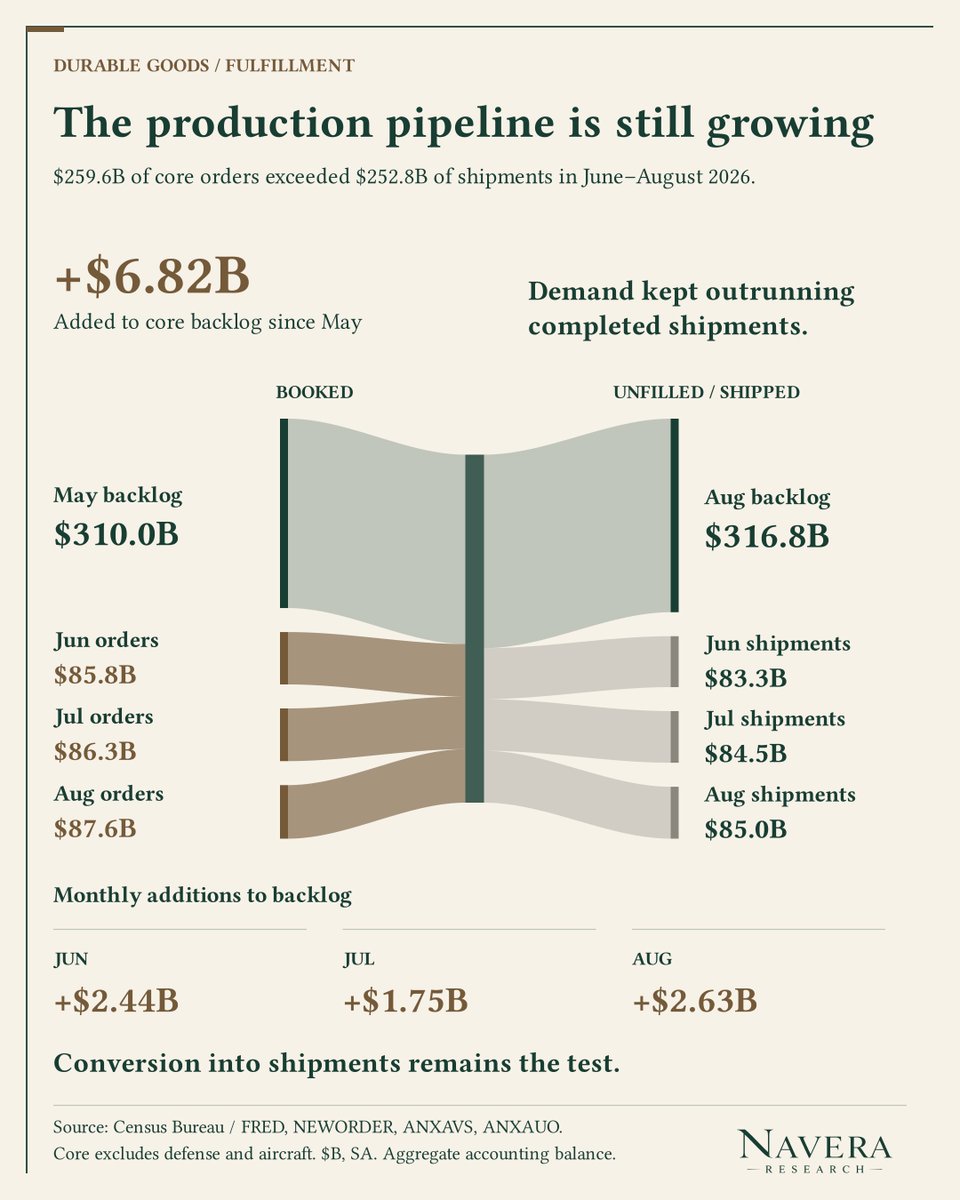
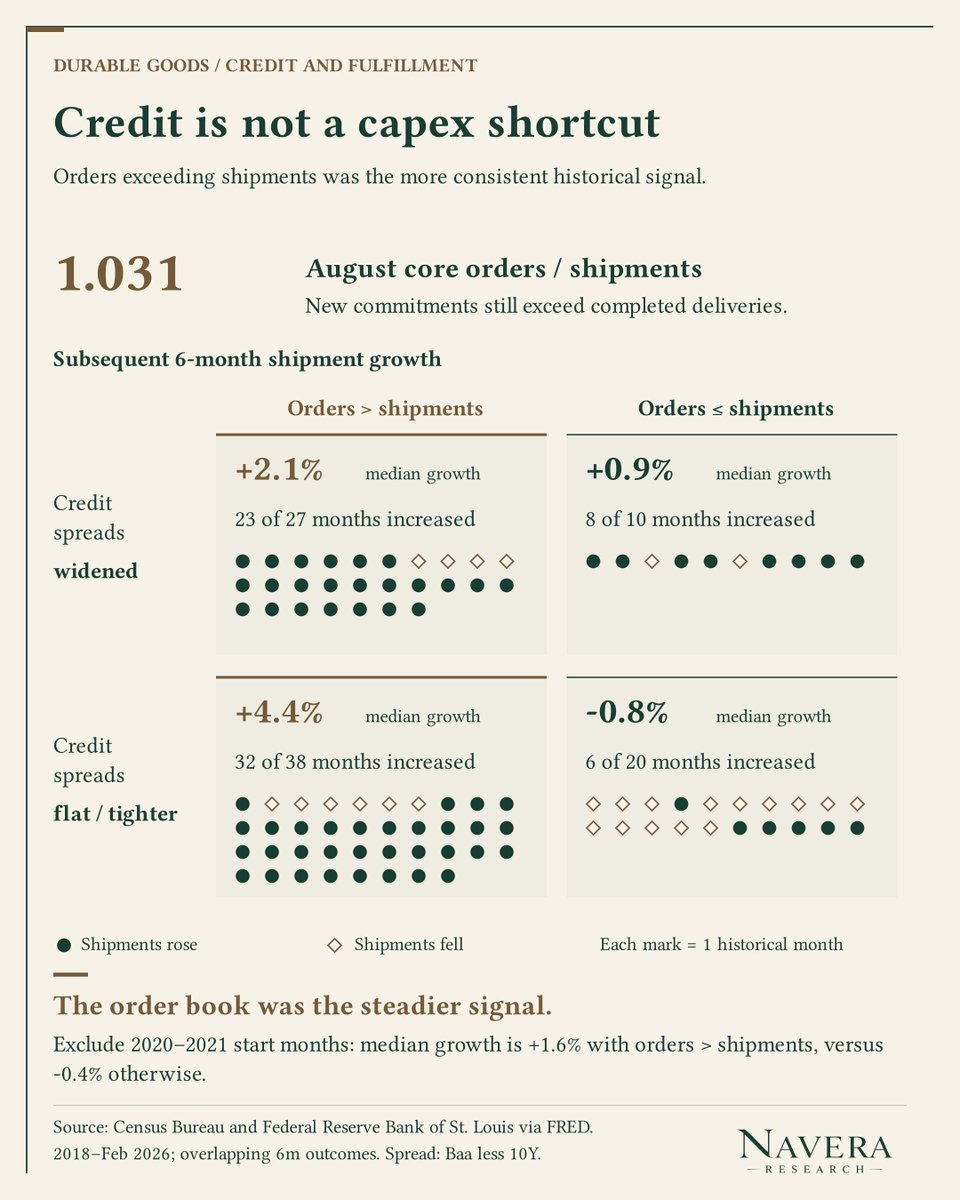
Durable goods demand still outruns fulfillment.
• Jun-Aug: $259.6B orders vs $252.8B shipments
• Backlog: +$6.82B since May
• Aug orders/shipments: 1.031
Historically, orders > shipments preceded stronger 6m shipment growth. Conversion is the test.
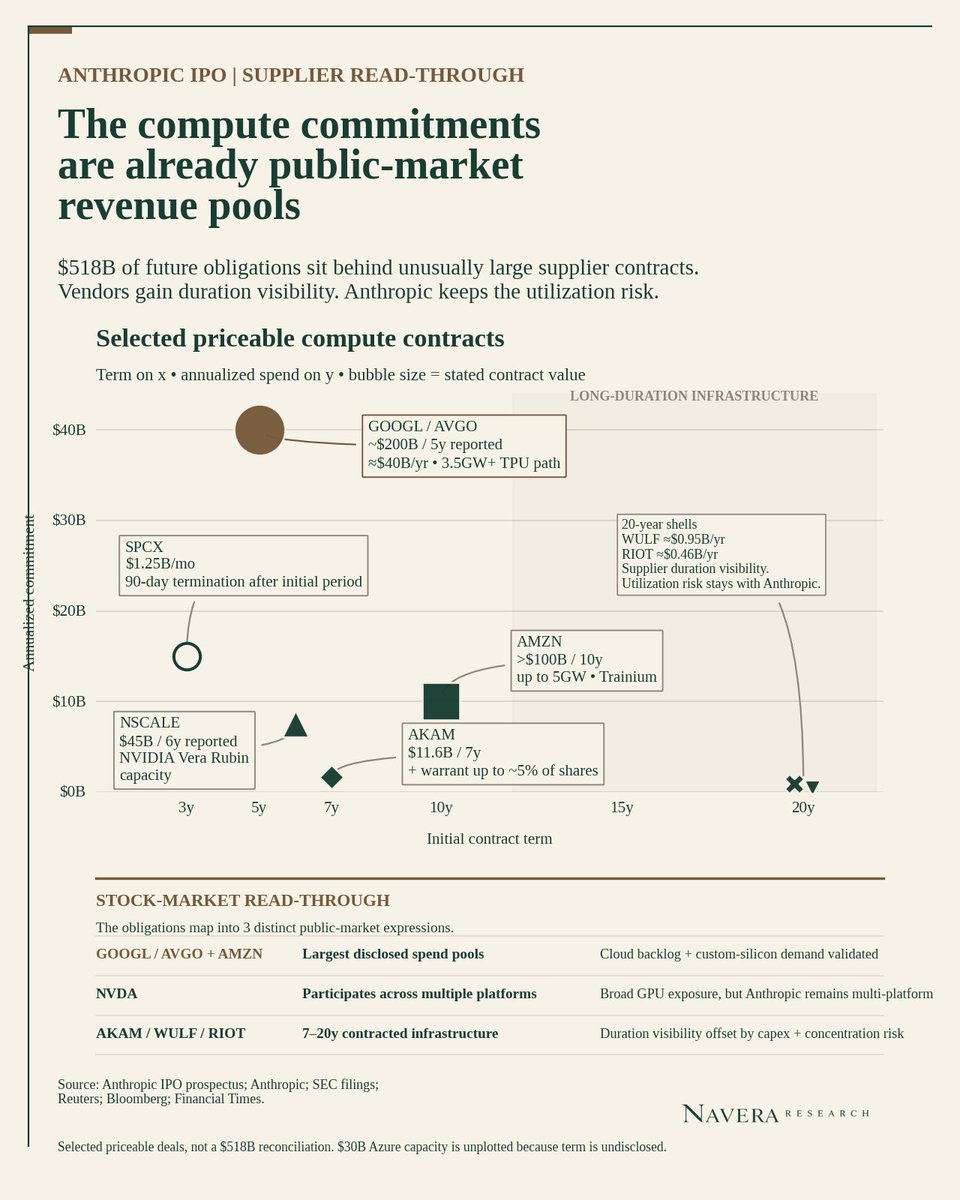
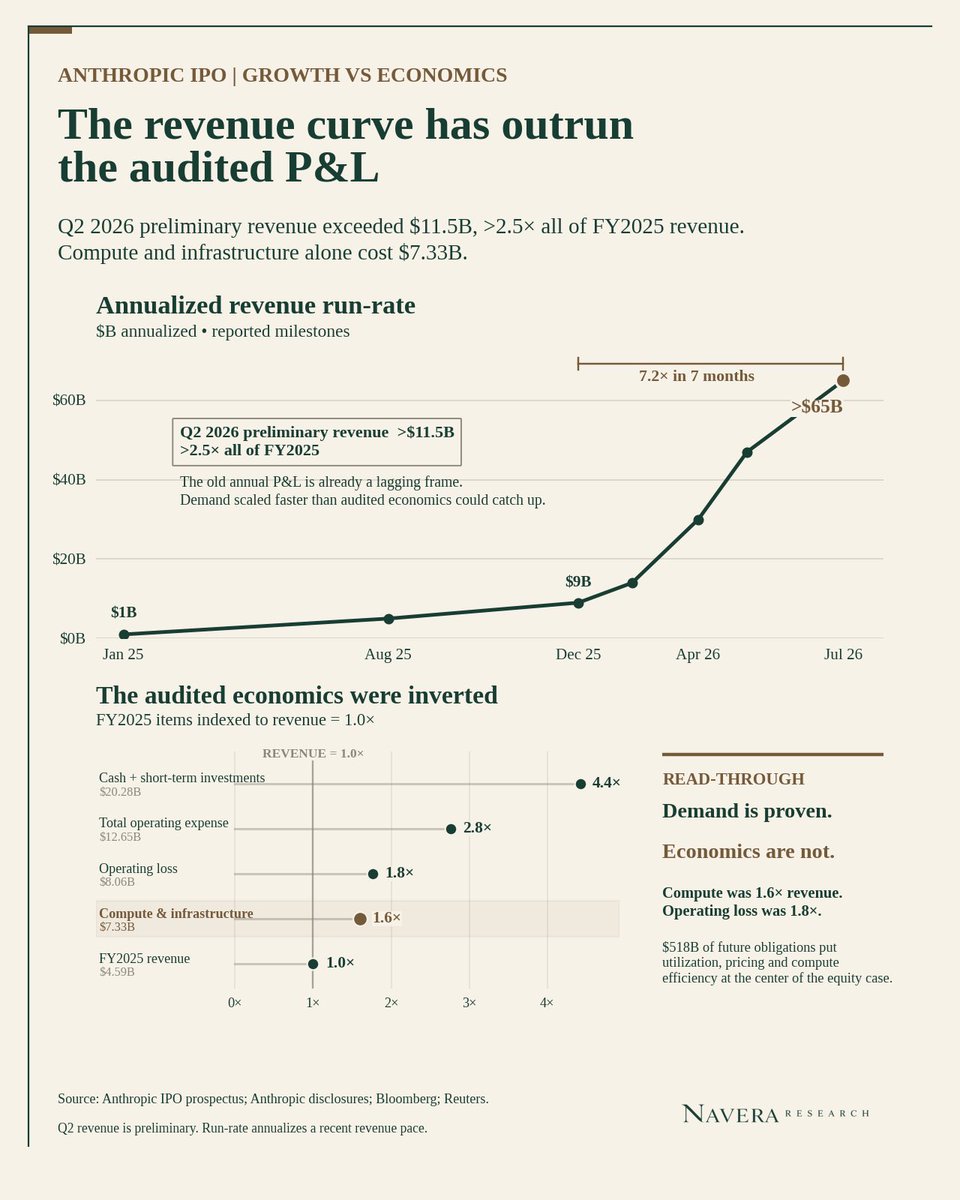
Anthropic’s IPO filing shows where AI spending is landing.
• $7.33B compute cost vs ~$4.6B revenue
• $AMZN $GOOGL: cloud
• $AVGO $NVDA $MU $VRT $ETN: chips, memory, cooling, power
Stocks get clearest earnings support in infrastructure. Anthropic still has to prove margins.
A 5% ten-year yield looks different across eras.
•1970s median: 7.46%
•1980s: 10.43%
•2010s: 2.33%
•1970–Aug 2026: 56% of months at 5%+
Historical rarity depends on the comparison period.
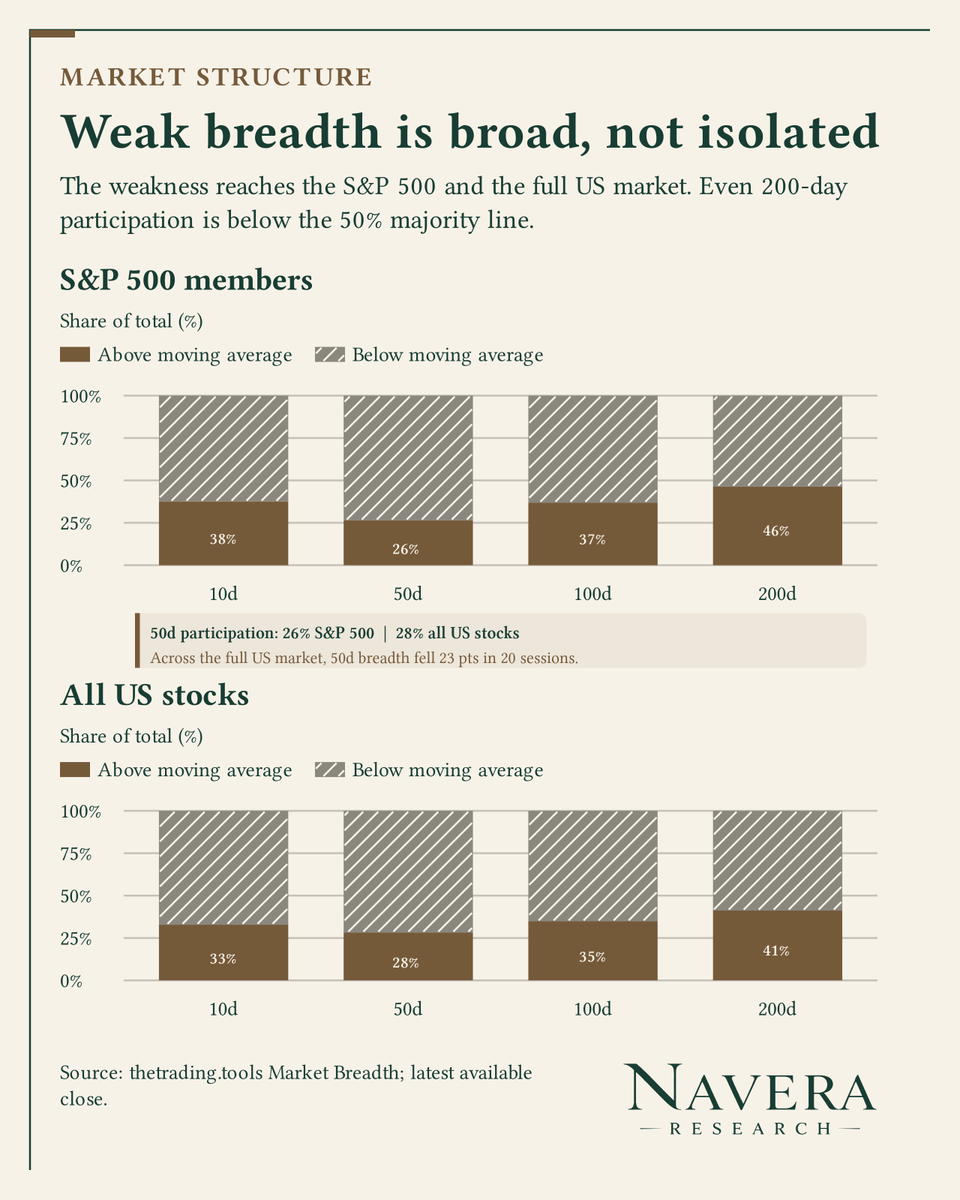
Intraday check-in: the week is starting where the weekend Regime Map left off.
• S&P >50d: 26%
• All-US 50d: -23 pts/20d
• Only 2/19 major peaks had similarly weak breadth
Weak participation still argues for selectivity, not a market-timing call: https://t.co/nGYr6OOGO3
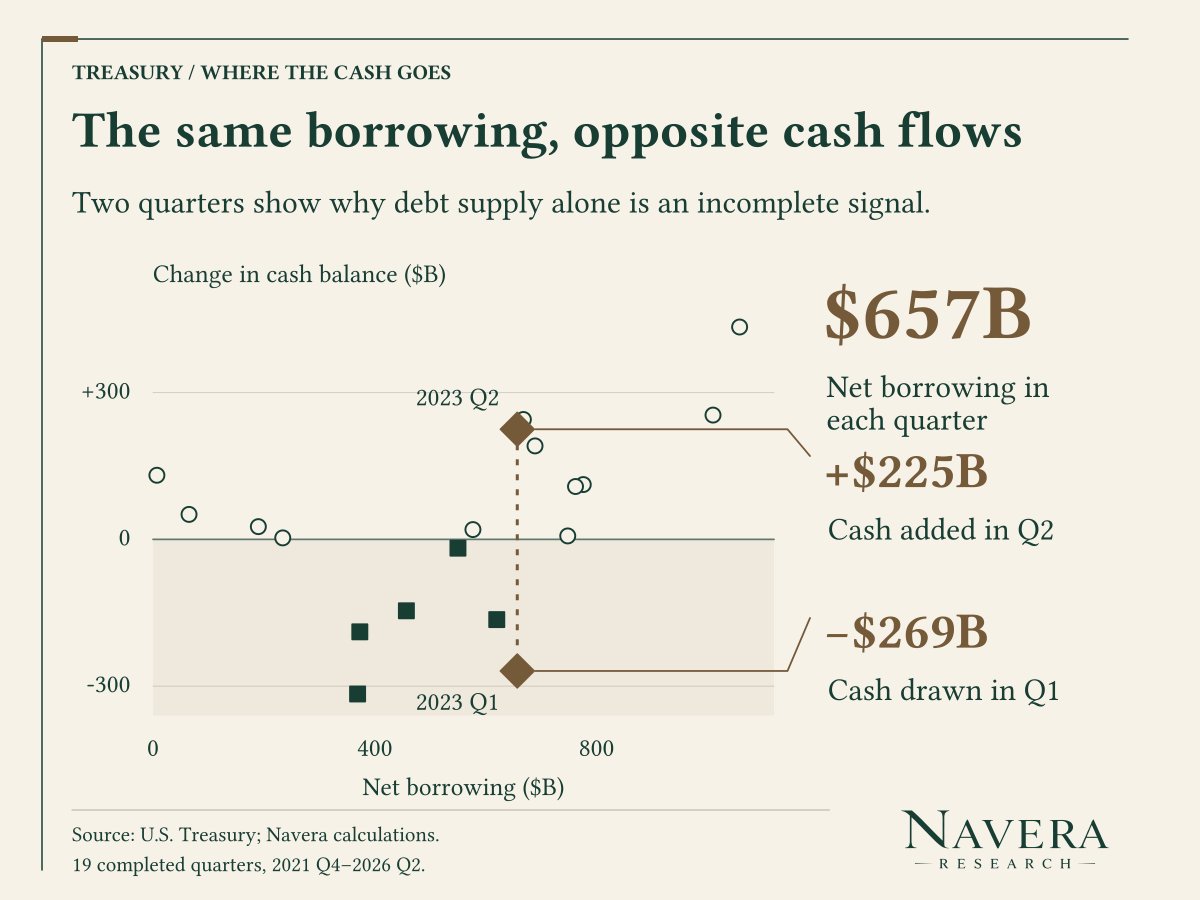
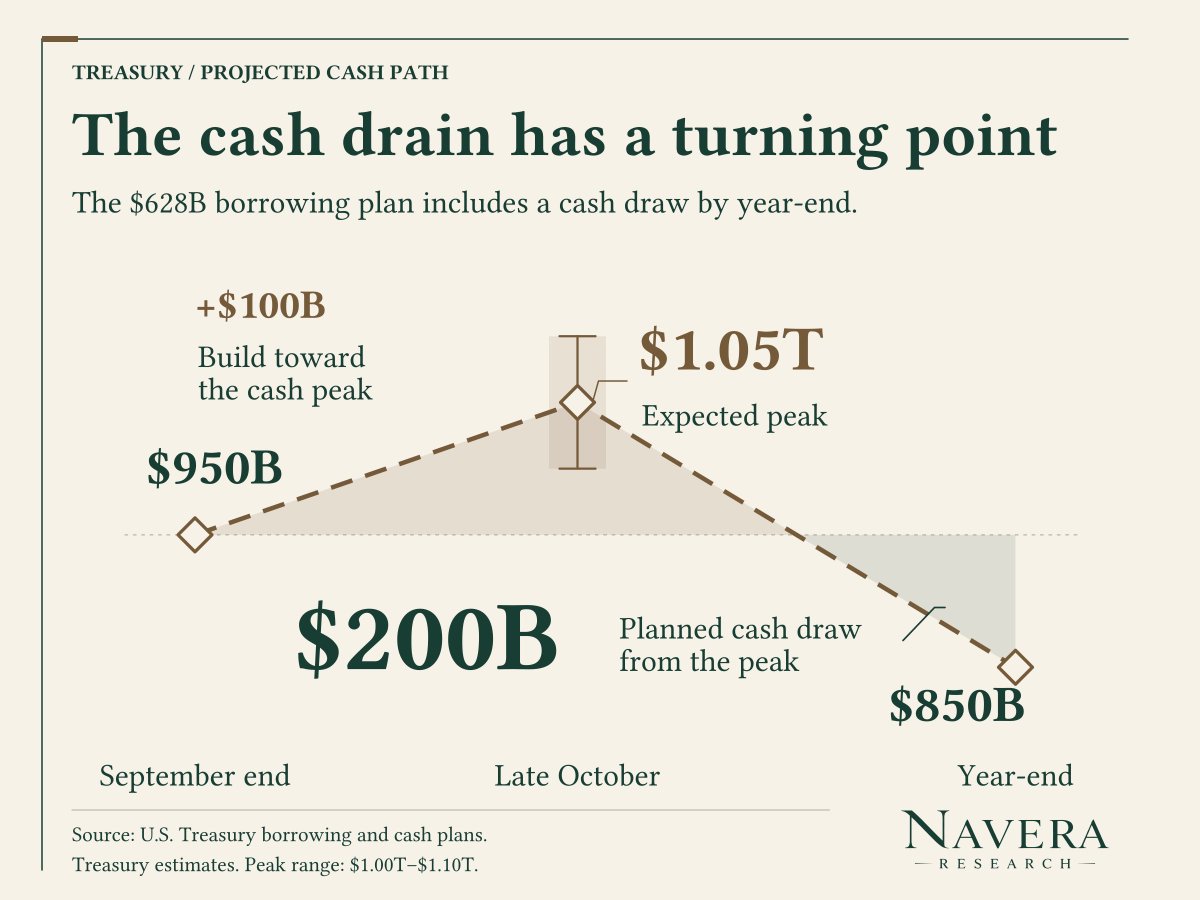
Treasury supply is not the liquidity effect.
• Plan: $628B borrowing, $100B cash draw
• Cash path: $950B → ~$1.05T → $850B
• Same $657B borrowing in 2 2023 quarters: cash moved +$225B and -$269B
Watch Treasury cash and funding rates, not gross supply alone.
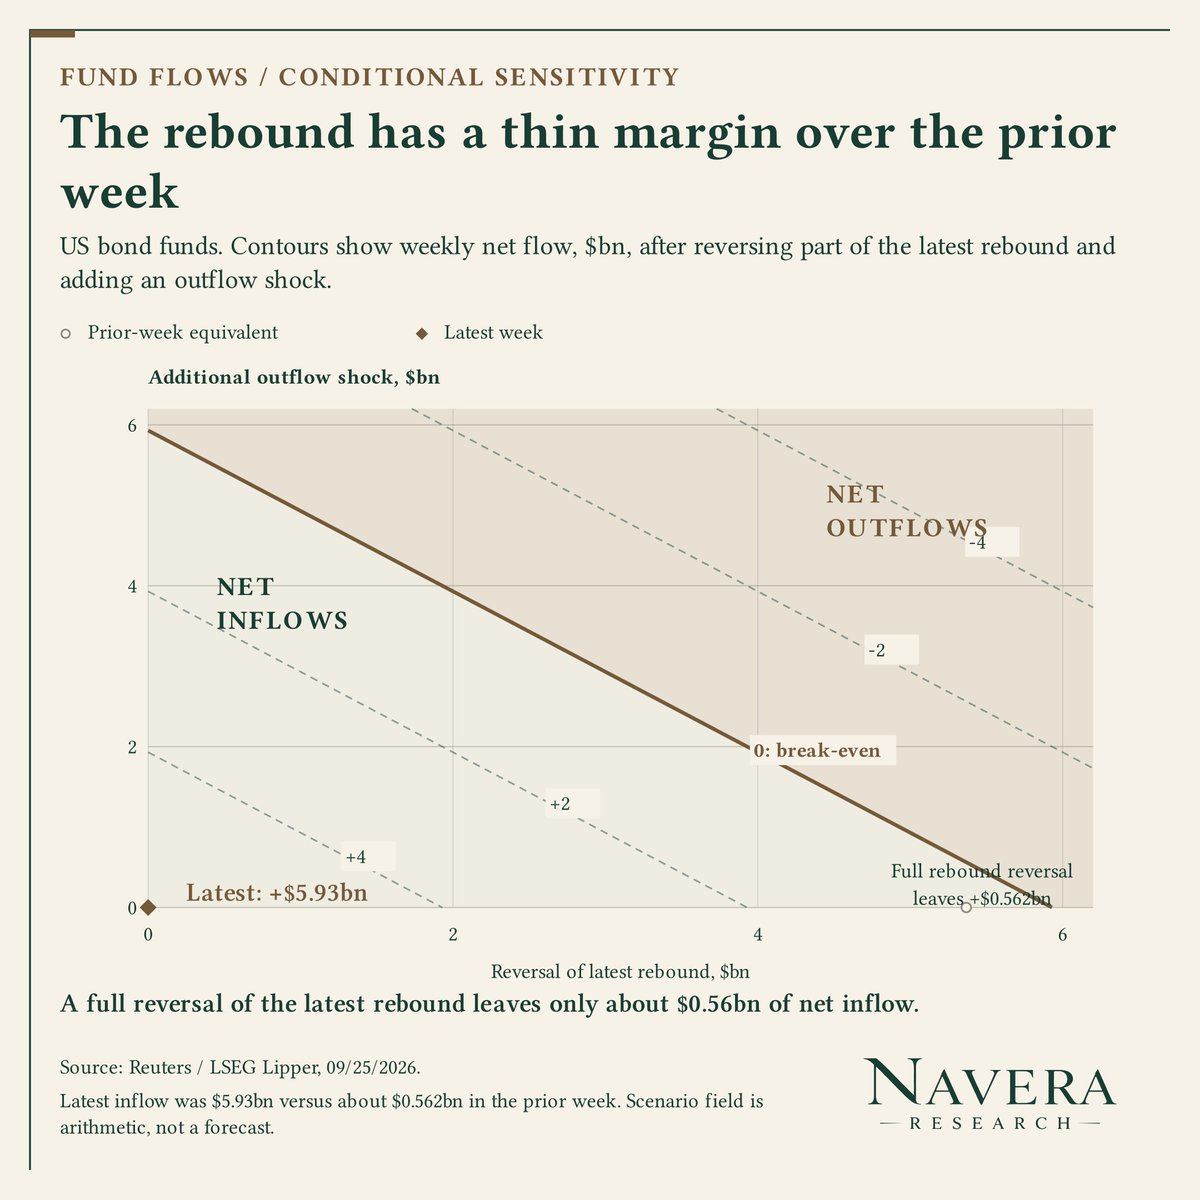
The latest flows push back on a broad credit-outflow story.
• US bond funds +$5.93bn
• Short/intermediate IG +$1.63bn
• IG issuance $35bn; HY >$17bn
Demand is still there, but it is rotating toward shorter-duration credit as rates rise.