Most NGOs don't have a data problem.
They have a visibility problem.
Thousands of surveys. Hundreds of reports. Millions of data points.
Yet some of the most important insights never leave a PDF.
In today's world, impact that isn't seen is often impact that isn't funded.
NGO data workflow starter pack:
📱 Kobo
📊 Excel
💬 WhatsApp
📧 Email
😩 Panic
📄 Donor deadline
Bonus boss level:
final_FINAL_v9_USE_THIS_REAL.xlsx 😂
This is not a data problem.
It’s systems architecture failure.
Who relates? 👇
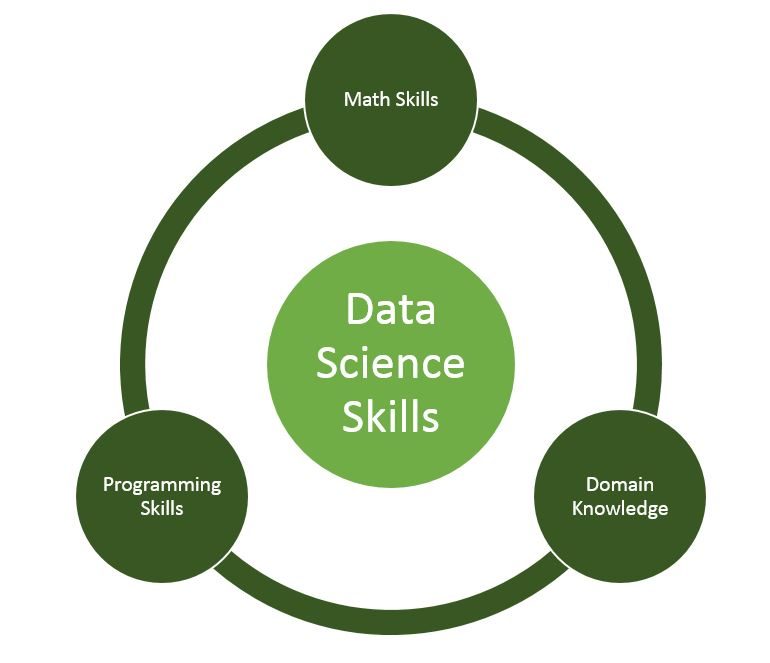
Learn Data Science for FREE in 2026
1. Python
https://t.co/MaOHz0MUr6
2. SQL
https://t.co/VYMcTJS2mx
3. Excel
https://t.co/iiHp8bDIBH
4. Power BI
https://t.co/sU505kAX37
5. Mathematics
https://t.co/bP4oRYYq39
6. Data Analysis
https://t.co/4aNtpWhAXq
I'm deleting this soon because it's a legit cash-printing formula.
𝗣𝗮𝗶𝗱 𝗖𝗼𝘂𝗿𝘀𝗲 𝗙𝗥𝗘𝗘 (PART - 3)
1. Artificial Intelligence + Data Analyst
2. Machine Learning + Data Science
3. Cloud Computing + Web Development
4. Ethical Hacking + Hacking
5. Data Analytics + DSA
6. AWS Certified + IBM COURSE
7. Data Science + Deep Learning
8. BIG DATA + SQL COMPLETE COURSE
9. Python + OTHERS
10 MBA + HANDWRITTEN NOTES
(72 Hours only ) Cost About - $500
To get: -
1. Follow (So I can DM you )
2. Like & retweet
3. Reply " Send "
Everyone talks about “data-driven decisions.”
But here’s the truth:
Bad research + wrong sample = misleading conclusions.
It’s not about how much data you have. It’s about whether your data actually represents reality.
That’s where real analysts stand out
#DataAnalytics
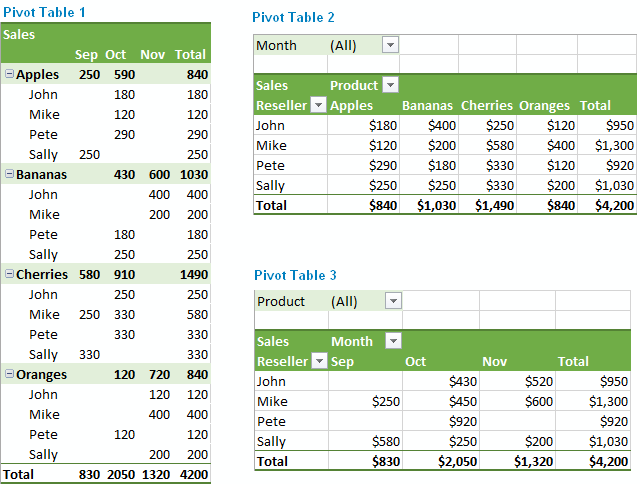
I Thought I Knew Pivot Tables — Until I Realized I Didn’t
How long does it take to master Pivot Tables?
A week?
A month?
A course certificate?
For me, it wasn’t about time.
It was about thinking.
Starting data analytics isn’t hard because of the tools.
It’s hard because of the noise.
Too many courses.
Too many opinions.
No clear roadmap.
Clarity > certificates.
What’s blocking your progress?
Maturing in data analytics is realizing you don’t need to master Excel 100% before learning the next tool.
Perfectionism delays progress.
You don’t need every formula memorized or every shortcut mastered to move forward.
Expertise isn’t knowing everything.
We almost lost 2 weeks of field data.
Paper forms.
Missing pages.
Unreadable handwriting.
Delayed supervision.
That was our breaking point.
We switched to ODK.
Hey beginner Data Analyst,
Microsoft Excel seems to be the less important yet so pivotal tool in data analytics…
Everyone wants to jump straight into Python, Power BI, Tableau or even Machine Learning.
But guess what?
Most businesses are still running on Excel.
Budgets? Excel.
Sales reports? Excel.
Loan trackers? Excel.
HR headcount analysis? Excel.
SME financial models? Excel.
Before the dashboards…
Before the automation…
Before the fancy titles…
There is usually an Excel file holding everything together.
Here’s the uncomfortable truth:
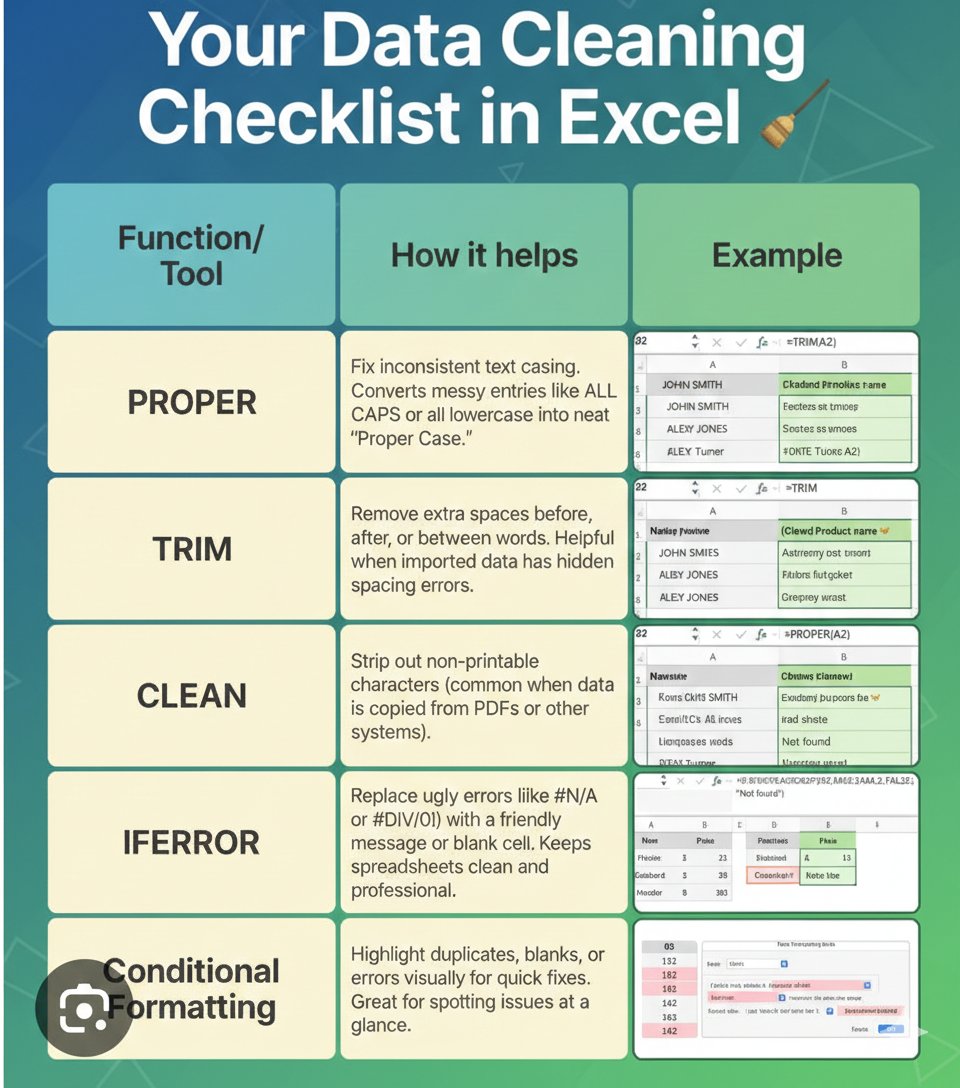
If you can’t clean data in Excel,
If you can’t use Pivot Tables,
If you don’t understand VLOOKUP/XLOOKUP,
If you can’t structure raw data properly…
Advanced tools won’t save you.
Excel teaches you:
• Data structuring
• Logical thinking
• Basic transformations
• Reconciliation
• Financial modelling
• Attention to detail
It’s not “basic.”
It’s foundational.
The strongest data analysts I know didn’t skip Excel. They mastered it, then layered other tools on top.
Don’t underestimate the tool that built the foundation of modern business reporting.
Excel may look simple.
But it separates those who understand data…From those who just visualize it.
Dear Data Analyst!
If you start today
You can learn Excel in February
Learn Power BI or Tableau in March
Learn SQL in April
Start applying for jobs in March
Just 3 months is all you need
Start now and learn consistently❤️
Researchers are trained to produce strong evidence.
But here’s the uncomfortable truth: even high-quality evidence doesn’t always influence funding decisions.
In my experience, the most influential studies aren’t the most complex, but the most usable.
10+ years in research taught me one hard truth:
Research doesn’t start with datasets. It starts in the field.
A “perfect” dataset can still tell the wrong story. Indicators miss lived realities. Communities understand problems long before we model them.
#FieldResearch
Exploratory Data Analysis (EDA) is a process used for investigating your data to discover patterns, anomalies, relationships, or trends using statistical summaries and visual methods.
Let's find out more 🧵👇