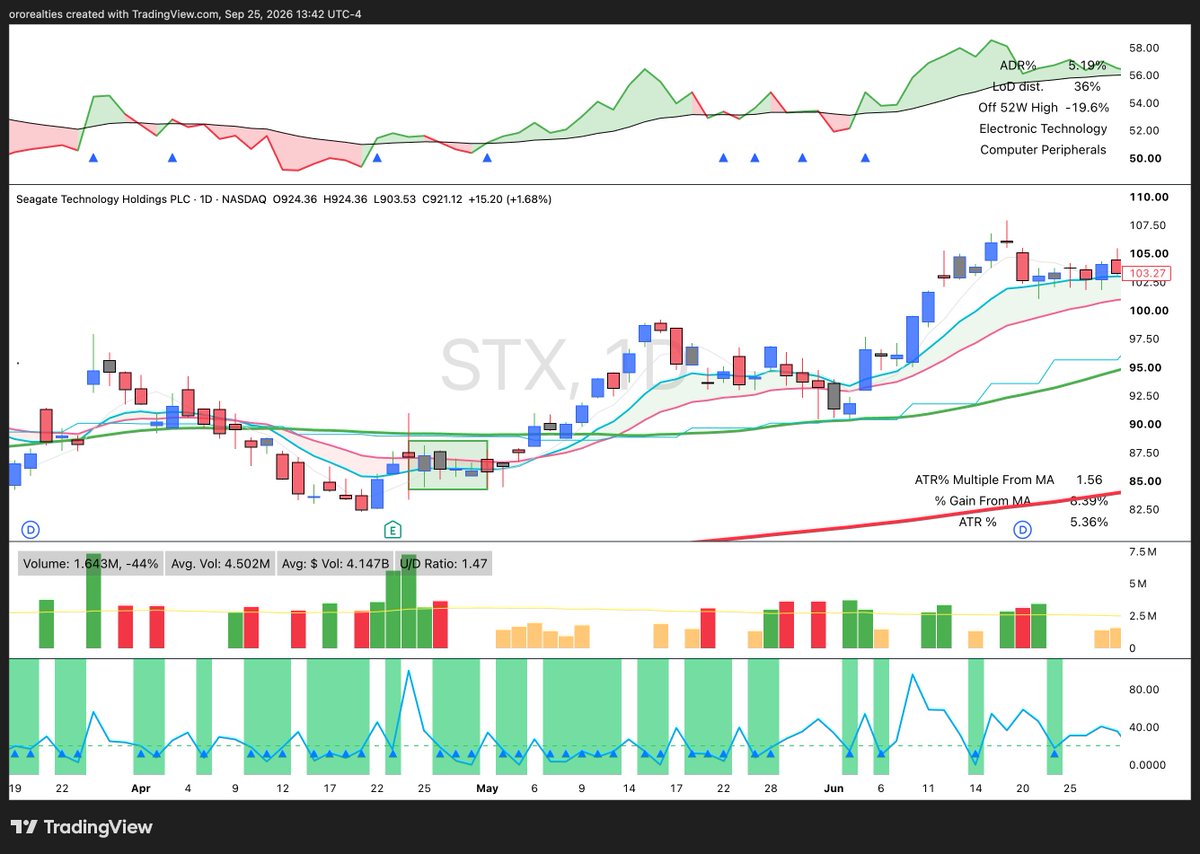
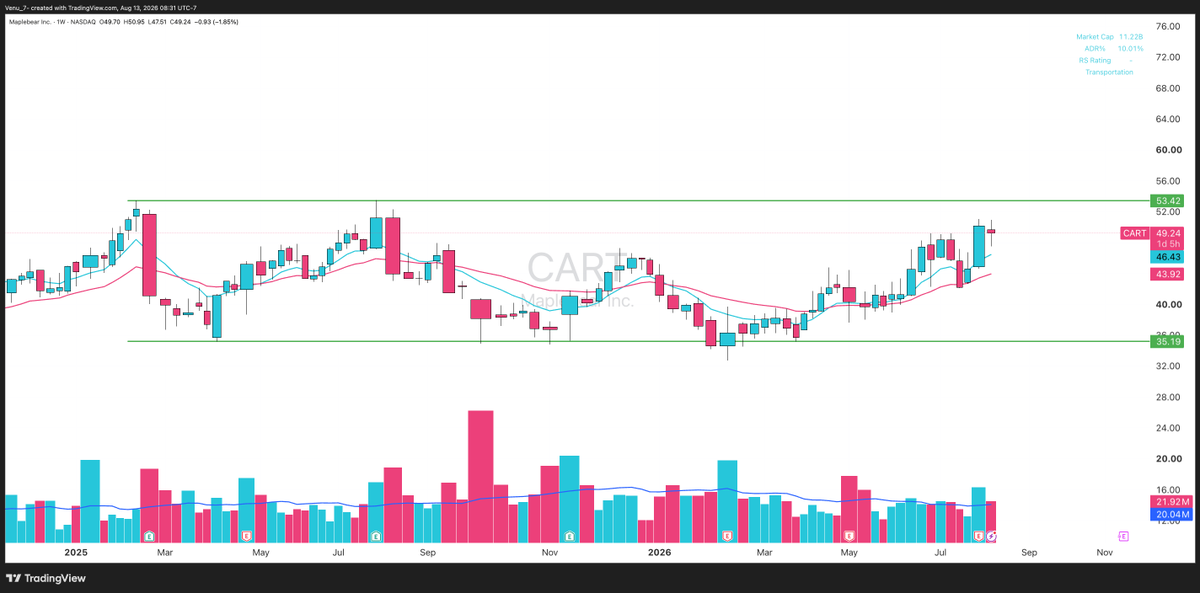
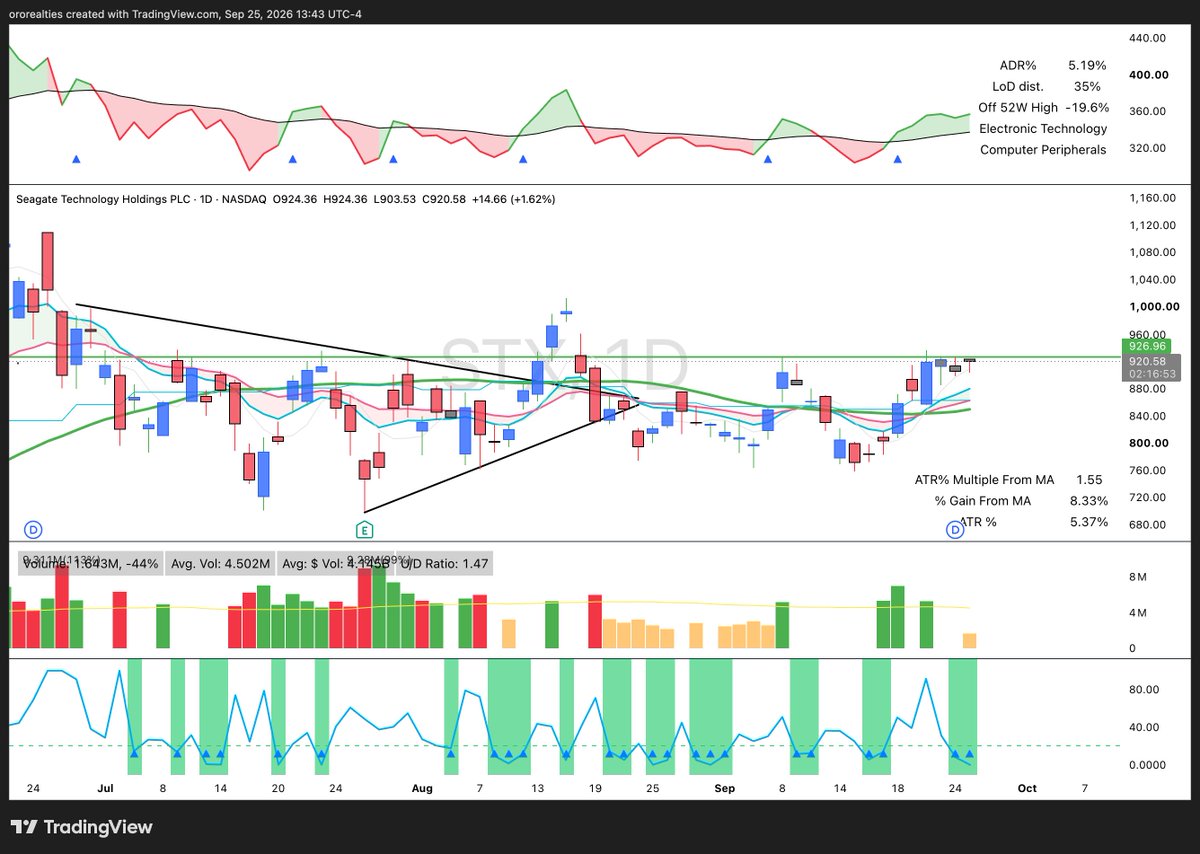
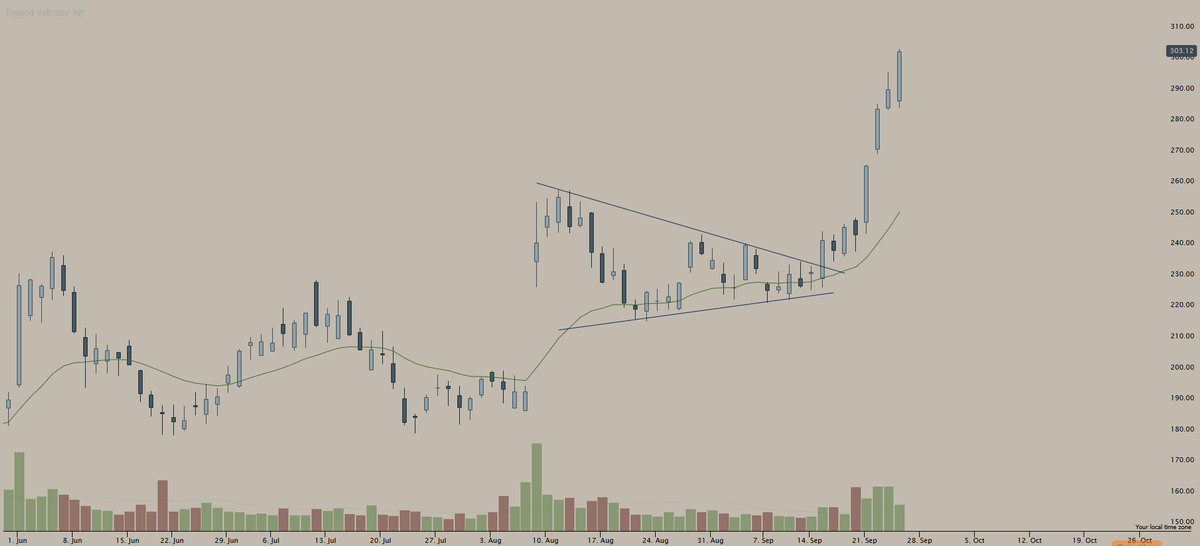
-Always collect data rather than rely on your intuition!
-Be wary of “no man’s land”. So many people ask if I position ahead of the true breakout and it’s almost always no. I’m ok w missing out.
-When you identify a problem, propose concrete solutions like Goose does. Good 🪿!
-Improve and iterate if that issue remains your top constraint.
For more on “no man’s land” check out this video! https://t.co/KEbL56elVj
Mark Minervini used his SEPA strategy to post the verified 334.8% return. It screens for Stage 2 uptrends via an 8-point Trend Template: price above rising 50/150/200-day MAs, within 25% of 52-week highs, at least 25-30% off lows, and RS 70+. Entries come on VCP breakouts with volume plus accelerating earnings/sales. Risk is capped at 7-8% per trade with quick stops; he sells into strength, using leverage on high-conviction setups while keeping overall downside minimal.
Success is not accidental.
It requires clear goals, focused effort, and intentional decisions.
When you know where you are going, every step has purpose.
How Relative Strength Exposes Market Rotation in Real-Time
Sectors and themes constantly rotate under the surface of the market, driven by institutional reallocations. While retail traders chase whatever is flashing green on the surface today, tracking Relative Strength (RS) is your radar for seeing where big money is moving before it becomes obvious.
Here is how following RS helps you map and ride market rotation:
1. Spotting Capital Inflows Early
When institutions rotate out of one sector (like tech) and into another (like energy or financials), they don't do it all at once, they accumulate quietly.
The Tell:
Even when the broader market is flat or drifting lower, RS leaders in the incoming sector will start bucking the trend. They refuse to pull back, show relative volume expansion on down days, or quickly snap back to highs.
The Edge:
By monitoring which stocks are holding up or breaking out while everything else stalls, you immediately see where institutional capital is landing.
2. Filtering Out Market Noise
Broader market indices can look messy or range-bound during a rotation phase, trapping traders who only look at the macro view.
The Tell:
RS strips away the macro noise. If a specific group of stocks is showing persistent relative strength regardless of what the index is doing, you've found the current institutional sweet spot.
The Edge:
Instead of guessing what sector is cycling in next, you let the price action vote. You follow the names showing structural leadership and trade in alignment with where the heavy sponsorship actually lives.
3. Riding the Wave, Not Chasing the Tail
Rotation isn't a one-day event; it's a multi-week or multi-month trend as capital shifts allocations.
The Tell:
Once an institutional rotation is underway, the leading RS stocks in that sector form clean continuation patterns (High Tight Flags, volume-backed consolidations, or moving average retests).
The Edge:
Tracking RS lets you transition smoothly alongside the smart money. As old sectors fade, your watchlist automatically populates with the new leaders driving the next leg of the market cycle.
Don't go for average, go for Elite. Watch the RS leaders, map the rotation, and let the institutional flow guide your entries.
$SN
Good old Peter Lynch stock picking.
Got the ice cream machine, the hairdryer (shark), the air fryer…
90% of Dyson quality 50%+ cheaper.
One of the only current brands where I truly feel like I’m not getting fleeced for the brand name and where I feel confident in the performance.
Not cheap and bad quality, not perfect quality at a premium but great quality at a reasonable price.
A Must Watch! $AMD
#23 on @IBDinvestors IBD Top 50 list!
https://t.co/F3yOLMbNaw
Gorgeous multi-week consolidation pattern emerging here in $AMD that's been bobbing and weaving along the 50 day MA following a strong 2026 run up! Printed another PEG candle last week which adds an extra layer of confidence that this will breakout next week!
Target: $600
#IBDpartner
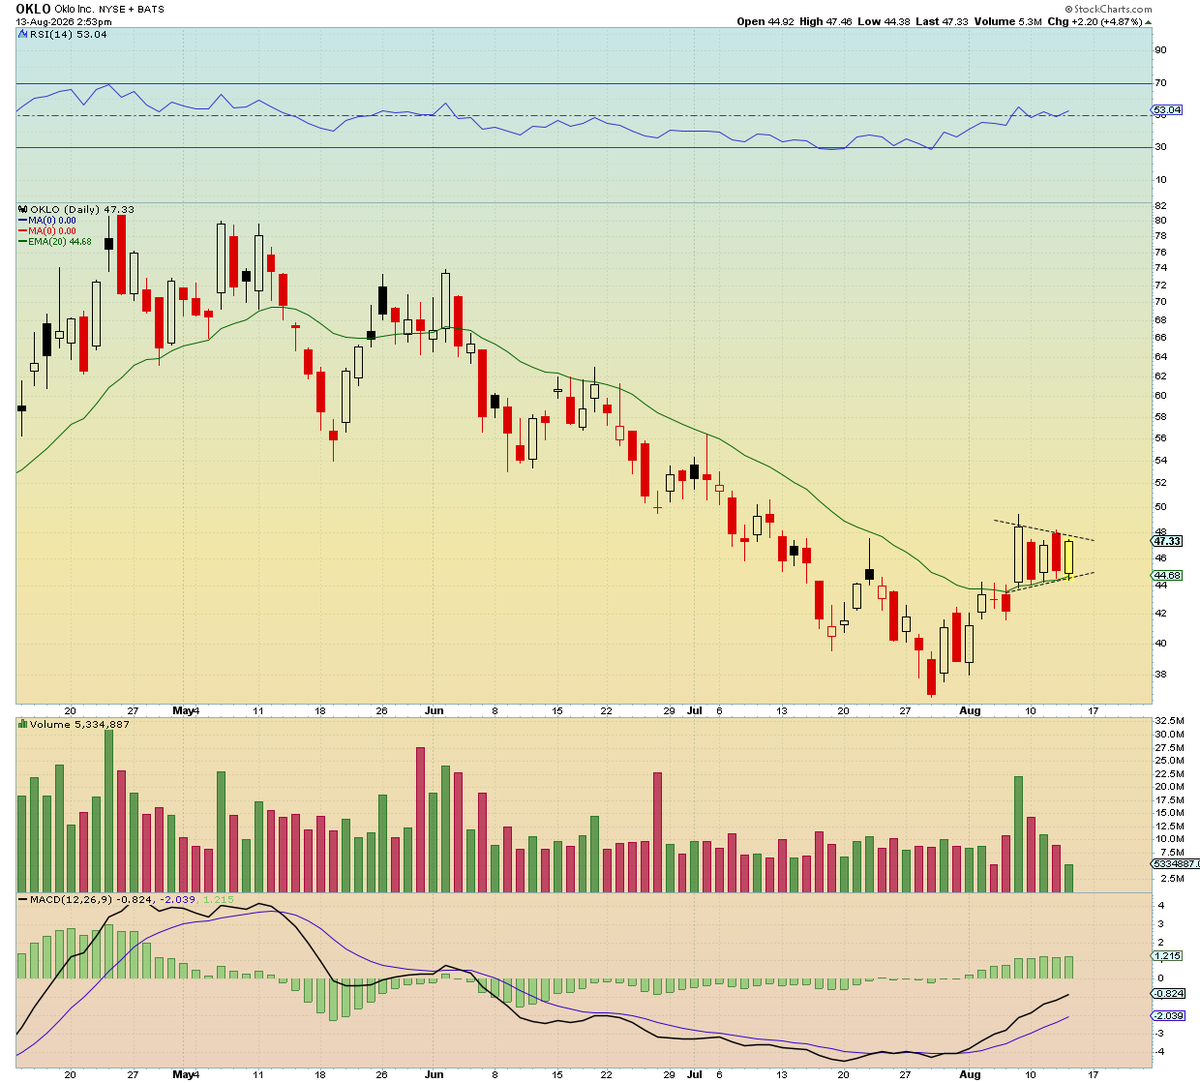
Really like the way $OKLO is shaping up, notice how this mini consolidation is taking place while volume declines.. also just a subtle wick below yesterdays candle then reclaimed showing demand.
On watch for tomorrow ideally a red to green move is what id want to see to get in, keep in mind the high short float makes it a good squeeze candidate as well.
Here are the steps how I build a high-conviction weekly watchlist.
1. Establish the Top-Down Market Context
Before looking at individual tickers, evaluate the health of the broader market. Check major indexes (S&P 500, Nasdaq) relative to key moving averages to identify the current market regime. Rule of thumb: Only look for aggressive long setups when the broader market trend is supportive; if indices are breaking down or highly choppy, tighten criteria or sit on your hands.
2. Run Objective Scans for Relative Strength
Filter the universe of stocks for institutional accumulation using specific technical criteria:
Relative Strength (RS): Look for stocks outperforming the general market (making new highs or holding up resiliently while the market pulls back).
Volume Signatures: Screen for volume anomalies, HV1 or HVE (highest volume in one year or ever), or sudden liquidity surges indicating institutional sponsorship.
Trend Alignment: Filter for names trading cleanly above key intermediate trend filters (such as the 21-day EMA or 8-week line).
3. Sort and Categorize Your Setup PoolOrganize your filtered candidates into structured watchlists based on chart structure rather than chasing random movement:
Breakout / Continuation Watchlist: Stocks consolidating tightly near recent highs (forming flat bases, flags, or cup & handle bases) ready to clear overhead resistance.
Pullback Watchlist: Leading stocks pulling back methodically on lighter volume toward the 21 EMA or 8-week moving average to test support.
Earnings Catalyst Watchlist: Companies that recently posted strong "beat and raise" quarters with explosive reactions, building initial multi-week bases for a secondary continuation move.
4.Define Your Action Plan (The "Right/Wrong" Thesis)For every single stock that makes the final cut onto your weekly watchlist, write down your execution parameters ahead of time:
The Trigger: Exactly what price action or breakout level signals entry?
The Risk Control: Where does the thesis fail? Define your strict stop-loss level.
The Target: Map out initial reward zones to ensure a favorable risk-to-reward ratio (e.g., 1:3 or better).
5. Set Price Alerts and Execute with Discipline.
Input your key level alerts directly into your charting platform so you don't have to stare at the screen all day. Treat your watchlist like a sniper's target list: wait patiently for the market to bring the setup to you, execute precisely when your criteria are met, and discard anything that fails to trigger.