3/ Conclusion: The Bottom is In
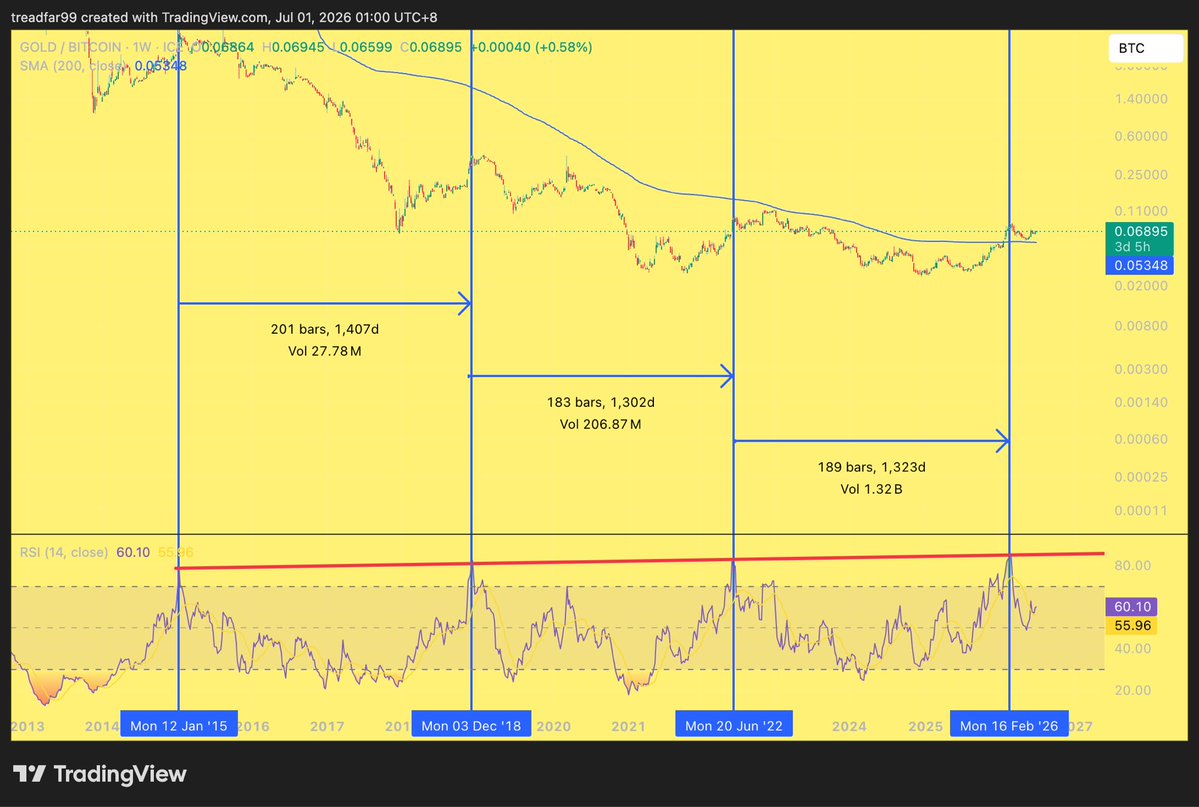
Following this precise ~1,300 to 1,400-day cycle, the most recent macro peak for Gold/BTC was Feb 2026 at the $69K level.
If history repeats, the absolute bottom is among us and Bitcoin is currently trading at a deep value relative to Gold.
Is the generational #Bitcoin bottom already in?
If you look at the $XAUBTC (Gold priced in Bitcoin) macro chart, the math points to a massive conclusion. We might be sitting on deep, historic value right now compared to Gold.
🧵👇
2/ The time between these major RSI peaks is consistent, proving that macro market cycles run on a rhythm:
* Cycle 1: Jan 2015 to Dec 2018 - 1,407 days
* Cycle 2: Dec 2018 to June 2022 - 1,302 days
* Cycle 3: June 2022 to Feb 2026 - 1,323 days
The consitency is staggering.
1/ Historically, Bitcoin hits a major macro bottom (or comes within a few weeks of it) when the GOLD/BTC weekly RSI gets overextended and tags the upper trend line.
The blue vertical lines mark these exact cyclical peaks. Every single time it hits this line, the tide turns.