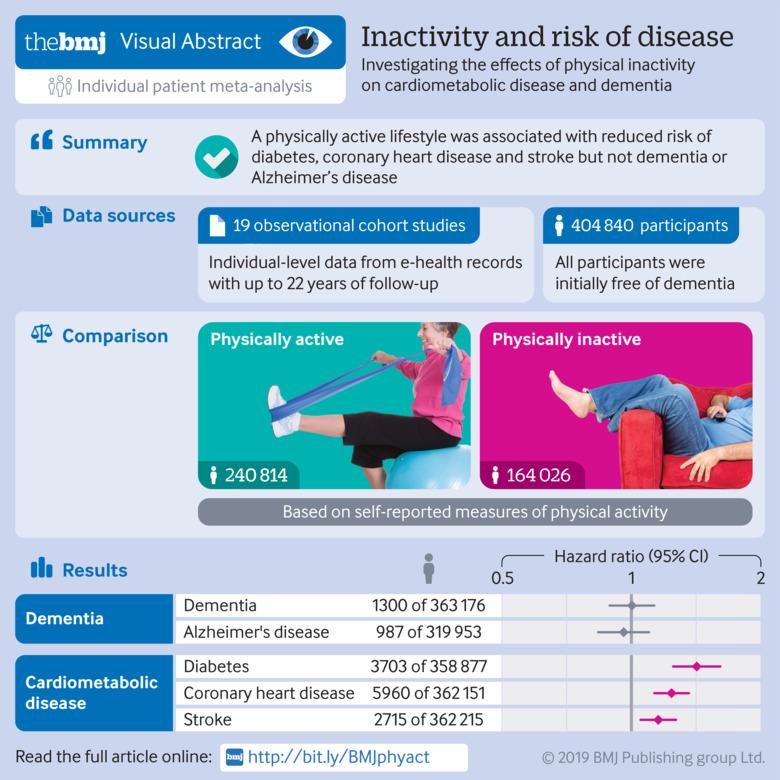
If you're someone who reads health/medical infographics, consider filling out this survey by @zadro_josh at University of Sydney. It asks about what you'd like included in infographics summarising health research. I'll be looking carefully at the results! https://t.co/zBSHPl8xF1
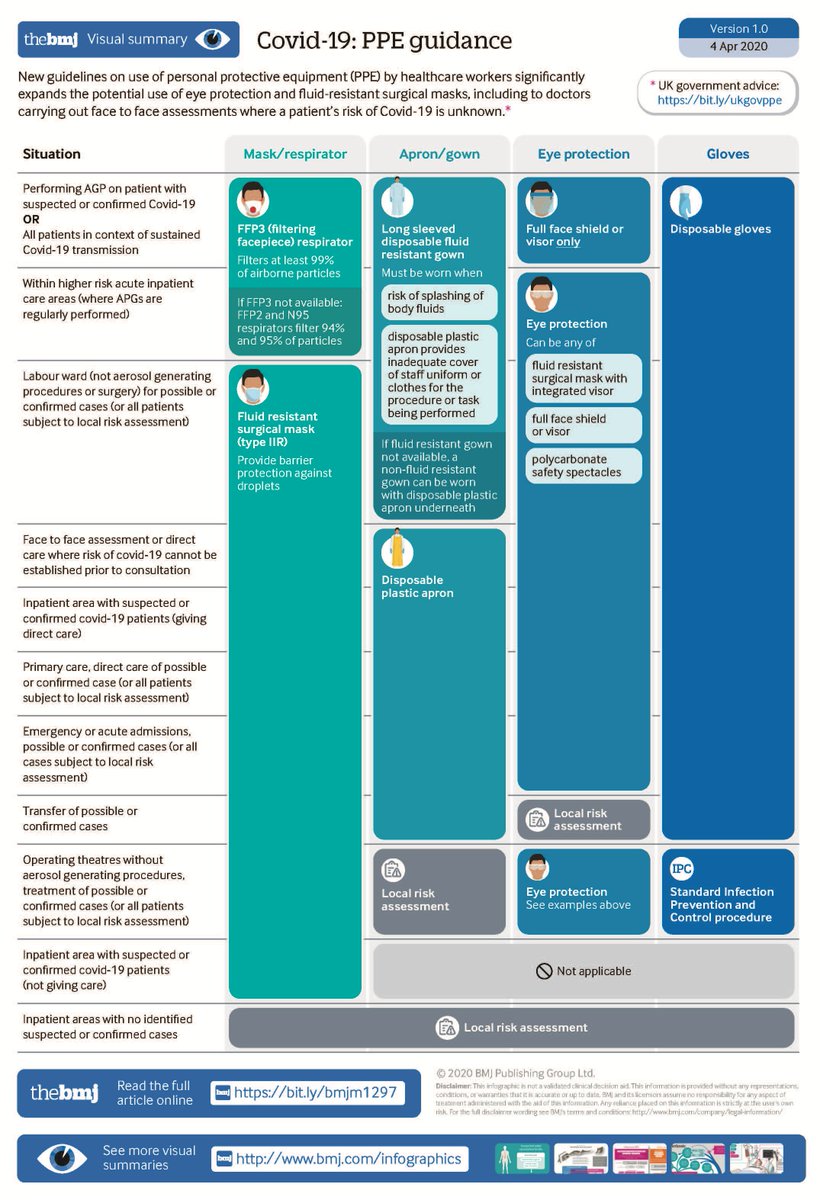
#BMJinfographic @PHE_uk have updated their guidance on PPE for #COVID19 We've summarised it into an infographic. Staff need proper protection from infection #properPPE@TheBMA
Read all #COVID19 content from The BMJ at https://t.co/QAvwlSwzxz
This is pretty amazing.
New York Times has been tracking every known coronavirus case in the US. They started this back in January with 7 cases. Now on more than 85,000 cases.
Today they’re making the live dataset available to the public: https://t.co/8C79Usdnja
I had very little to do with this graphic actually - @NickwickPapers did all the hard work - from sketching to layout and edits. Thanks for your hard work!
2 places still available for my workshop in Exeter at the weekend! Looking forward to exploring basic visual encoding with the attendees, and introducing them to some of the myriad different ways of making visual stories out of data.
Announcing a new data visualisation competition in healthcare: A collaboration between The BMJ, @NuffieldTrust, and @NHSDigital, invites contributors to create data visualisations of #NHS data exploring the theme of inequalities https://t.co/5RA7nnxx2K @will_s_t @jappleby123
So very excited that our competition is now live! Looking forward to seeing the creative talents of the dataviz community working on the health inequalities data that NHS Digital has collated for us.
Brief behaviour change strategies for distressed patients in primary care: This #BMJInfographic presents an overview of an approach for non-specialists to use in their consultation with patients in distress @will_s_t https://t.co/RZXP6glb0e
Global migration poses a unique and so far neglected challenge to progress towards universal health coverage, argues this #BMJAnalysis https://t.co/79Xgww144H
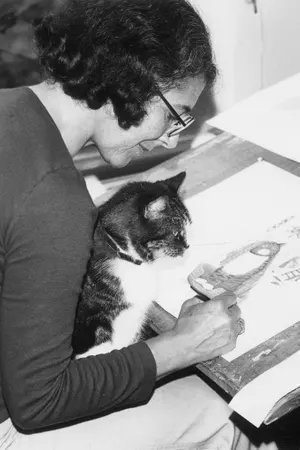
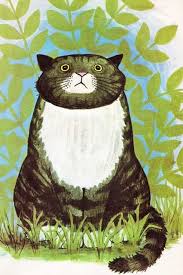
RIP #JudithKerr (1923-2019) UK writer and illustrator who created the 'Mog' series and 'The Tiger Who Came to Tea', also acclaimed novels such as the semi-autobiographical 'When Hitler Stole Pink Rabbit' inspired by her own family's escape from Nazi Germany #womensart
Great interactive piece of #dataviz by @DIEZEIT. Perhaps some issues with colour choices/groupings (going by the comments), but the visual and performance are both stunning! #EUelections2019 https://t.co/IcAbXdQliw
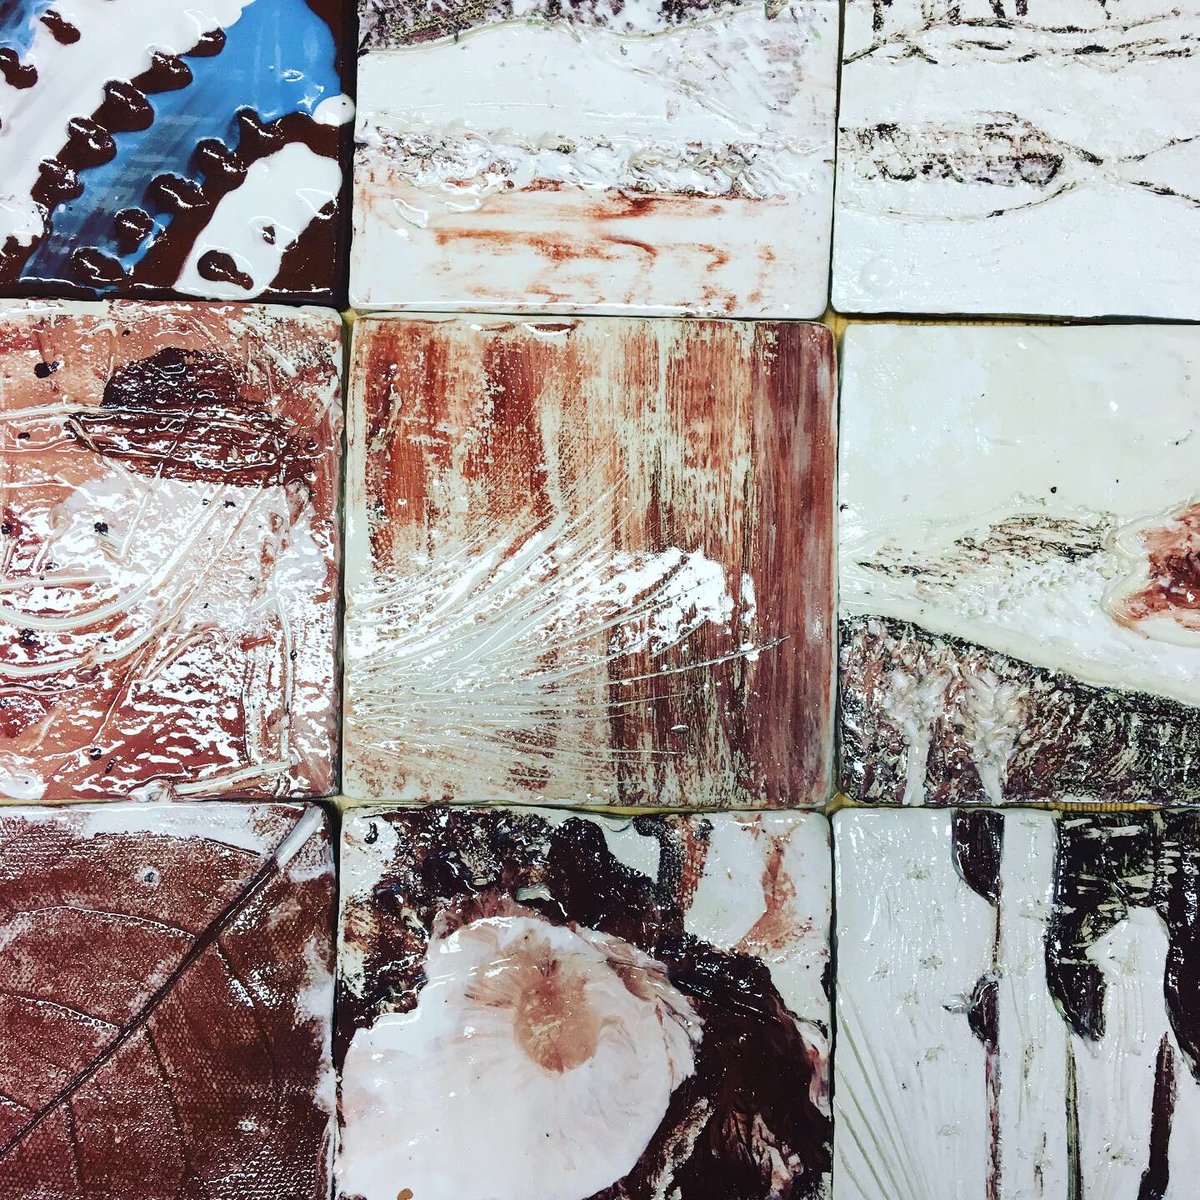
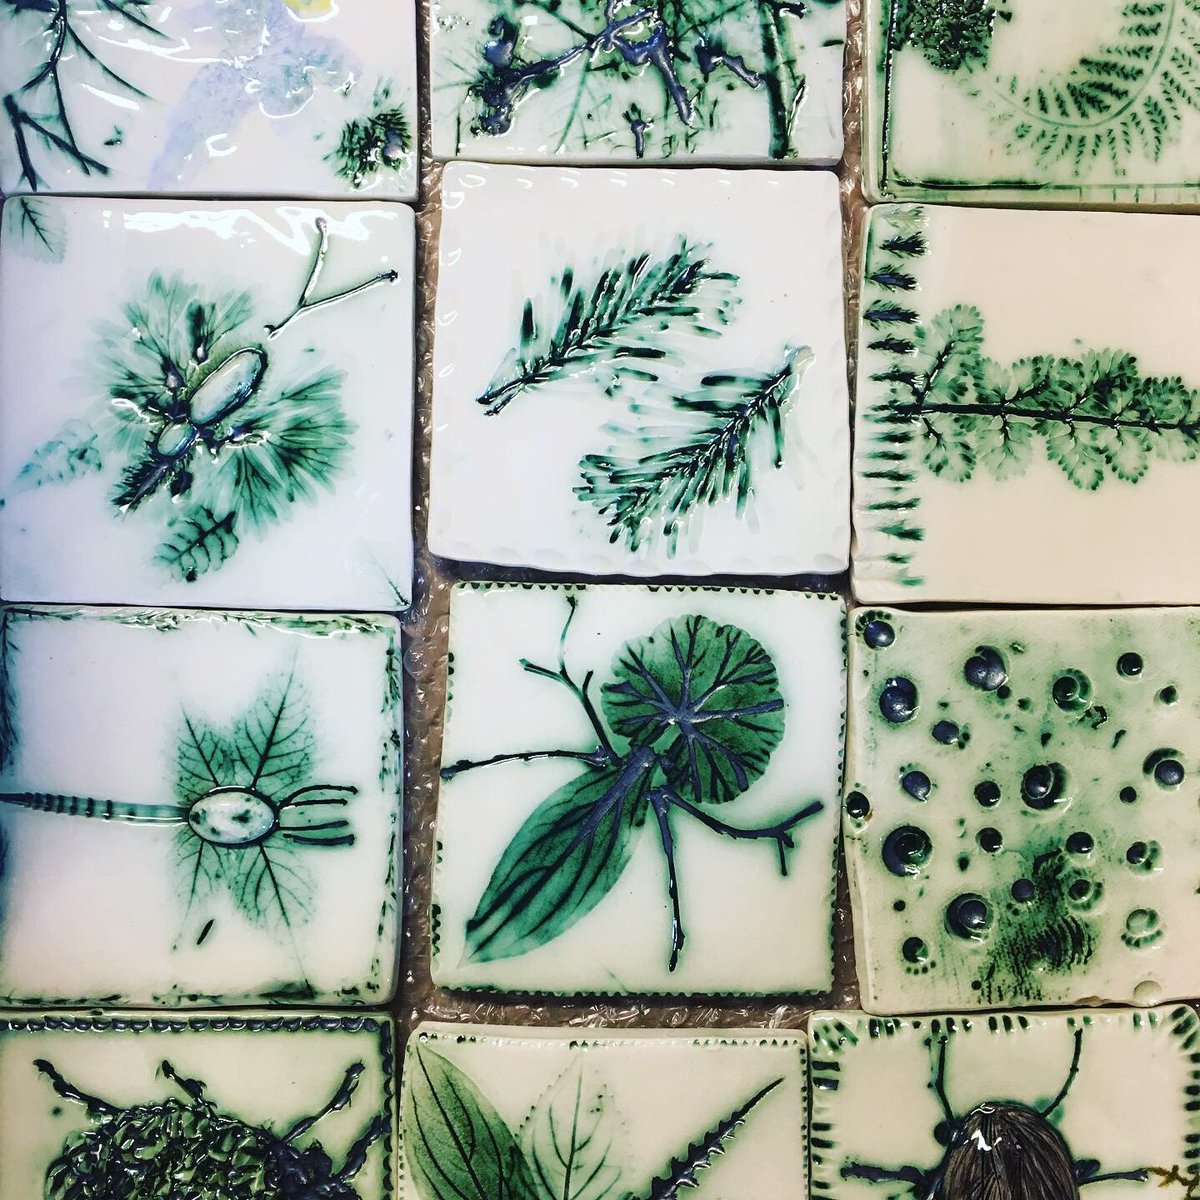
Check out these beuatiful tiles from our work with @leachpottery. They were made by kids with disabilities & their families, and will be displayed as part of our new show garden @The_RHS Hampton Court Garden Festival
Arrow plots with tooltips 😍 I think the visual design could be a bit better executed (colors, typo, symbols), but I'm in love with the idea. By @NatGeo, via @flowingdata: https://t.co/YiYhnvIy4c
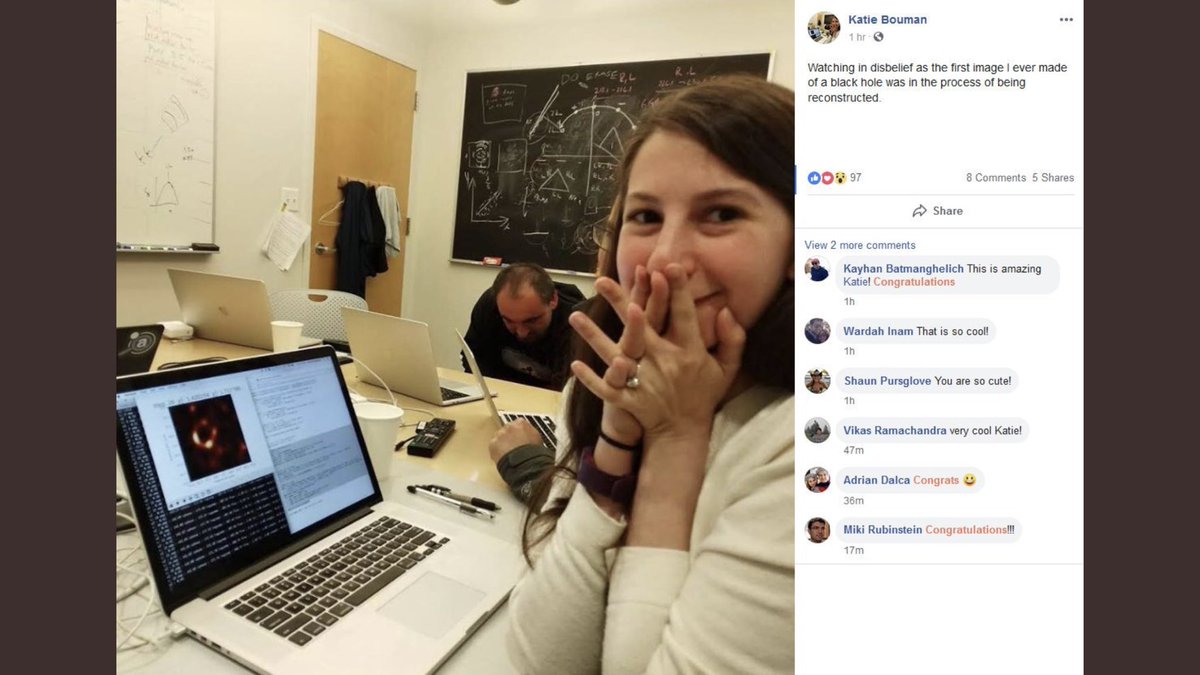
Congratulations to Katie Bouman to whom we owe the first photograph of a black hole ever. Not seeing her name circulate nearly enough in the press.
Amazing work. And here’s to more women in science (getting their credit and being remembered in history) 💥🔥☄️