When the VIX is high (30+), the next 12 months for the S&P 500 are historically much stronger. Volatility shocks create some of the best long-term entry points.
Since the launch of our trading strategy, the Nimbus Algorithm has delivered a significantly stronger performance compared to the S&P 500. Over the same period, the S&P 500 generated a return of 4.97%, while the Nimbus Algorithm achieved a return of 8.40%.
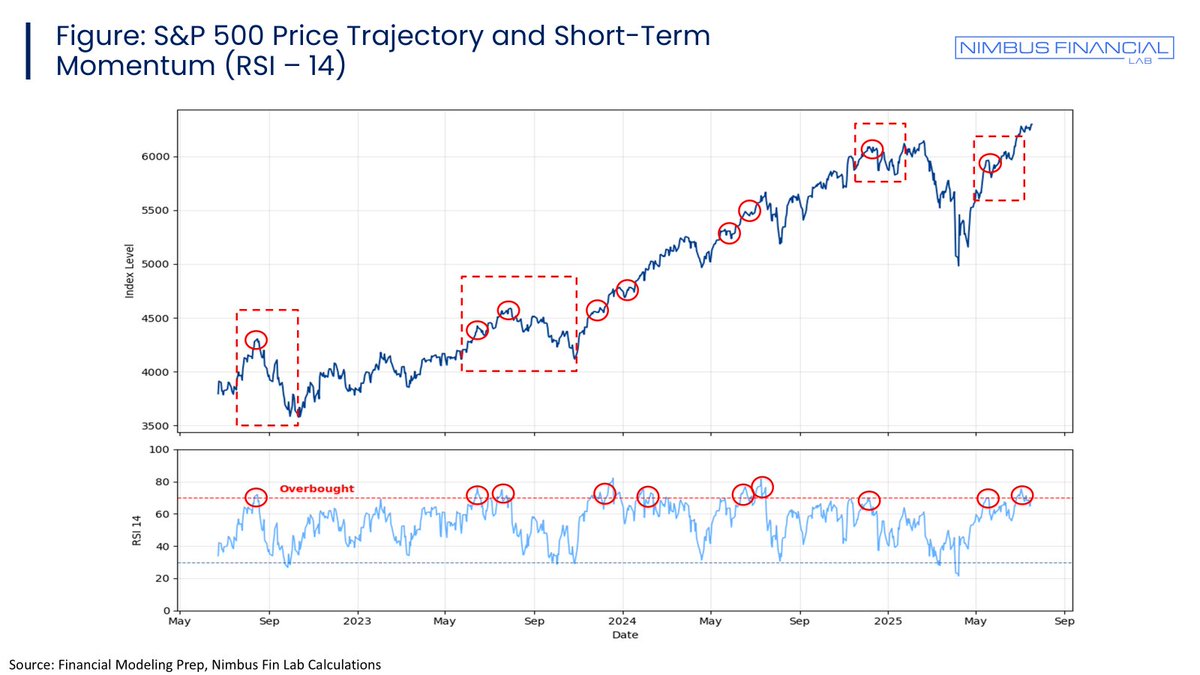
The figure below demonstrates that integrating momentum filters may improve timing for value investors. When the 14‑day RSI moves above a specified threshold, the S&P 500 often enters a brief consolidation or experiences difficulty sustaining further gains.
Despite the S&P 500’s limited uptick, a sectoral review indicates that the Technology, Financials, and Utilities sectors delivered comparatively robust performance over the week.
Despite the S&P 500 finishing essentially flat (+0.01%) this week, we saw a clear rotation under the surface. Tech and energy stocks powered ahead, offsetting weakness in financials and consumer staples.
Over the past decade, Information Technology has delivered the highest return among all S&P 500 sectors and with moderate volatility.
Meanwhile, Consumer Staples offered low risk but also low return, while Energy showed high volatility with limited upside.
“A blindfolded monkey throwing darts at a newspaper’s financial pages could select a portfolio that would do just as well as one carefully selected by experts.”
-Burton Malkiel, A Random Walk Down Wall Street (first published 1973)
S&P 500’s long-run uptrend tracks rising corporate profits. Both index and EPS plunged in 2008 & 2020 but rebounded fast—and record earnings in recent years have pushed the market to new highs. A key long-term driver to watch.
The S&P 500 climbed 3.4% this week, led by Tech and Communication Services. This heatmap highlights where strength and weakness clustered from June 23–27, 2025.
“Momentum Under Pressure: What Drove S&P 500 Stock Returns During the 2025 Market Dislocation?”
You can access our report via the link below 👇
https://t.co/GbSV722TIQ
The chart below illustrates the relative performance of sector indices composed of S&P 500 constituents. Over the long term, only three sectors—Information Technology, Consumer Discretionary, and Health Care—have outperformed the S&P 500 index.
The leverage effect is the tendency for volatility to rise more after a price drop than after a similar-sized gain which is a key feature of financial markets first observed by Fischer Black (1976). The chart illustrates this phenomenon using the S&P 500 and its volatility (VIX)
Even with robust academic support for momentum strategies, one key concern for practitioners remains: how stocks, especially momentum stocks, behave during episodes of systemic market stress states. A detailed report addressing this will be released this week.