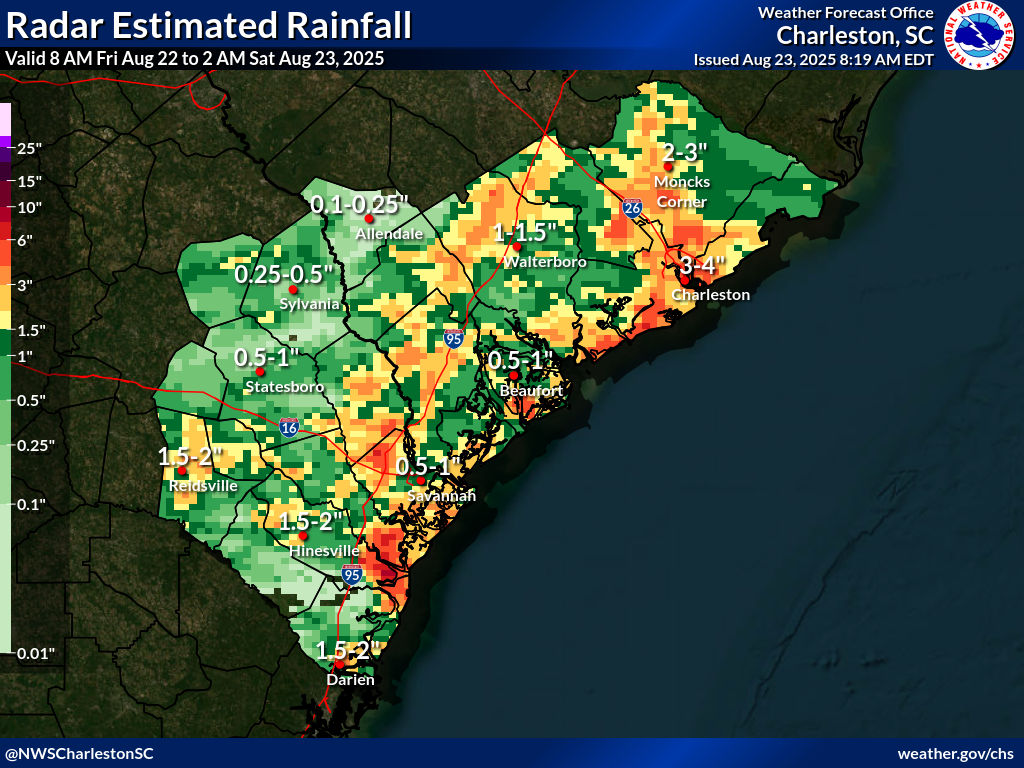
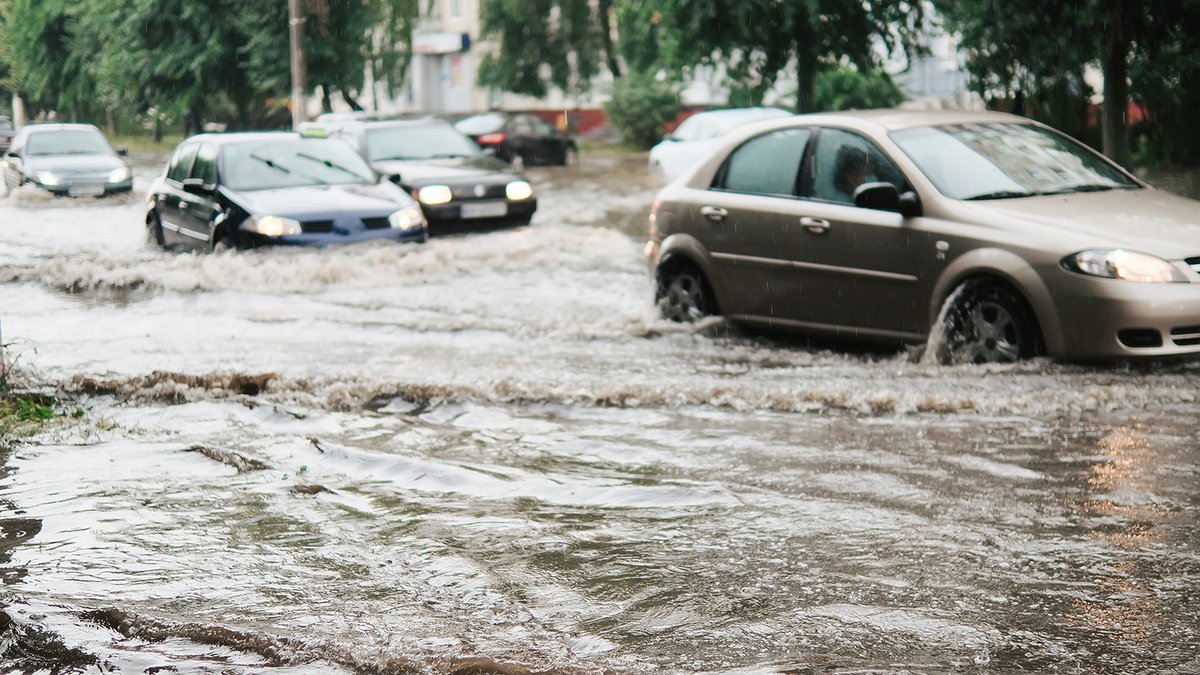
🌧️ Radar Estimated Rainfall 🌧️
From 8 AM Fri Aug 22 to 2 AM Sat Aug 23, some areas observed 6 to 9 inches of rain!
We'll post observed totals around 10 AM.
Do you have reports? Let us know much and where it fell! #scwx#gawx
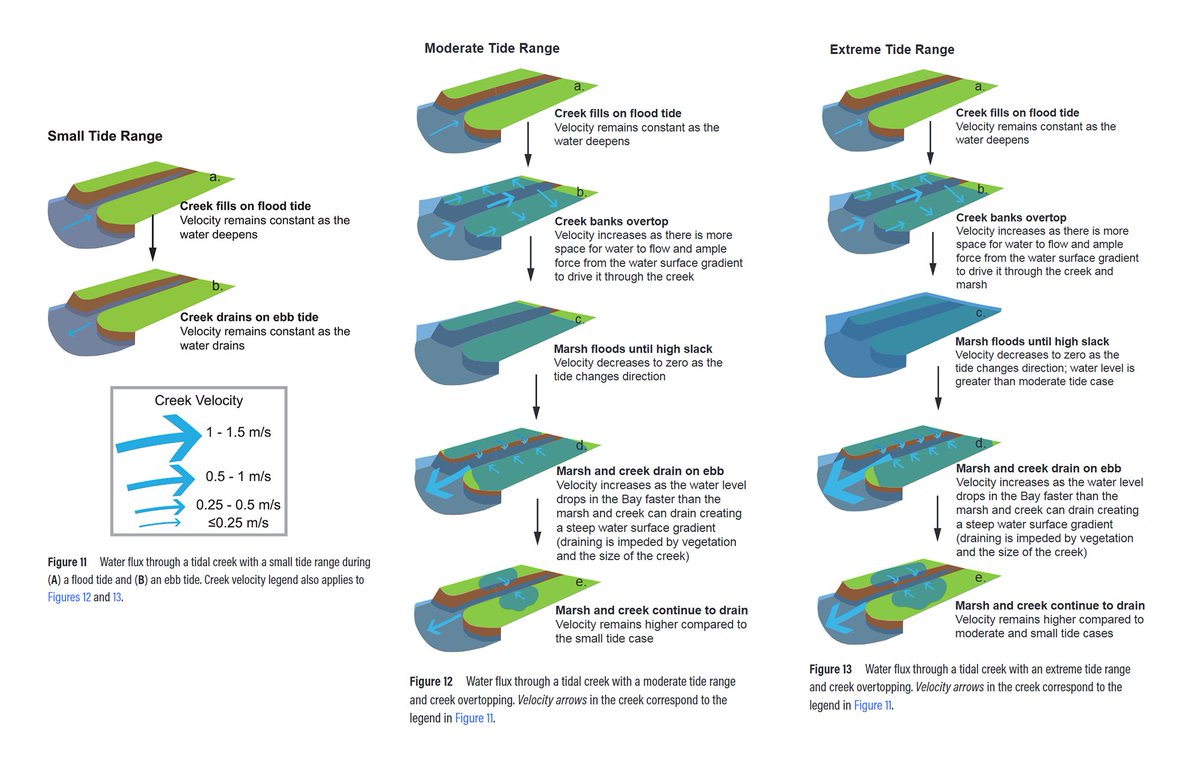
📢Just published by @UofNO, @USFCA, SF Bay National Estuarine Research Reserve, @USGS, @SFBCDC 📢 - Marsh Sediment in Translation: A Review of Sediment Transport Across a Natural Tidal Salt Marsh in Northern San Francisco Bay https://t.co/IJ0JjsnehT
📣 Exciting News! I'm thrilled to announce the release of my new book: Introduction to GIS Programming: A Practical Python Guide to Open Source Geospatial Tools!
Unlock the power of geospatial data with Python! This hands-on guide is crafted for both beginners and intermediate users eager to dive into spatial analysis and interactive mapping using open-source tools. Inside, you'll find practical examples that teach you how to work with real-world data while developing essential skills in Python programming, vector and raster analysis, web mapping, and cloud computing.
Whether you're a student, researcher, GIS professional, or data scientist, this book will empower you to tackle geospatial challenges with confidence.
✨ What’s Included:
All code examples are freely available.
Access to 26 hours of free video tutorials to complement your learning.
📚 Explore More:
Book Website: https://t.co/CQa04UhCBV
GitHub Repository: https://t.co/K1OzCNWvmX
Video Tutorials: https://t.co/KpyX8mx5rU
Special Offer: Purchase the PDF version (553 pages) for just $25 until July 4. After that, the price will increase by $5. Grab your copy here: https://t.co/lr2wwsPcQf.
📖 The color print version will also be available soon on Amazon—stay tuned!
#geospatial #opensource #GIS #Python
🚨Free access to @SODaramola’s latest research is available now! Check how customized deep learning architectures 🤖 can learn (and predict) compound flood dynamics 🌊 in space🌌 & time⏳for multiple cyclonic events🌀⛈️ https://t.co/8OWxeorleM @VirginiaTechCEE@bamaengineering
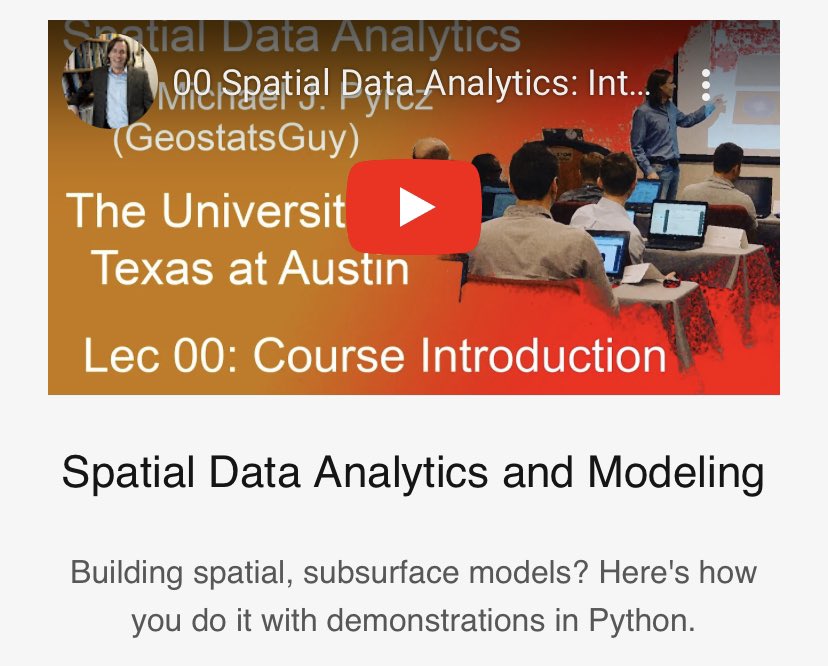
I’ve made all my university courses available as playlists on #YouTube with links to the full content in my free, online e-book! 📚✨Check it out here: https://t.co/Hp98VvXdiR
As a professor, I’m dedicated to sharing knowledge and making learning both accessible and actionable for everyone! 🎓🌍
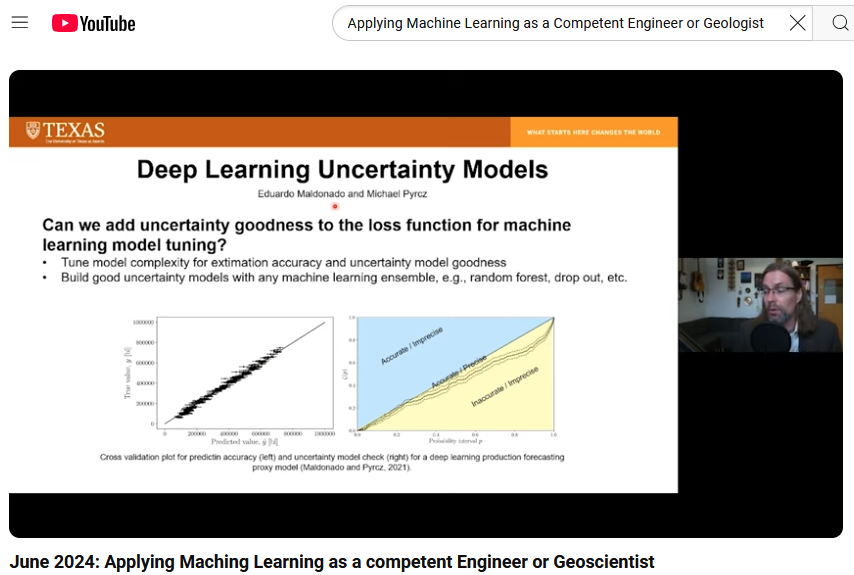
How do we apply #MachineLearning & #AI as competent, professional engineers or scientists?
I’ve been reflecting on this critical topic and would like to share some of my thoughts based on decades of experience with #DataScience for modeling the subsurface.
I’ve discussed this further in a recent video on #YouTube @
https://t.co/To24J1S349 ∀.
A heavy downpour can ruin the day for many coastal communities, causing flooded roads & power outages. @CEEatGT's Iris Tien is working to tame the flood, giving coastal areas data to put the right flood control infrastructure in the right places. Dive in: https://t.co/vDQXWKKsK4
📢 My short course "An Introduction to Risk and Reliability Analysis in Coastal Engineering Designs" covers #risk concept, probabilistic design, and #reliability-based design optimization with applications in #coastal engineering.
📥 Download: https://t.co/mSkWIt6MY9
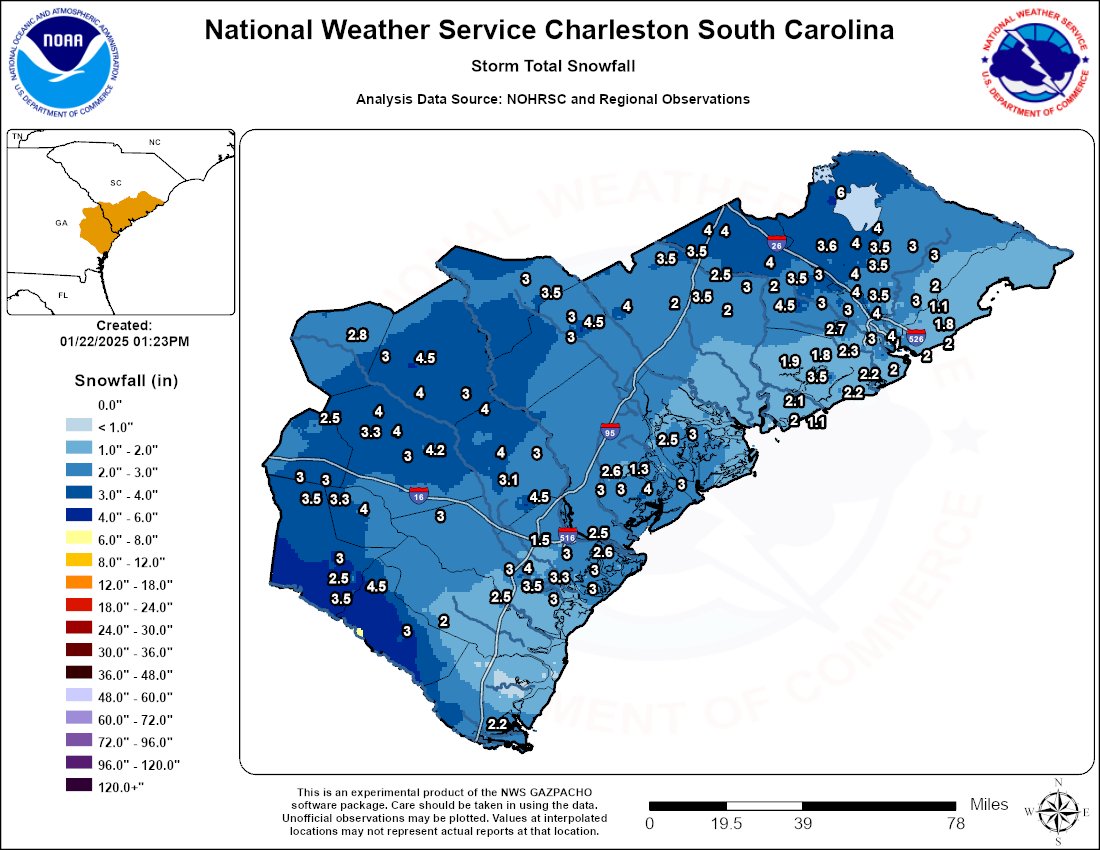
Looking at snow reports we find that much of the area got about 3-4” of combined sleet/snow accumulation. You can see where the sleet really cut into the totals in northern Charleston County and into the Sea Islands and West Ashley.
U.S. River Conditions from October 1, 2024 to December 31, 2024 at @USGS#streamgages 💧
River conditions range from driest conditions at a gage (red open circles) to the wettest (blue closed circles). A purple outer ring indicates flooding.
https://t.co/7ZLfVjrgXW
#rstats
Looking to add statistical insights directly to your ggplot2 visualizations? The ggstatsplot package simplifies this by incorporating statistical tests, effect sizes, and other analyses right within your plots.
✔️ Enhanced Visuals: Automatically includes statistical information in your plots, providing clear insights without the need for extra steps.
✔️ Wide Range of Analyses: Supports various statistical tests, including t-tests, ANOVAs, correlations, and more, making it versatile for different types of data sets.
✔️ Customizable Output: Lets you control which statistical details are displayed and customize the appearance of plots, ensuring clarity and focus on key findings.
✔️ Seamless Integration: Designed to work directly with ggplot2, using the same syntax and functions you’re already familiar with.
The visualizations shown here are from the package website and demonstrate how ggstatsplot integrates statistical results seamlessly into ggplot2 graphics: https://t.co/kQ1KUseS6u
Want to deepen your knowledge of ggplot2 and learn how to create informative visualizations? Join my online course, “Data Visualization in R Using ggplot2 & Friends!” More information: https://t.co/ztlEzoEDWv
#StatisticalAnalysis #coding #Data #VisualAnalytics #ggplot2 #datastructure #datavis #RStudio #Rpackage #tidyverse #RStats
Today, as we remember Jimmy Carter, we also remember his impact on water resource management. His administration brought environmental concerns to the forefront of managing water flow in the U.S. To learn more about Carter and his water legacy visit: https://t.co/9x4sNAqMm6
.@thats_me_del_p@UofAlabama & others show stream networks in the Mobile Bay watershed are much more complex than shown on USGS maps. Comments from Adam Price @forestservice, story by Mark DeGraff.
https://t.co/SQozf0jiLx
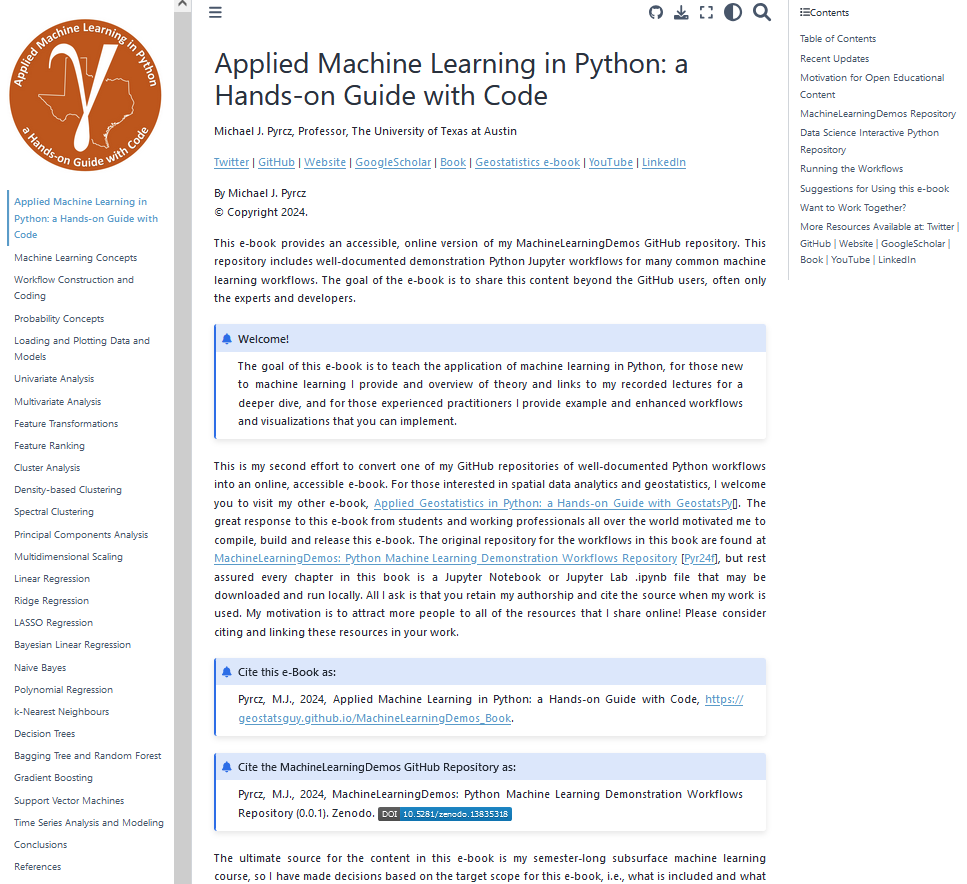
Getting started with #MachineLearning? Or are you an expert seeking a practical resource to refine your skills?
I’m excited to share my free online e-book:
Applied Machine Learning in Python
📘 What you'll find inside:
1. Clear explanations of theory
2. Best practices for applied machine learning
3. Step-by-step demonstrations in Jupyter Notebooks
This resource is designed to help you learn, experiment, and succeed—whether you're a beginner or an experienced, student or professional!
🔗 Check it out today and take your machine learning journey to the next level! 🚀
https://t.co/pq4eWwjPQQ ∀ #DataScience
To help my students learn Artificial #NeuralNetworks, I developed my own custom-coded network that includes:
1. Weight Initialization
2. Forward Pass Calculation
3. Error Backpropagation
4. Weight Updating
Now, when I teach how to train a neural network, my students can interact with the model, experimenting with each step in the process and gaining a hands-on understanding!
I've shared this project on #GitHub to make it accessible for everyone 🚀 @ https://t.co/XDrEp91GZA ∀. #DataScience #MachineLearning
📢 Introducing hyswap package for hydrologic data - @USGS just released hyswap, a new open-source python package for hydrologic #dataanalysis and #dataviz.
Read our blog entry - https://t.co/foM5NgJBDe
Download the package - https://t.co/0aSayz9vdf - and start using it today!
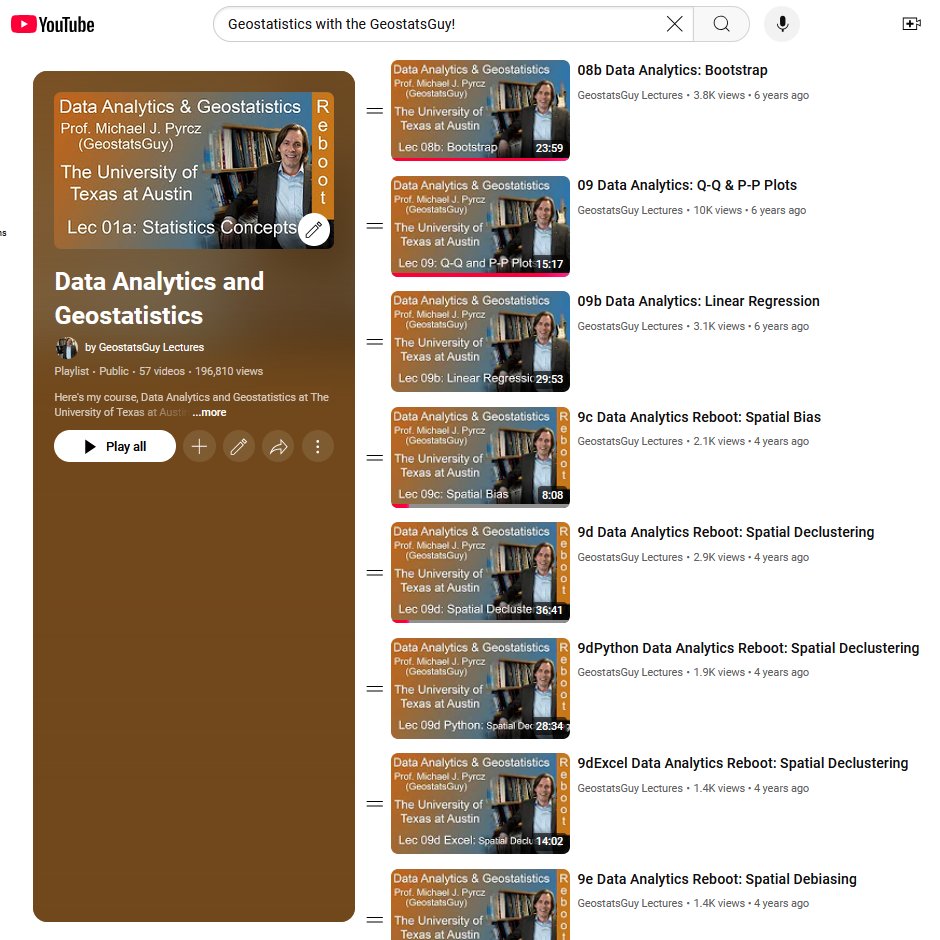
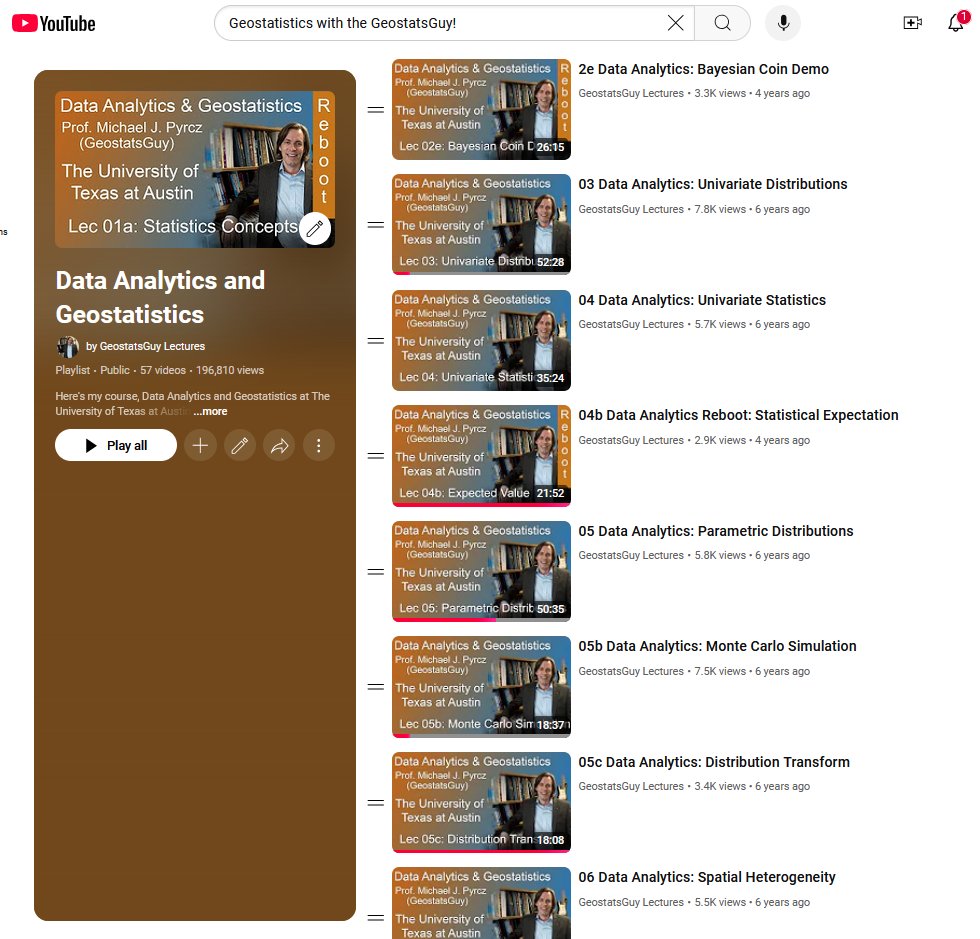
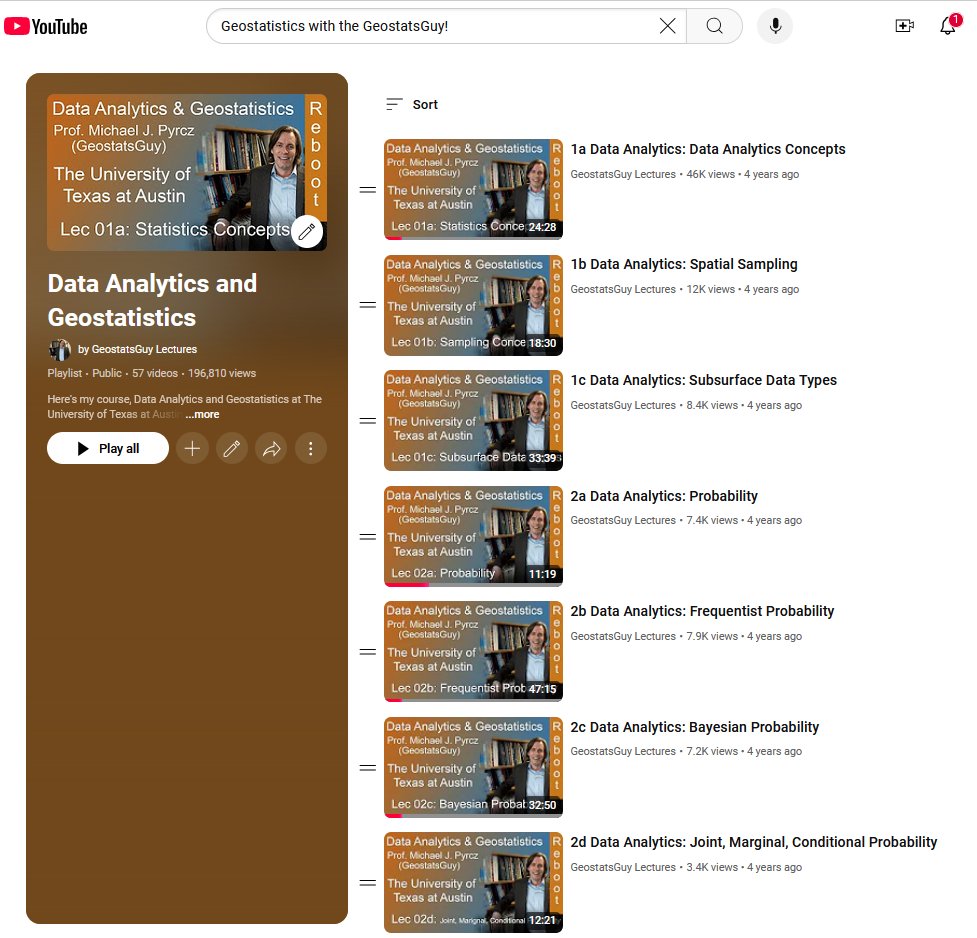
Do you know that I share my entire #DataAnalytics and #Geostatistics university course free for all online?!
All my lectures are organized on #YouTube with links to:
1. well-documented demonstration #Python workflows, 2. interactive dashboards
3. datasets for demonstrations
4. NEW - free, online e-books!
I'm stoked to help you learn, because...
...the most important societal challenges are spatial and we need many to understand spatial #DataScience to solve them!
Get started at https://t.co/5wqw5vMbLN ∀. Stoked!