You have to feel sorry for the thousands of first home buyers across Australia about to become trapped in negative equity.
So many of these buyers bought overpriced properties from investors right at the top.
Now even legacy media have started to run stories on this.
The next 6 months will be interesting…
@beerzy99@respeculator Idiot, Companies still front capex/exploration and bear the risk. Norway gives cash refunds on 71.8% of the tax value of losses the next year, not the full cost. That’s not ‘funding’ it, just tax design. Cope for why Australia captures far less revenue.. that’s the real issue.
@beerzy99@respeculator High royalties and taxes have not deterred investment in exports from Norway and Qatar and they have tens of billions more income and Norway athe world’s largest SWF because of it.
XLP vs the NASDAQ is one of those charts that quietly tells you what kind of market you’re actually in.
You’re basically looking at Consumer Staples (defensive) measured against NASDAQ (growth).
And the first thing that jumps out: this ratio is down at levels we haven’t seen since March 2000.
That matters, because staples have been underperforming the NASDAQ for about 23 years — which makes sense. Most of that period has been a growth-led, expansionary environment. Growth wins, defensives lag. Simple.
But here’s the part people forget…
When staples do start outperforming the NASDAQ, it usually isn’t during the “good times.”
Look at the windows where staples led:
2000 to 2003
2007 to 2009
Those weren’t expansion phases. They were contraction-type periods — tightening, stress, bear markets, “preserve capital” environments.
Now come back to today.
We’ve got staples sitting at a generational relative low… and we’re starting to see bullish divergence in the ratio, plus STOCH RSI flipping.
That’s not some magic signal on its own. Ratios can stay oversold forever.
But when you see:
a multi-decade extreme,
a clear loss of downside momentum (divergence),
and then a momentum flip (RSI),
…it’s usually the early sign that leadership is starting to change.
And here’s the bigger point: it’s not just staples. If you’re seeing similar behaviour in other areas (like I mentioned with energy and materials), it stops looking like a one-off and starts looking like a theme.
So what phase are we in?
Not “full contraction” necessarily — markets don’t switch like a light. But this looks a lot more like late-cycle / transition than it does “fresh expansion.”
It’s the sort of behaviour you see when the market is quietly rotating away from pure growth leadership and starting to pay up for resilience.
Keep an eye on if growth leadership starts thinning out under the surface and breadth narrows and volatility starts picking up. If those line up, the chart isn’t a coincidence — it’s a message.
And the market usually tells you the story in relative strength before it shows up in the headlines.
Is this all coincidence or is the market starting to tell you a story?
“Bitcoin Capitulation: The Call I Made to the CEO of MicroStrategy Before the Fall”
I haven’t spoken about crypto since October last year because, quite simply, there’s been nothing to talk about. It’s been in a bear market, in a clear downtrend, and not something I’ve been interested in.
What I want to flag now is this: we’ve finally entered a zone where I am getting interested in for some sort of bullish reaction.
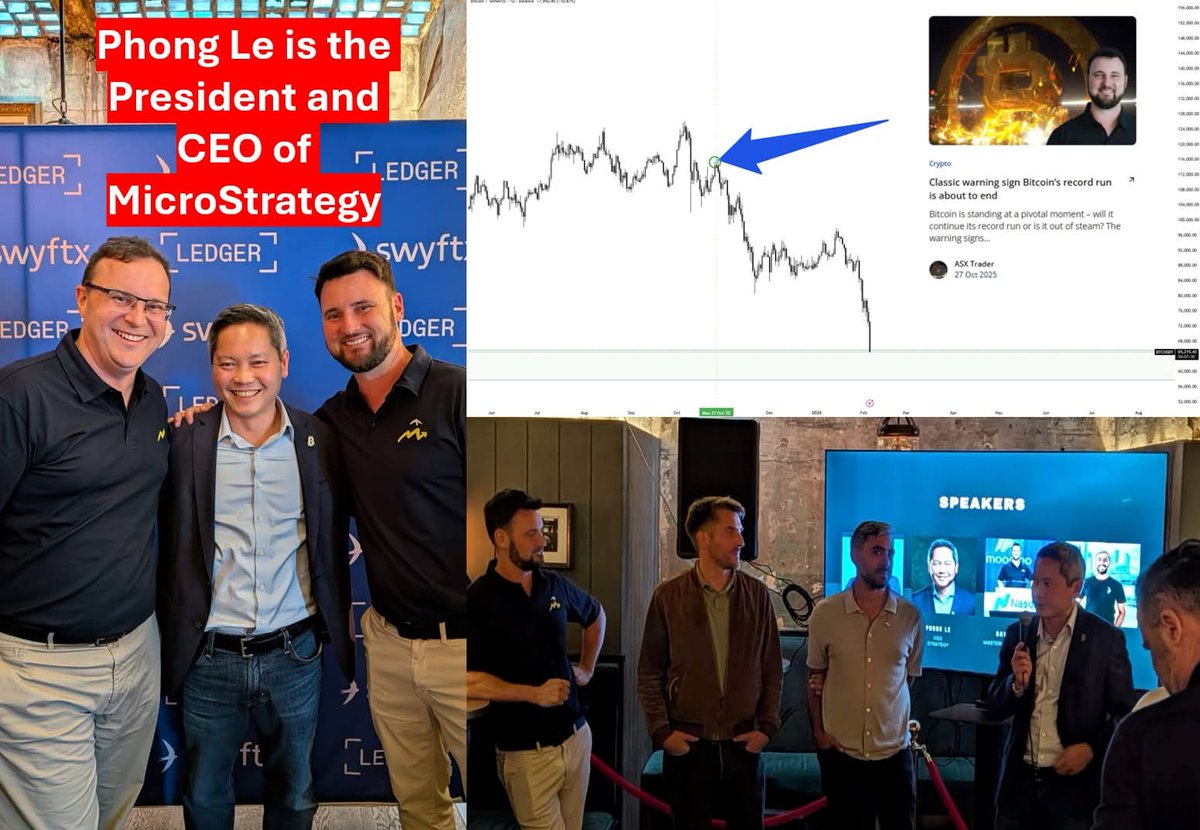
On the 27th of October 2025, when Bitcoin was trading around $116,000, I called the major rollover and said my bullish option target was the 60–70K zone. We’ve now just hit that level.
The other photo you’ll see is from November, when I was on stage with Phong Le, the President and CEO of MicroStrategy. Back then, I spoke openly about my expectation that Bitcoin would trade below 70K, because that’s where capitulation happens. That’s where you start seeing major fear-driven headlines—MicroStrategy turning a multi-billion-dollar profit into a multi-billion-dollar loss, widespread panic, and negative media sentiment.
You can already see that fear building now. In fact, I discussed this earlier in my NewsCorp article when I called the top on BTC:
https://t.co/EQpI8CM8UI
At the time, Phong Le wasn’t exactly thrilled with that view—but it wasn't opinion it was data.
Importantly, this zone represents my bullish option. That does not mean the bottom is definitely in. It means that if a bottom forms, this is where it should happen. If it doesn’t hold, then the next downside zone sits much lower, roughly between 35K and 55K. From here, it’s simply a matter of waiting for confirmation from the data.
Those in the Academy know I haven’t touched crypto for a long time. The message has consistently been “get out.” Even in that recent YouTube video, I showed how the move from 80K to 97K was just a corrective rally, and that the optimal short was around 92K—which would be working very well right now.
Which you can watch here:
https://t.co/vO0u42jwqW
So where are we now? We’re finally at the level that matters.
If a buy signal comes in, I’ll let you know. Until then, what you’re watching for is extreme fear: maximum negative headlines, widespread panic, and then the data starting to do the opposite—shifting market structure and confirming a turn to the upside.
It’s all about knowing the zones and letting the data do the talking.
Four years ago I warned that the Nasdaq was heading into a bear market, and it ended up falling 38% that year. I’m starting to see a similar “big picture” setup forming again, and 2026 looks like a possible year for a major market top. The only thing I’m unsure about is when—it could be earlier in the year (around April) or later (around October).
Markets often don’t top quietly. Before a major peak, they usually go through a “blow-off” style phase where prices run too far too fast, confidence gets loud, and the move feels unstoppable. That’s why patience matters—I’m watching for signs that momentum is starting to weaken and the structure is beginning to change.
Here’s the main idea: I don’t think the next downturn will be a normal pullback like 2022, or a quick bear market. If this plays out, it could be the peak of the whole move that started after the GFC—meaning we could be correcting a 20-year bull market, and it might take many years to get back to those highs.
How I’ll trade it: the big macro view gives the direction, but the actual decisions happen on the smaller timeframes. Once the larger setup is in place, I’ll look for lower timeframe bearish signals to confirm it—then I’ll be taking significant profits across a big part of my accounts.
A drop in price alone won’t shake people out anymore. Investors have been trained to “buy the dip” because it’s paid off over and over. People have now been programmed.
If anything forces capitulation now, I think it’ll be time: a long, frustrating grind that wears people down.
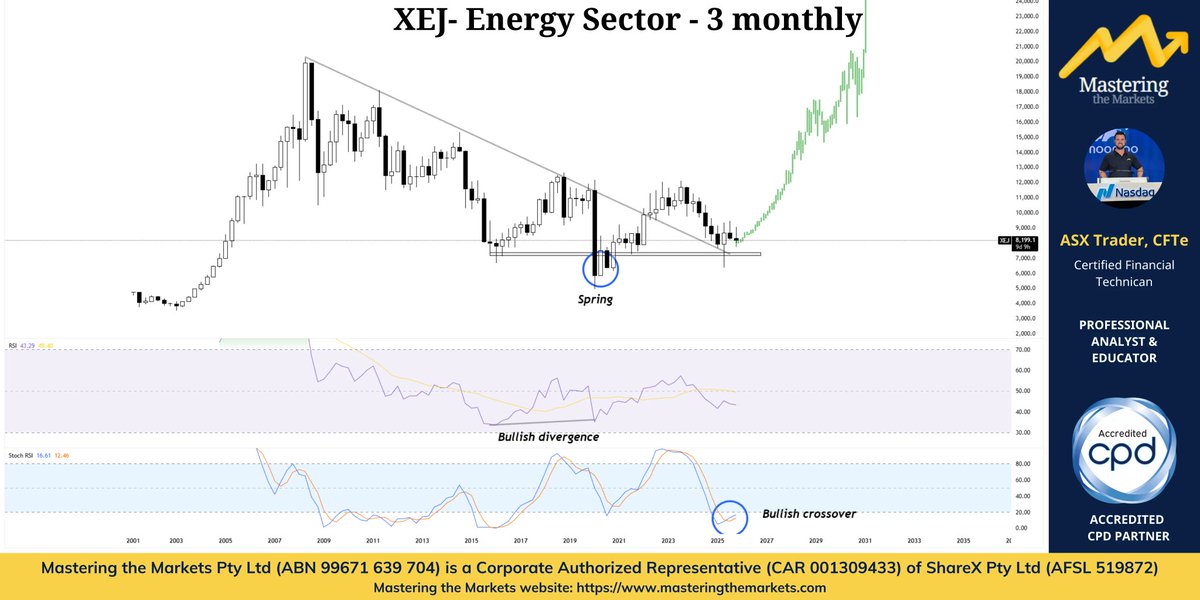
Did you know the Australian energy sector has been in a bear market since 2008?
That’s an 18-year bear market.
Here’s what most people miss: sectors aren’t like stocks — they don’t go down forever. A sector can’t stay hated indefinitely.
Sectors are macro-driven.
From 2008 onward, the macro backdrop for energy was brutally negative: deflationary forces, excess supply, weak pricing power — constant headwinds. That’s why the sector bled for nearly two decades.
But macro regimes change.
We’re now moving into an inflationary environment that is likely to last for decades — something I’ve been talking about for a long time. And energy is becoming the backbone of AI. Historically, inflationary regimes are where the energy sector does extremely well.
Look back at the 1970s and 2000–2010 — the last true inflationary cycles. Energy massively outperformed.
So where are we now?
The energy sector today is effectively back in 2005.
It’s like going back 20 years and buying the sector.
That’s how undervalued it is.
That’s how cheap it is.
The sector bottomed in 2020 and has since put in a Wave 2 low around current levels. And if you understand market structure, you know what comes after a Wave 2:
Public participation.
This is the same setup as when I bought gold in October 2023 at $1,800.
The same setup as when I bought silver in the low $20s.
At first it’s a slow grind.
It’s not exciting.
No one’s talking about it.
And no one is going to pat you on the back for being early — just like they didn’t on gold and silver.
That’s exactly when it’s right.
Because by the time everyone is rushing into it — like they’re doing with precious metals now — the real money has already been made.
Energy is setting up the same way.
If your eyes aren’t on it, it’s because institutional money doesn’t want you there yet.
They will in 2026.
Watch and learn.
@TheJeffPutnam Honestly think he tried to pull the trigger, but wasn’t loaded and he didn’t know how to rack it. Also we don’t know if it had ammunition.
@harry2handsome @Sm137023 lmao
You have no idea where that car has been
What they’ve seen
If those members in that car were engaging in the gun fight off camera or not
Go back to batting off to child porn you fat miserable cretin
A Big Salute to this Real Life Hero.
A bystander rushed to the shooter and disarmed him. Saved lives of Many.
He deserves all the respect and honour for his unmatched courage and response.
#Bondi#sydney#Australia
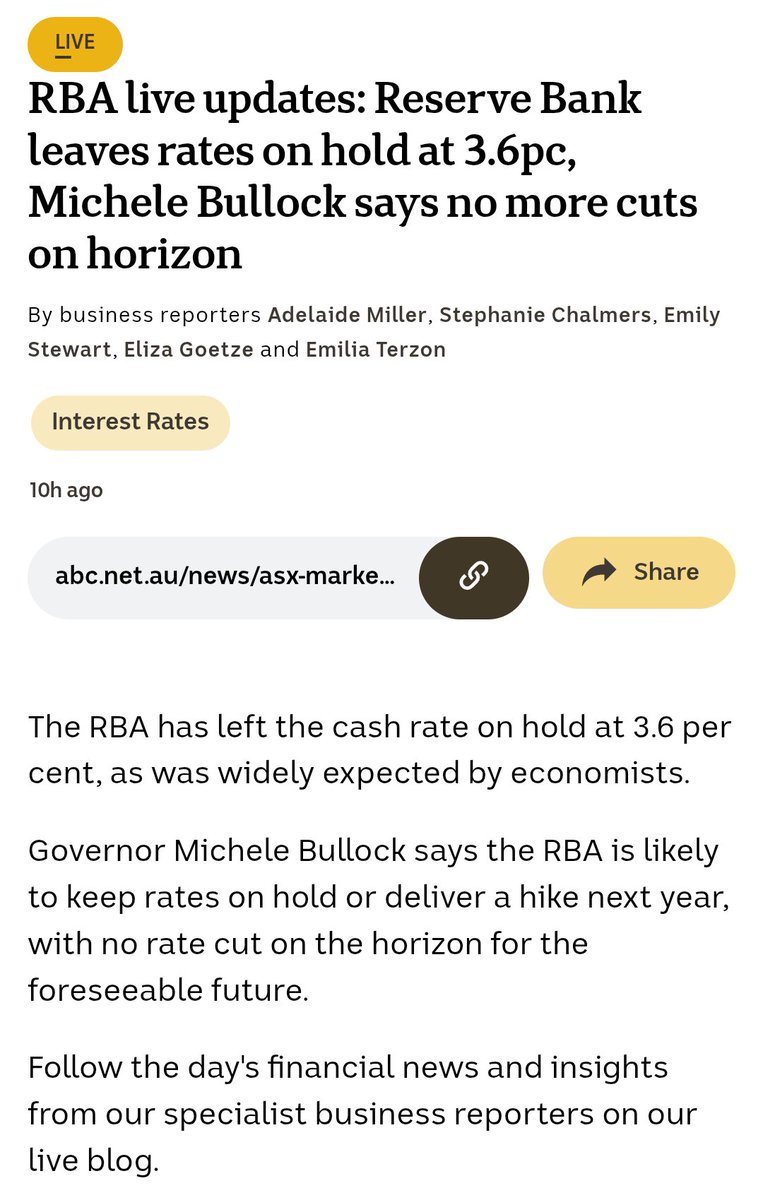
The RBA has held the cash rate at 3.6%, and Governor Michele Bullock has flagged no cuts on the horizon with a possible hike next year so the “cost of money” stays tight, making the bond market’s signal even more important right now.
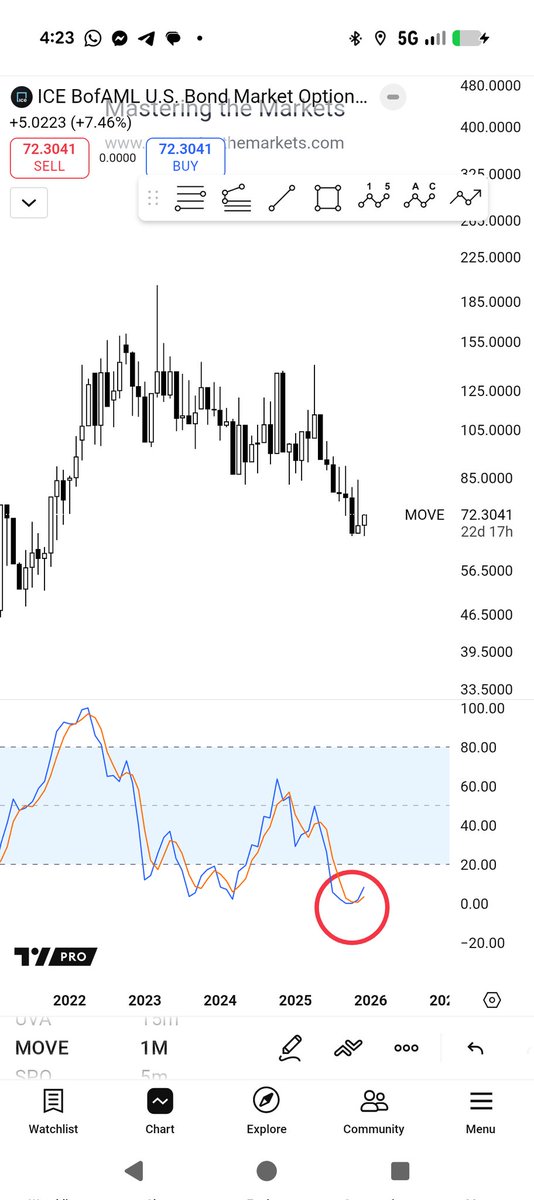
MOVE Index (Bond Volatility): Why I Watch It
Most beginners watch stocks and crypto first, but professionals know that the bond market often moves before everything else. That’s why I watch the MOVE Index and why I loved that our partners at Ainslie Bullion covered it in their monthly session with MtM students.
The MOVE Index measures the market’s expected (implied) volatility in US Treasury yields across the yield curve. In simple terms, it tells me when interest rates are calm vs wild.
What MOVE tells us
MOVE down = calmer rates → markets usually trend cleaner
MOVE up = bigger rate swings → markets usually get choppier and more “risk-off”
US Treasuries are used as collateral to borrow cash in the repo market.
When MOVE is low, Treasuries look “safer” → borrowing is easier
When MOVE is high, lenders increase the haircut → you can borrow less against the same bonds
When house prices are stable, banks lend a higher %. When risk rises, they lower the loan-to-value ratio. That buffer is basically the same idea as a repo haircut.
What it means for interest rates
MOVE doesn’t tell me where rates will go — it tells me how violently they might move. Rising MOVE = the market is pricing bigger swings in yields (more uncertainty).
If MOVE has a violent bullish spike (big jump up)
That usually warns me of stress or surprise in the rates market (inflation shock, growth/credit fear, policy uncertainty, or liquidity tightening). Translation: expect bigger swings in rates, which often means more volatility in stocks and crypto and more fragile rallies.
The technicals I’m seeing right now (Monthly)
On the monthly, MOVE has been extremely oversold and I’ve just seen a massive bullish crossover. If MOVE now makes a violent bullish move up, that’s my signal the market is bracing for large, fast swings in interest rates and I’ll expect tighter conditions and higher volatility across equities and crypto, so I stay sharp and manage risk first.
“When the cost of money gets unpredictable, everything else starts to wobble.”
We’re dropping the full Phase 1 details for the Asynchronus Prediction Agent
Phase 1: Pure Late-Stage Sniping
→ 24/7 monitoring of every market
→ The second any outcome hits 95–99.9% → instant buy of the winner at 1–5¢
→ Locks 1–5% profit in minutes, virtually zero risk of flipThis is the exact edge whales have been quietly farming $50k–$200k+/month.
One wallet did $127k in November manually. We’re automating it completely.
Backtested +11.4% in 7 days (simulated $25k).Phase 2+ will stack LPing, cross-platform arb (Kalshi), delta-neutral hedging, and more strategies.
$ASYNC Making big claims for its product launch 11% in 7 days on autopilot with little to zero risk… and just the start of what they are promising for capabilities.
Back in at 300k
50k investment at 20% is 10k a month.
Thats life on autopilot.
Autonomous agents are the future @Asynchronus_ai