CONVERTÍ MI ORDENADOR EN UNA MESA DE TRADING QUE NO DUERME NUNCA
6 agentes de IA. 46 operaciones anoche. +$4.955.
Seis agentes con nombre propio, metidos en un chat de grupo, hablando entre ellos como una mesa de trading de verdad.
Lo que ves en el vídeo es la sala a las 7 de la mañana:
1. ATLAS ve una wallet grande entrando en $RBNX en Robinhood Chain y avisa a ORION.
2. ORION monta la tesis, decide el tamaño y se la pasa a TITAN.
3. TITAN prepara la orden.
4. NOVA verifica contrato, liquidez y límites.
Y la orden se queda ahí, en rojo, esperando.
Porque por mucho que los seis estén de acuerdo, no entra ni un dólar hasta que lo apruebo yo.
El equipo:
→ ATLAS vigila wallets grandes
→ VEGA caza picos de narrativa en X antes de que exploten
→ ORION construye la tesis
→ TITAN y LUNA ejecutan
→ NOVA lo revisa todo antes de que avance
Claude Code piensa. Codex ejecuta. Grok Build vigila.
La regla es simple.
Las salidas y los stops van solos, toda la noche.
Las entradas pasan por mí.
Me despierto, abro la sala, leo la conversación entera y apruebo con un mensaje.
Nadie copia y pega nada entre terminales. Se pasan el trabajo con un @, igual que en Discord.
Todo esto corre en Alook AI.
Es open source y los agentes siguen en mi propia máquina, con mis archivos.
Lo que parece un chat es una mesa de trading entera convertida en software.
Enlace al repositorio: https://t.co/cGjqxlo31n
How do you watch perps vs. spot behavior?
What platforms do you use?
Why is it beneficial to watch this?
What does it mean?
Get asked this under every tweet so please just bookmark this long tweet.
This is probably the best detailed explanation of this you will find on here with nuances.
Here's the overarching answer.
If we break it down, what I like to keep an eye on is the following:
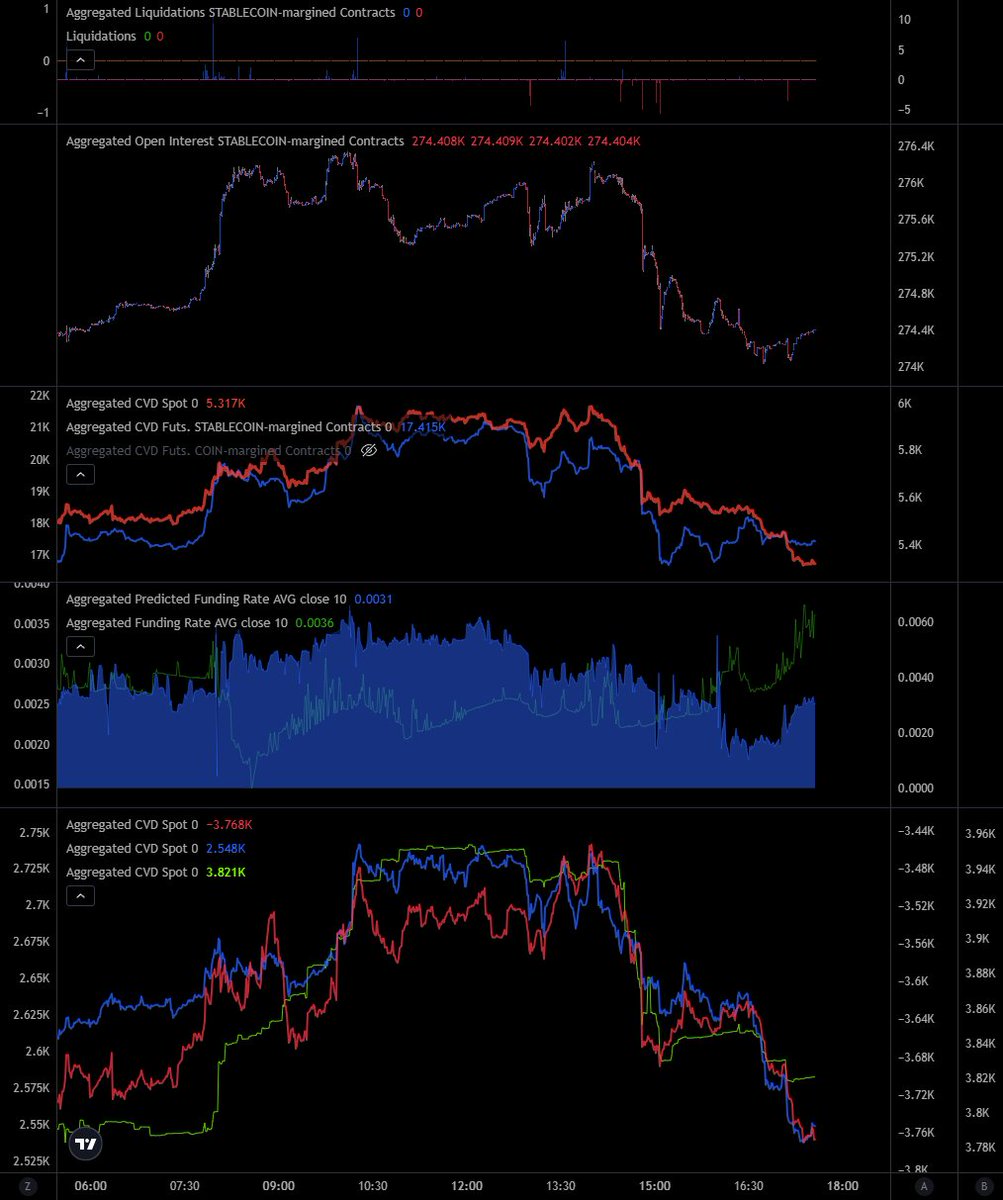
> aggressive perps
> aggressive spot
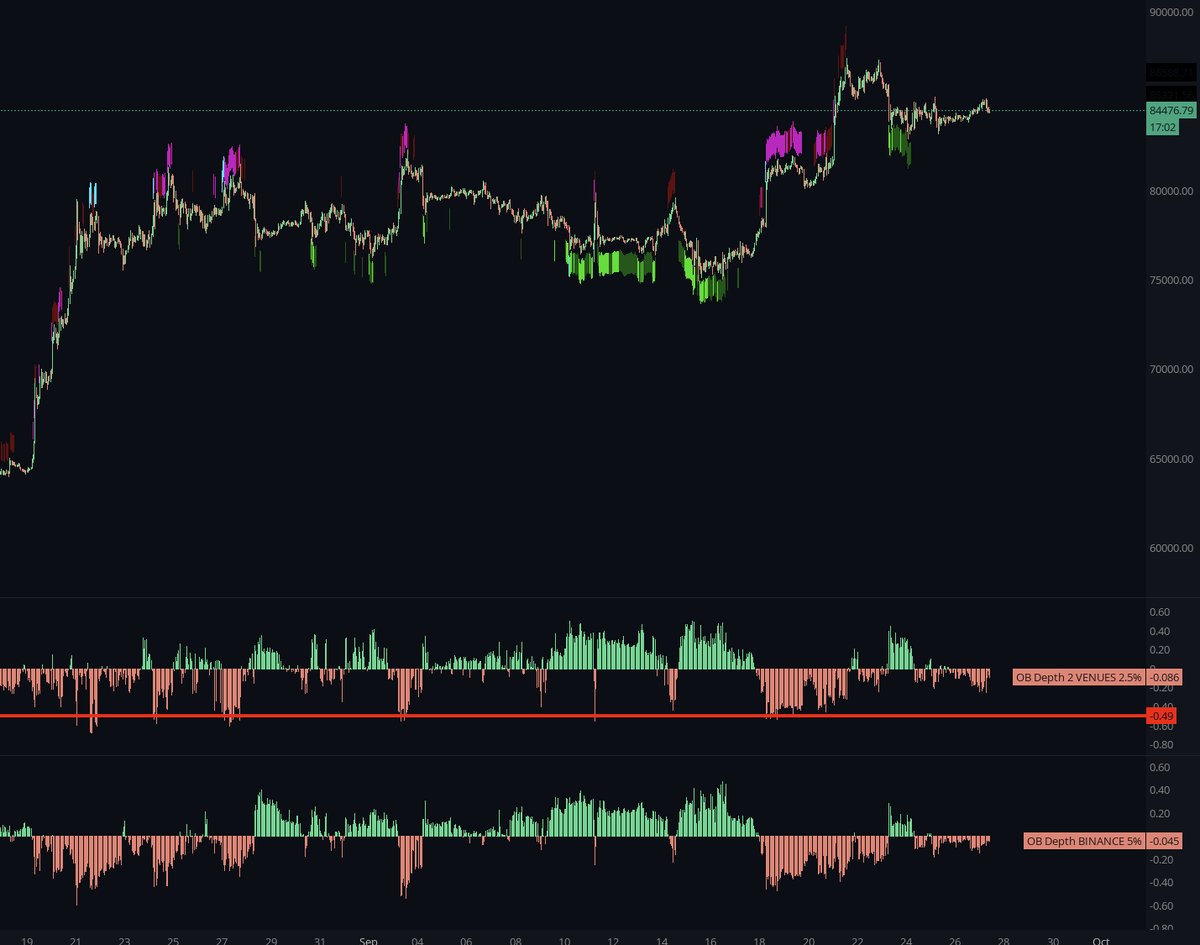
> passive spot
there are many platforms to gauge this behavior. Just remember that there's a lot of fragmentation and also inaccurate ways of reading this because it can tend to get noisy.
Your read will be based on assumptions as well as a lot of screen time (when x + y happens it leads to z happening, which points to ...)
Outlier behavior
So when we parse these participants out remember there is hedging behavior, there is behavior that you will see where someone might suppress the spot side to get their own perps positioning filled etc. Glazing over this to point out that this isn't just as straight forward as meets the eyes at first. But over time your assumed read will improve.
Why Spots vs. Perps
I want you to think of perps positioning as the "weaker" hand because you can lever up tremendously and have your liquidation 0.1% away from your entry (think exaggerated case) which means this positioning is liable to enter, exit and get vaporized fast when price isn't carrying in the desired direciton. Now you throw in an understanding of crowded positioning in the same area and it gives you the exact spot where if positioning is pressed it will unwind with haste.
Think of spot behavior as the whale which has the little fish that stick to its underside for the ride (the perps positioning). In other words, the real strength or weakness of a move is ultimately determined by spot follow-through (or lack there of)
understood? let's move on to what you're actually reading this for and probably skipped the rest to read.
There are many platforms to do this but here is one way I quickly scan this behavior:
1. Coinalyze
You can go on coinalyze for aggressive spot and perps behavior - both aggregated as well as parsing out exchanges (binance, cb etc.)
i.e. you can watch what both aggressive perps and aggressive spot are doing through the move as well as watching what is happening on individual exchanges.
Do this on LTF (I typically do not go above 5-15 mins here).
2. MMT
For passive spot, you can go to MMT and watch the spot orderbook skew which shows you how fat the supply/demand is on 2.5% and 5% depth.
The indicators are OB depth and OB pressure bands as shown in image. You can go to settings and change the exchanges as well as looking at spot vs. perps.
Think of this as a "wall" or a "cushion" when approaching from below or above.
Also, at the risk of oversimplifying I want you to visualize the aggressive positioning as "canonballs" when price is approaching a skewed book i.e. aggression can eat away at this skew if it is adequate enough or fall short.
two scenarios combined with context -
BTC is ranging and is trading towards range high for the 3rd time. Short squeeze takes out the range high into a stacked passive spot book skewed towards the ask side and aggressive perps start buying while aggressive spot starts selling. More likely than not this will revert.
BTC is pulling back into an OB that is skewed towards the buy side on passive spot. However aggressive perps continue to long a 1 min grind down and aggressive spot continues to sell unwinding that positioning into new lows. Good chance this passive wall will get eaten through unless this behavior stabilizes.
Keep an eye on the extent of the passive ob skew as well.
When you combine this with areas of confluence the pieces of the puzzle will start to come together.
ok enough yap.
hope this helps.