Military meteorologist. Applying scientific, predictive principles to forecast market movements. Macro economics & trading. A picture paints a thousand words.
Anyone, and I mean ANYONE, who has been 'medium term' (next few months) bullish on Bitcoin at any point in 2026 has been a) wrong, and b) in need of an introduction to technical chart basics 👇
5 years ago, I warned of a potentially disasterous scenario for Eurozone bond yields, based on the technical chart. We crossed that line this month. The wheels may begin to fall off this year and next, necessitating plausible deniability and distraction to defect blame👇
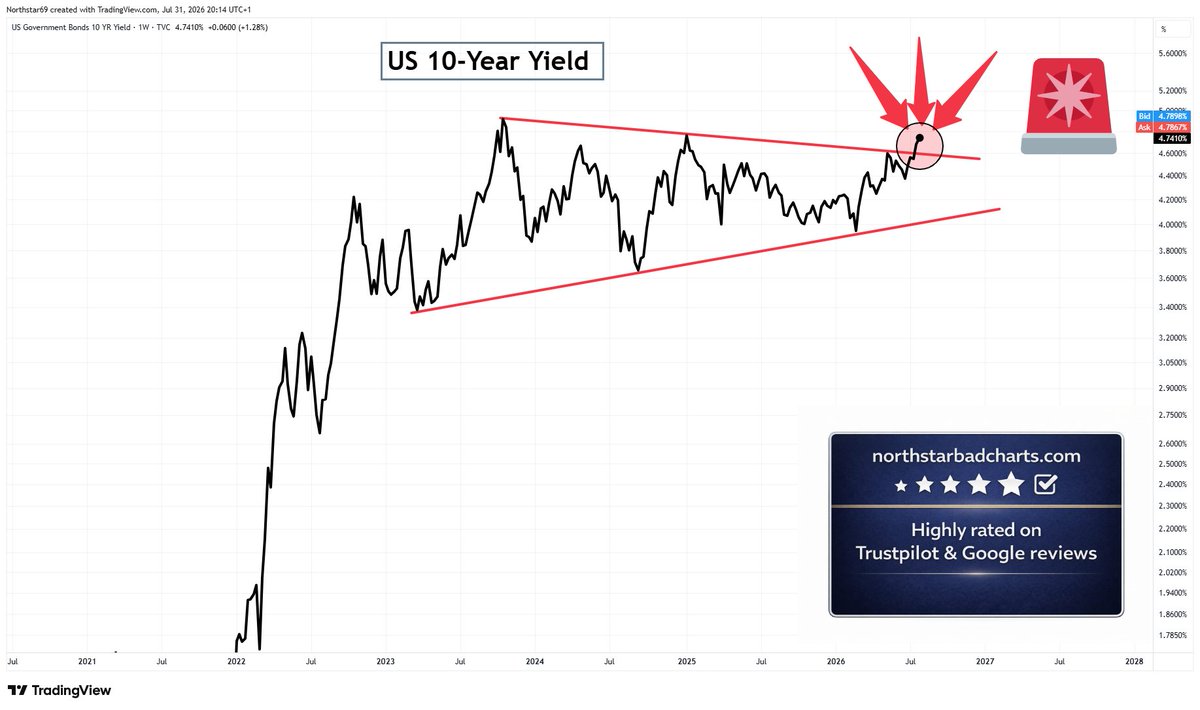
The US 10-Year yield is sounding the alarm with a very clear breakout. Plausible deniability & distraction are going to ramp up. 'Stuff' is going to happen 👇
So there it is, the US 30-year yield has given us another incredibly clear breakout signal. So far, following the path I laid out for you 5 years ago 👇
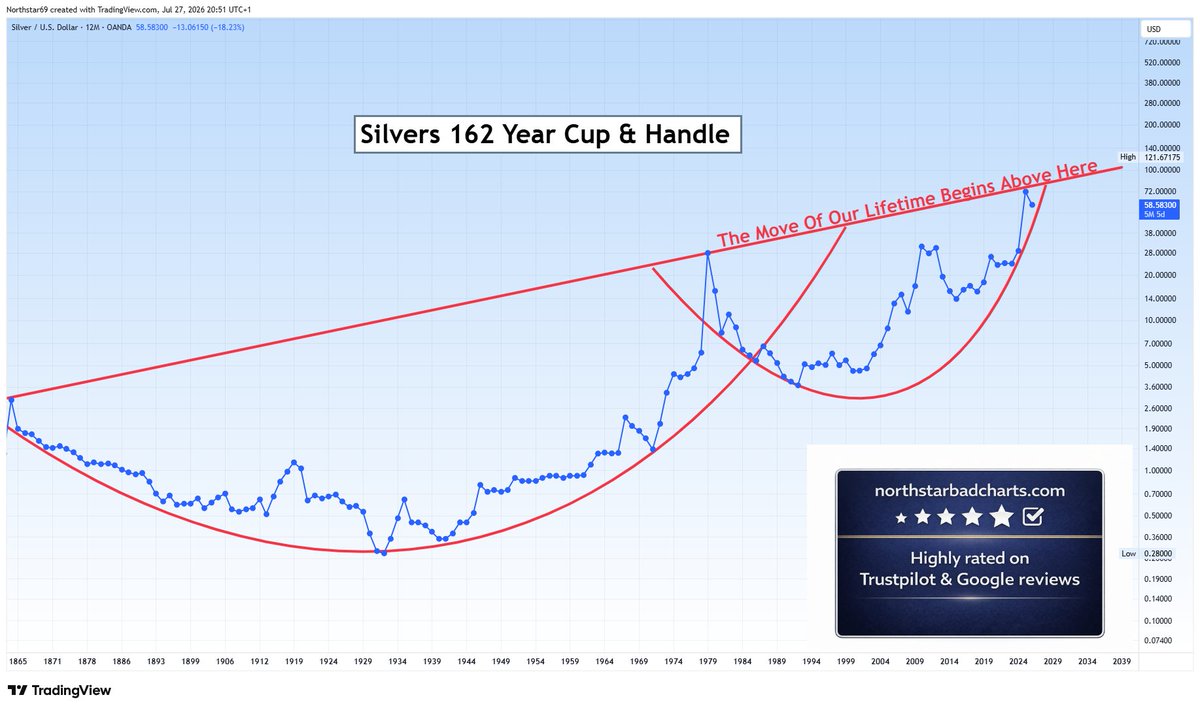
We've seen silver fall over 50%, so being bearish was correct. Silver is going over $250 so being bullish is correct. If you find that confusing it's because you don't understand the importance of timeframes & the difference between trading & investing.
When silver was in the $35-$40 range, before it went to $121, this was my guidance. Not because of some ridiculous narrative. Because of the technical chart weight of evidence.