We just pushed patch v0.4.0. One of the most noteworthy patches to date. Why? MCP support.
You can now chat with JESTER in natural language. Everything you can do in the UI, you can do via MCP. We support Claude, Grok, chatGPT, deepseek, and most other major models - with your own API keys.
Talk to Jester in Telegram /ai or the Mini App Agent. Pull backtests, run new ones, manage automation, copy leaders, even build strategies in plain English.
v0.4.0 also ships a pile of UX and reliability improvements under the hood.
And remember.
This is just the beginning.
NEW: Tesseract
Charts have one glaring issue.
They are almost entirely built from the past.
Candles show what price did. Volume shows what already traded. Indicators are usually calculations performed on that same historical data.
The market also exists in the present, through live participation, trade flow, volatility, and pressure. And it has an implied future structure, through the liquidity already sitting in the order book.
Tesseract brings those three views together.
Past. Present. Future (implied).
It combines chart and price-action data with live market activity, trade flow, and order-book liquidity into a single frame of reference.
But the larger difference is how that information is organized.
Traditional charts are built around time. Price moves from left to right, and we study what happened over the last five minutes, hour, day, or week.
Tesseract removes time from the primary axis completely.
The reference point is price itself.
Instead of asking, what happened at this time?, Tesseract asks, what conditions exist at this price?
Where has the market built acceptance?
Where is participation increasing?
Where is pressure building now?
Where does liquidity suggest the path ahead may be open or contested?
Tesseract compresses that information into five conditions: Drive, Heat, Mass, Flow, and Book.
Together, they create a live field of market conditions across price.
This is what makes Tesseract fundamentally different from another chart or indicator. It is not simply adding more data to the screen.
It is taking data that normally exists across different tools, different time horizons, and different parts of the market, and bringing it into a single price-based surface.
From that surface, Tesseract can shape a draft trade plan with an entry, stop, target, and position size based on your selected risk and leverage.
You can change it, reject it, wait, or send it into the normal Jester Trade ticket and confirm the trade yourself.
Most platforms give you charts.
Others give you signals.
Tesseract is trying to build the layer between the market and the decision itself.
Past, present, and implied future market data, brought into a single frame of reference, organized around price rather than time.
My PIRBView Token Scanner is now FULLY customizable to your needs, turn off indicators and buttons which you don't need to achieve an UI which fits your needs.
Type /settings after talking to PIRBView or PIRBView PRO to toggle the configuration panel.
Use it for FREE NOW: https://t.co/neZCdHdemJ
While building the new @JestTech AI trade planner, I stumbled into a new way to display market data.
Most trading interfaces split apart. You have the price chart, order book, recent trades, volume indicators. In fact, the OG jester indicators were based around the idea of simulating as much of this data onto a candlestick chart as possible. Otherwise the trader has to mentally stitch it all back together.
I may have found a way to do the opposite.
Past resolution, present execution flow, and forward-looking liquidity, normalized into one visual field around price. Not an indicator, and not utilizing any classic charts of any kind.
The fun part is it displays it in a much simpler way, but it also includes significantly more data then is displayed normally on a single trading page.
Just need a name for it...
Left out the main visual until it's "complete"...
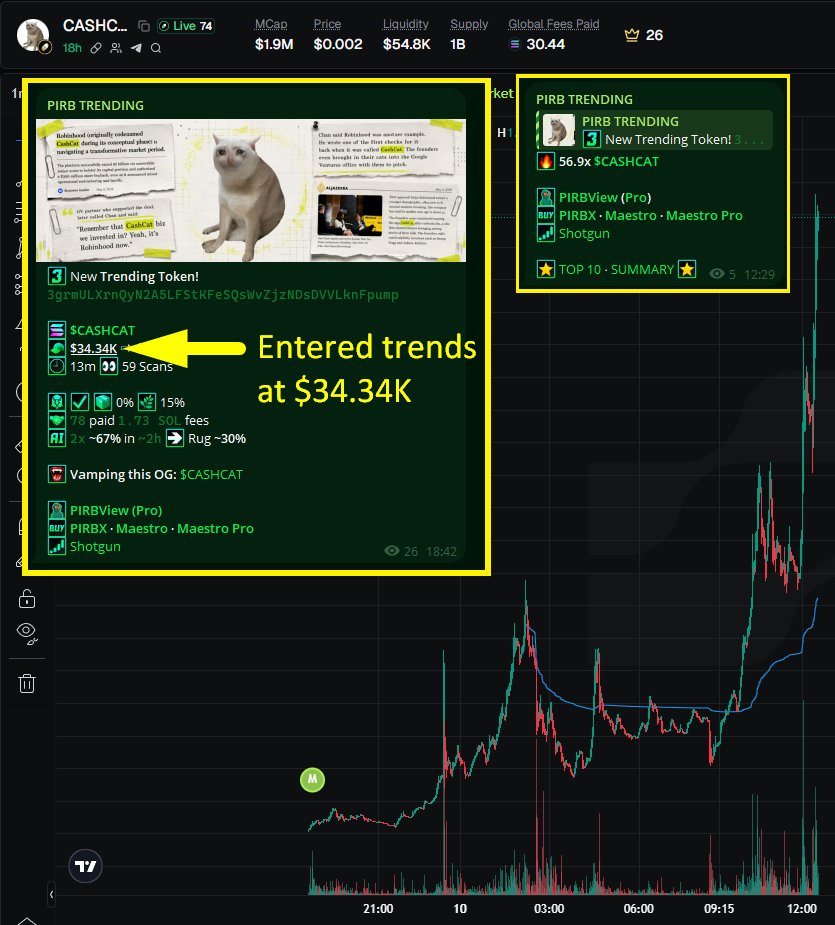
I hate cats, but a cash-cat:native isn't so bad ig? 😼
3grmULXrnQyN2A5LFStKFeSQsWvZjzNDsDVVLknFpump
Stop being poor, get into my cult: https://t.co/neZCdHdemJ
Model after model is dropping.
We are happy.
Why?
Because JESTER is a harness.
We get smarter every time more powerful LLMs are released.
We chose not to train our own model because frontier models already exist, and over time, they outpace specialist models.
Once frontier models stagnate, specialist models will matter more. But right now, the edge is data, harness logic, and filters.
$JEST allows our data, machine learning models, and harness logic to be used by any model, including frontier models.
That means $JEST can improve ad infinitum alongside the best models in the world.
In this way, we are aligned with xAI, Anthropic, OpenAI, Meta, and Llama.
Why compete with the best when we can harness them?
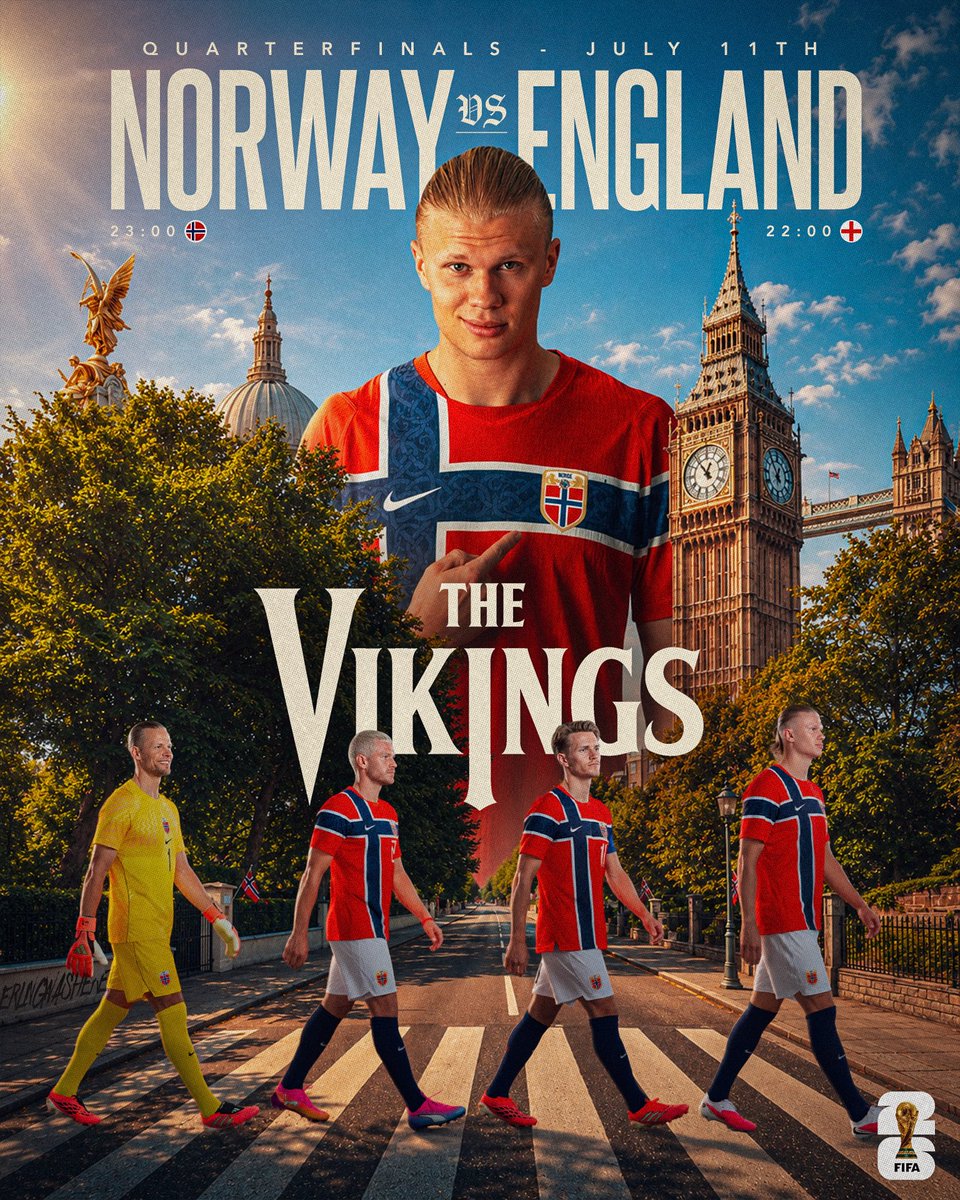
Dear Norway fans… you are, without question, the finest supporters this tournament has seen.
From a nation of just over five and a half million people, you travelled across oceans, filled stadiums, painted American streets red and white and turned every single game into a festival of noise, pride and pure joy.
28 years away from the World Cup stage and you returned not with entitlement, but with energy. Not just with noise, but with meaning.
The Viking Row didn’t just inspire your players. It inspired everyone. Opponents. Neutrals. The entire watching world.
The quarter finals. You deserve every single second of it. Keep going. Keep rowing. Norway, the world is behind you. 🇳🇴