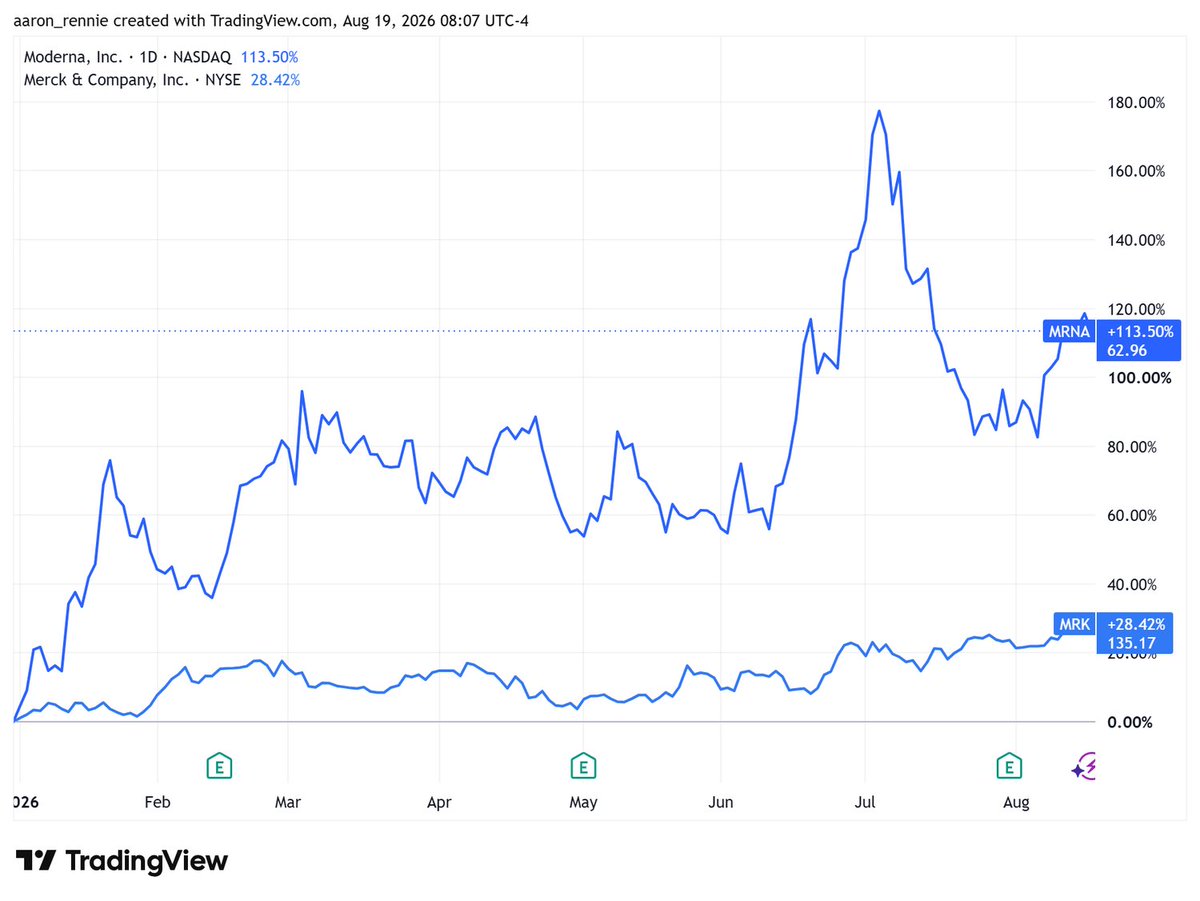
BREAKING: $MRNA surges over +100% (hitting highs above $160) after Moderna & Merck announce the FIRST positive Phase 3 results for a personalized mRNA cancer vaccine.
Intismeran + Keytruda significantly improved recurrence-free and metastasis-free survival vs Keytruda alone in high-risk melanoma patients post-surgery.
Landmark moment for mRNA oncology. Full data coming soon.
Indian equities nearing the deepest relative underperformance versus the S&P 500 on record.
Nifty/S&P 500 ratio has fallen to ~3.16, matching multi-decade lows.
2026 YTD (USD terms): India -9.1% | S&P 500 +13.3%.
FII outflows, limited AI exposure, and valuation gaps continue to widen the divergence.
INSIGHT: Peter Thiel’s $418.7M public portfolio.
And he's betting 72% of his portfolio on AI’s biggest bottleneck: Energy.
$AMZN Amazon — 28.2%
$VIST Vista Energy — 18.1%
$VST Vistra — 14.1%
$AEP American Electric Power — 10.1%
$DTE DTE Energy — 9.6%
$FE FirstEnergy — 9.5%
$CMS CMS Energy — 9.4%
$XE X-energy — 0.9%
Indian equities nearing the deepest relative underperformance versus the S&P 500 on record.
Nifty/S&P 500 ratio has fallen to ~3.16, matching multi-decade lows.
2026 YTD (USD terms): India -9.1% | S&P 500 +13.3%.
FII outflows, limited AI exposure, and valuation gaps continue to widen the divergence.
Indian equities nearing the deepest relative underperformance versus the S&P 500 on record.
Nifty/S&P 500 ratio has fallen to ~3.16, matching multi-decade lows.
2026 YTD (USD terms): India -9.1% | S&P 500 +13.3%.
FII outflows, limited AI exposure, and valuation gaps continue to widen the divergence.
Indian equities nearing the deepest relative underperformance versus the S&P 500 on record.
Nifty/S&P 500 ratio has fallen to ~3.16, matching multi-decade lows.
2026 YTD (USD terms): India -9.1% | S&P 500 +13.3%.
FII outflows, limited AI exposure, and valuation gaps continue to widen the divergence.
INSIGHT: Peter Thiel’s $418.7M public portfolio.
And he's betting 72% of his portfolio on AI’s biggest bottleneck: Energy.
$AMZN Amazon — 28.2%
$VIST Vista Energy — 18.1%
$VST Vistra — 14.1%
$AEP American Electric Power — 10.1%
$DTE DTE Energy — 9.6%
$FE FirstEnergy — 9.5%
$CMS CMS Energy — 9.4%
$XE X-energy — 0.9%
INSIGHT: Peter Thiel’s $418.7M public portfolio.
And he's betting 72% of his portfolio on AI’s biggest bottleneck: Energy.
$AMZN Amazon — 28.2%
$VIST Vista Energy — 18.1%
$VST Vistra — 14.1%
$AEP American Electric Power — 10.1%
$DTE DTE Energy — 9.6%
$FE FirstEnergy — 9.5%
$CMS CMS Energy — 9.4%
$XE X-energy — 0.9%
INSIGHT: Peter Thiel’s $418.7M public portfolio.
And he's betting 72% of his portfolio on AI’s biggest bottleneck: Energy.
$AMZN Amazon — 28.2%
$VIST Vista Energy — 18.1%
$VST Vistra — 14.1%
$AEP American Electric Power — 10.1%
$DTE DTE Energy — 9.6%
$FE FirstEnergy — 9.5%
$CMS CMS Energy — 9.4%
$XE X-energy — 0.9%
Indian equities nearing the deepest relative underperformance versus the S&P 500 on record.
Nifty/S&P 500 ratio has fallen to ~3.16, matching multi-decade lows.
2026 YTD (USD terms): India -9.1% | S&P 500 +13.3%.
FII outflows, limited AI exposure, and valuation gaps continue to widen the divergence.
INSIGHT: Peter Thiel’s $418.7M public portfolio.
And he's betting 72% of his portfolio on AI’s biggest bottleneck: Energy.
$AMZN Amazon — 28.2%
$VIST Vista Energy — 18.1%
$VST Vistra — 14.1%
$AEP American Electric Power — 10.1%
$DTE DTE Energy — 9.6%
$FE FirstEnergy — 9.5%
$CMS CMS Energy — 9.4%
$XE X-energy — 0.9%
INSIGHT: Peter Thiel’s $418.7M public portfolio.
And he's betting 72% of his portfolio on AI’s biggest bottleneck: Energy.
$AMZN Amazon — 28.2%
$VIST Vista Energy — 18.1%
$VST Vistra — 14.1%
$AEP American Electric Power — 10.1%
$DTE DTE Energy — 9.6%
$FE FirstEnergy — 9.5%
$CMS CMS Energy — 9.4%
$XE X-energy — 0.9%
INSIGHT: Peter Thiel’s $418.7M public portfolio.
And he's betting 72% of his portfolio on AI’s biggest bottleneck: Energy.
$AMZN Amazon — 28.2%
$VIST Vista Energy — 18.1%
$VST Vistra — 14.1%
$AEP American Electric Power — 10.1%
$DTE DTE Energy — 9.6%
$FE FirstEnergy — 9.5%
$CMS CMS Energy — 9.4%
$XE X-energy — 0.9%
INSIGHT: Peter Thiel’s $418.7M public portfolio.
And he's betting 72% of his portfolio on AI’s biggest bottleneck: Energy.
$AMZN Amazon — 28.2%
$VIST Vista Energy — 18.1%
$VST Vistra — 14.1%
$AEP American Electric Power — 10.1%
$DTE DTE Energy — 9.6%
$FE FirstEnergy — 9.5%
$CMS CMS Energy — 9.4%
$XE X-energy — 0.9%
If you bought $MU everyday at market close and sold at market open, your return would be 138,330,342%
If you bought $MU everyday at market open and sold at market close, your return would be -99.2%
Almost all of $MU gains have come from overnight moves
The same split shows up everywhere:
S&P 500 over 30 years → $17.17 overnight, $1.21 during the day
NASDAQ 1993–2018 → +2,938% overnight, –62% during the day
Even IBIT → +222% overnight, –40.5% during the day
I am going to set up a trading agent that buys $1000 of $MU everyday right at market close and sells it at the next open
This will be a fun experiment
If you bought $MU everyday at market close and sold at market open, your return would be 138,330,342%
If you bought $MU everyday at market open and sold at market close, your return would be -99.2%
Almost all of $MU gains have come from overnight moves
The same split shows up everywhere:
S&P 500 over 30 years → $17.17 overnight, $1.21 during the day
NASDAQ 1993–2018 → +2,938% overnight, –62% during the day
Even IBIT → +222% overnight, –40.5% during the day
I am going to set up a trading agent that buys $1000 of $MU everyday right at market close and sells it at the next open
This will be a fun experiment
If you bought $MU everyday at market close and sold at market open, your return would be 138,330,342%
If you bought $MU everyday at market open and sold at market close, your return would be -99.2%
Almost all of $MU gains have come from overnight moves
The same split shows up everywhere:
S&P 500 over 30 years → $17.17 overnight, $1.21 during the day
NASDAQ 1993–2018 → +2,938% overnight, –62% during the day
Even IBIT → +222% overnight, –40.5% during the day
I am going to set up a trading agent that buys $1000 of $MU everyday right at market close and sells it at the next open
This will be a fun experiment
Nvidia locks in a $6B licensing agreement with Poolside AI plus a $1B equity stake at a $12B valuation. More than 100 engineers move to the Nemotron open-weight project, sharpening NVDA’s edge in high-performance open models. Markets should track the lift this gives to GPU demand as open AI scales against both Chinese labs and closed frontier systems. Where is $NVDA headed to for EOY?
Nvidia locks in a $6B licensing agreement with Poolside AI plus a $1B equity stake at a $12B valuation. More than 100 engineers move to the Nemotron open-weight project, sharpening NVDA’s edge in high-performance open models. Markets should track the lift this gives to GPU demand as open AI scales against both Chinese labs and closed frontier systems. Where is $NVDA headed to for EOY?
Nvidia locks in a $6B licensing agreement with Poolside AI plus a $1B equity stake at a $12B valuation. More than 100 engineers move to the Nemotron open-weight project, sharpening NVDA’s edge in high-performance open models. Markets should track the lift this gives to GPU demand as open AI scales against both Chinese labs and closed frontier systems. Where is $NVDA headed to for EOY?
President Trump’s latest OGE filing discloses 1,051 securities transactions in June totaling $78.1M–$263.1M. Notable purchases include Visa ($V), Berkshire Hathaway ($BRK.B), Mastercard ($MA), and Cintas ($CTAS). Largest single trade: $5M–$25M sale of Vanguard Dividend Appreciation ETF (VIG). Purchases topped $49M while sales reached at least $28.5M amid continued high-volume portfolio rotation.