your timing and strike price is all that reallty matters. Use OSV to help guide you finding the right contact for next weeks move.
Everyone obsesses over direction.
The real edge?
Timing and strike selection.
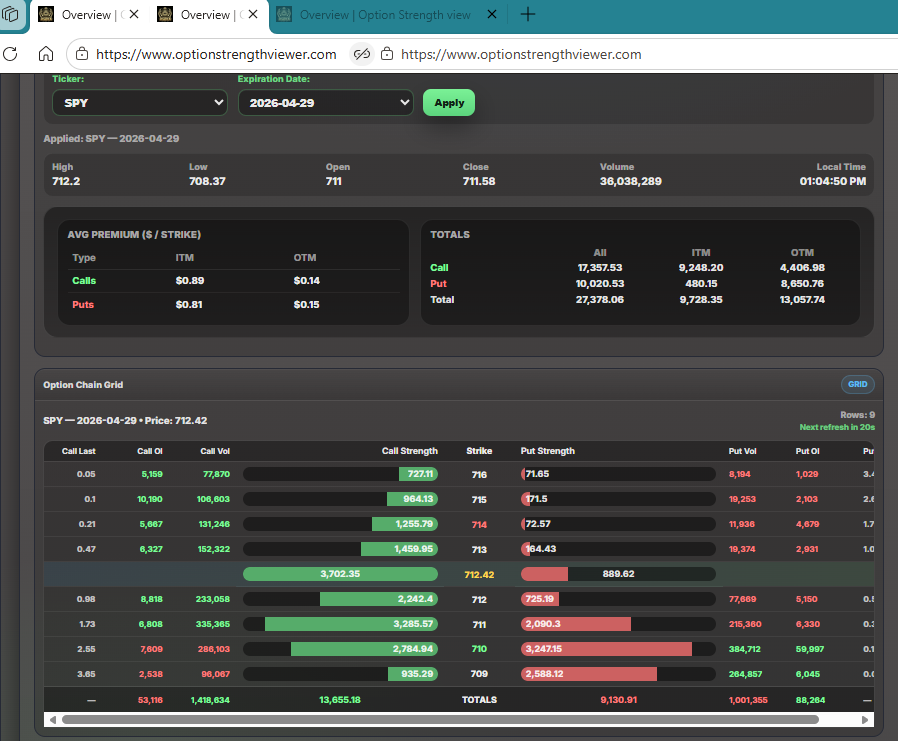
OSV helps you find where institutional strength is building so you're trading the right contract—not just guessing the direction.
Position yourself for next week's move before everyone else sees it.
#SPY #Options #Trading
🚨 SPY Just Turned Aggressively Bullish
This updated chain is a completely different structure from the previous screenshot.
The market has now shifted from:
“balanced compression”
into:
“bullish dominance with weak bearish resistance.”
📈 What Changed?
Current Price Jumped
Previous:
738.55
Now:
741.94
That means price successfully pushed through:
739
740
741
which were previously major resistance zones.
And now those same strikes are becoming support.
That is extremely bullish behavior.
🔥 Major Signal: Put Side Collapsed
Look at the total strength imbalance now:
SideStrengthCalls25,521Puts8,081
That is an enormous bullish imbalance.
The call side is now dominating almost every strike on the grid.
🟢 The Most Important Signal
Current Price Row (741.94)
Call Strength
7,256
Put Strength
966
This is NOT normal balance anymore.
This is:
aggressive call loading
momentum continuation
bullish control
Earlier the ATM row was balanced.
Now bulls completely control the current price area.
That means:
✅ traders are confidently positioning ABOVE current price
✅ bearish defense failed
✅ market makers may need to hedge upward
📊 Call Structure Is Extremely Strong
740 Strike
Call Strength: 4,868
Put Strength: 1,296
741 Strike
Call Strength: 3,910
Put Strength: 585
742 Strike
Call Strength: 3,345
Put Strength: 381
This is a textbook bullish ladder.
The entire structure above price is now heavily call-dominant.
⚠️ Massive ITM Call Explosion
This is the biggest clue.
ITM Totals
Calls ITM
14,277
Puts ITM
659
That is an absolutely massive imbalance.
This means:
deep ITM calls are exploding
traders are heavily profitable on bullish positions
upside momentum is being reinforced
This often creates:
continuation rallies
gamma pressure upward
FOMO chasing
🧠 Average Premium Analysis
TypeITM AvgCalls$0.80Puts$0.71
Bullish traders are still paying more aggressively for contracts.
That means conviction remains strong even AFTER the move higher.
This is important because:
many rallies fail after the initial push
but here traders are still aggressively bidding calls
That usually means:
they expect continuation higher.
🔻 Bearish Risk Zones
The only meaningful bearish defense remaining is:
738 Strike
Put Strength: 3,381
This is now the strongest bearish support/resistance zone below price.
If SPY somehow falls back under:
741
740
then:
739
738
become critical battle zones.
But right now bears are badly outnumbered.
📈 Bullish Scenario
If momentum continues:
Potential path:
741.94 → 742 → 743 → 744 → 745
And notice:
put strength ABOVE price is extremely weak
call strength ABOVE price remains strong
That creates low resistance overhead.
🚨 Why This Move Matters
This was the key transition:
Before
balanced ATM fight
uncertain breakout
Now
bullish breakout confirmed
puts overwhelmed
calls fully dominant
This is exactly the type of shift OSV is designed to detect early.
The chain went from:
“coiling”
to:
“directional expansion.”
🎯 Final Interpretation
This option chain is now showing:
✅ aggressive bullish positioning
✅ strong ITM call expansion
✅ weak bearish resistance overhead
✅ strong support forming underneath price
✅ market maker pressure likely shifting upward
Current structure favors:
bullish continuation
squeeze potential
upside momentum persistence
Main levels now:
Support: 741 → 740 → 738
Resistance: 743 → 744 → 745
The strongest clue:
bulls are no longer defending — they are attacking upward.
SPY OSV Snapshot 🔍
Current Price: 741.06
Expiration: 2026-05-15
📈 Bullish pressure is still dominant near the money, but the structure is beginning to tighten.
🟢 Strongest call positioning remains above current price:
742 → 3,303 Call Strength
743 → 3,121 Call Strength
741 → 2,672 Call Strength
🔴 Put pressure is building underneath:
740 → 2,519 Put Strength
739 → 2,577 Put Strength
738 → 2,452 Put Strength
⚖️ Key Observation:
The ATM row (741.06) still favors calls overall:
Calls: 5,976
Puts: 2,149
That tells us buyers are still defending the current zone, but bearish pressure below price is expanding rapidly.
📊 Totals Breakdown:
Call Strength Total: 16,380
Put Strength Total: 10,024
Calls still lead overall, but the lower strikes are stacking puts aggressively. That usually signals one of two things:
1️⃣ Bulls are preparing for continuation after consolidation
OR
2️⃣ Bears are building a trap beneath price waiting for weakness confirmation
🧠 OSV Interpretation:
As long as SPY holds above 740–741, bullish structure remains intact.
A break below 740 could quickly accelerate downside because put strength is layered heavily underneath.
741 is currently the battlefield.
740 is the pressure release zone.
#SPY #OptionsTrading #OSV #StockMarket #SPX #DayTrading #Gamma #TradingView
🚨 $SPY OSV Snapshot — 748.03What OSV is seeing right now:
🟢 Bulls still have the stronger structure overall
🔴 But bears are heavily defending directly under priceThis creates a compression zone around 748.📊
Key observations:
• Calls dominate total strength
• ITM Call Premium: 17.9K
• Put positioning mostly OTM
• Strong call support layered at 748–747
• Put wall stacked underneath at 747–745🎯 Most Important Level:
748If bulls hold above it:
➡️ 749 → 750 → 751 possibleIf bears break it:
➡️ 747 → 746 acceleration riskThe interesting part:
Overhead put resistance is actually weak above 750.That means if bulls reclaim momentum, upside
could expand quickly.OSV is currently leaning:
🟢 Slight Bullish Advantage
⚠️ But expect volatility and fakeouts first while both sides fight for control.#SPY #OptionsTrading #StockMarket #DayTrading #OSV
If you haven’t figured it out yet…
Growing ITM pressure is what dictates direction.
Price doesn’t just randomly move.
Market makers, hedging activity, positioning, and aggressive participation leave footprints inside the option chain long before most traders recognize the move.
The problem?
Most platforms only show surface-level data:
• Price
• Volume
• Greeks
• Basic OI
But none of them track the growth behavior of ITM pressure over time in a way traders can actually use in real-time.
That’s where OSV changes the game.
OSV tracks:
• Growing ITM Call dominance
• Growing ITM Put dominance
• Strength expansion
• Pressure shifts
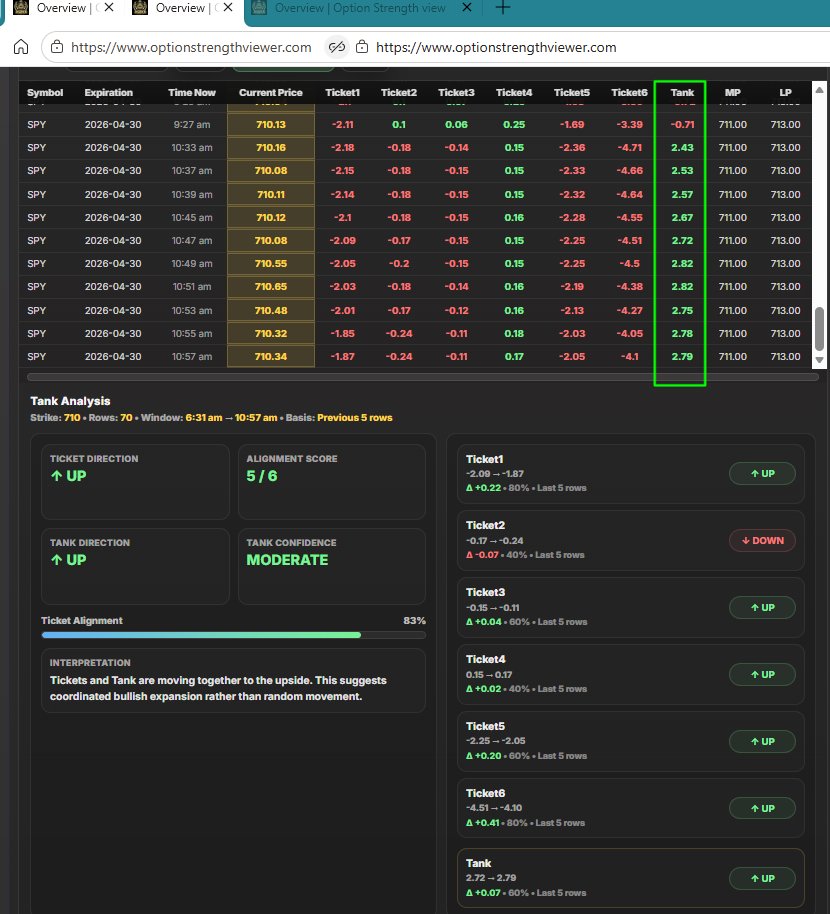
• Tank behavior
• MP/LP positioning
• Momentum continuation vs exhaustion
Not after the move.
During the build-up.
Most traders stare at candles trying to predict direction.
OSV watches the pressure underneath the candles.
That’s the difference.
By the time the chart “looks obvious,” the positioning already happened.
OSV was designed to expose that positioning before the crowd reacts.
🚨 SPY is telling a story most traders are missing…
While price looks choppy, the backend data is shifting 👀
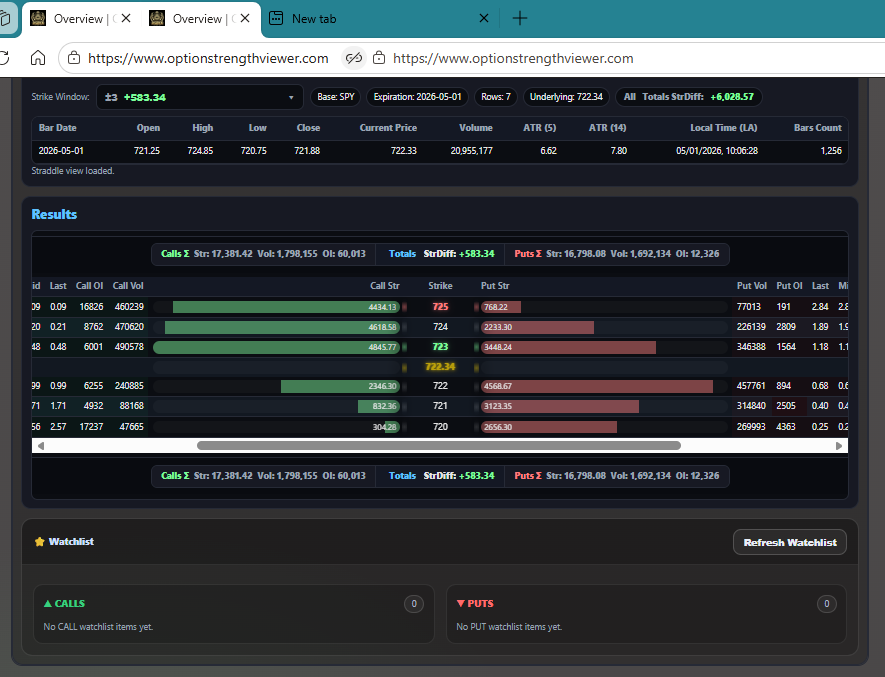
📊 Option Strength Viewer shows:
➡️ Put strength fading
➡️ Call strength quietly building
➡️ StrDiff +$583.34 (bullish pressure)
This is what early reversals look like before price reacts.
Most traders see noise…
Smart traders see positioning.
💡 If you understand where strength is moving, you don’t chase — you position.
Are you watching price… or what’s driving it? 👇
#SPY #OptionsTrading #StockMarket #Trading #DayTrading #Investing #Options #WallStreet #Finance #Stocks #Bullish #Bearish #MarketStructure #Gamma #Flow #PriceAction #SmartMoney