Here's my free Goon Indicator v2 on TradingView – designed to forecast S&P 500 direction on the 30-min chart.
Think of it as a borescope down the market's pipes:
- Clear & trending up? Healthy flow –
stay invested, ride the trend.
- Clog building & trending down?
Stop flushing (pause buying #SPY / #SPX) until it clears.
Quick How-To Use:
* Goon confirms lower lows with SPX → more pain likely ahead.
* Goon diverges & turns up while SPX makes lower lows → Goons (Wall Street) are quietly buying risk – bullish signal.
* Opposite for highs: If SPX hits new highs but Goon lags → brace for correction.
Bottom line:
Goon trending down → I'm in cash.
Not for day trading – it's sentiment gauge showing if the big money (Goons) sees opportunity or trouble. I've found it super helpful and update it often.
Try it out for free here: https://t.co/pUJeWwuB6y Feedback welcome – let's goon the markets together! 🚀
Have you noticed this subtle shift in the market?
As the S&P 500 drifts to lower lows, the #VIX is quietly peaking at lower highs.
Price action screams "losing patience" but the fear gauge? It's telling us the panic is fading.
We've seen this setup before.
Soon, one of them will break the pattern... and when that divergence resolves, it usually moves fast.
#SPX #VIX #Trading #Markets
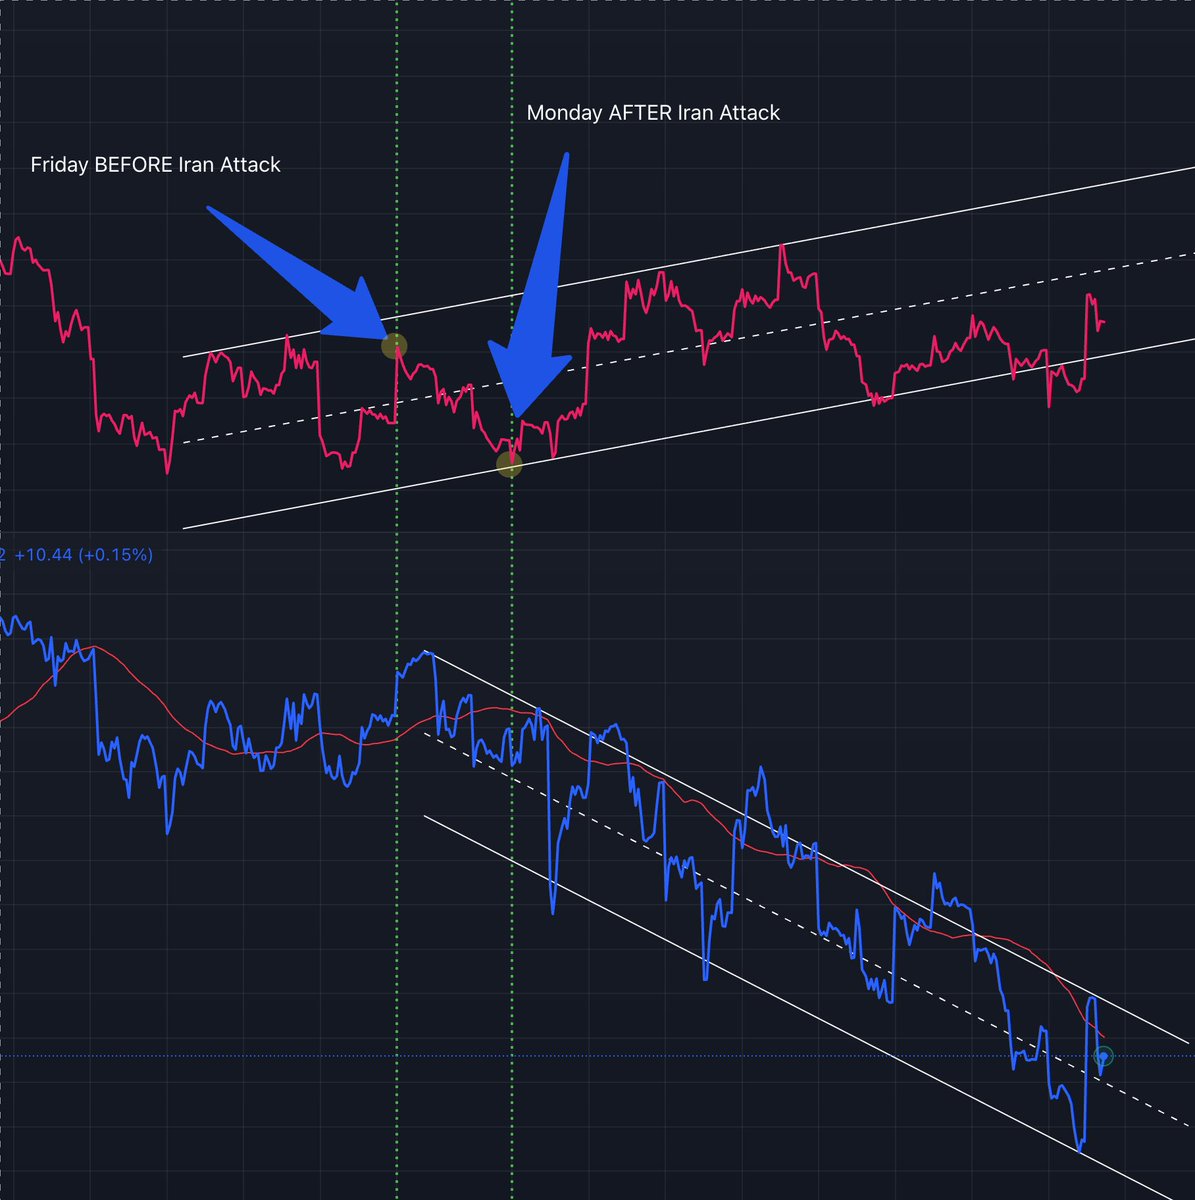
S&P 500 down 5.86% since the Iran conflict began.
Breakdown:
• 3.46% from overnight gaps
• 2nd-worst damage from the final hours of daily trading ... this is not good action for the short term!
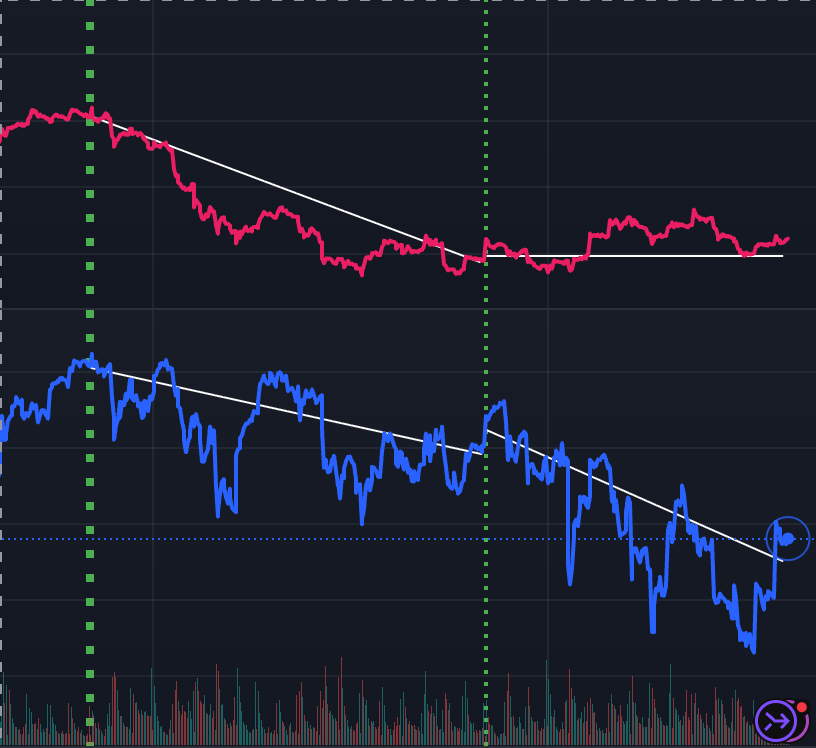
Our Goon chart (attached) just got absolutely crushed. We need a quick resolution to this conflict… or more pain is coming.
Long-term? Still very bullish.
Short-term? Brace yourselves. ⚠️#SPX #Markets
In a world drowning in narratives... where every tweet, every comment, and every statement is spun with bias and agenda... I dedicate myself to perfecting Technical Analysis.
The charts carry no narrative, no emotion, no hidden motive. They reveal only the unfiltered truth.
This is my pursuit of reality itself.
Update 3/18/26 - 8:40 PST: How are the Goons feeling on FOMC day? We're red, VIX is up 23.29, but I see buying of risk. This is bullish until it's not :)
I made my own composite risk chart and it's working like a charm! As long as the red line trends up, that's my way of looking at how the goons (Wall Street) are feeling :)
Today we are red at the moment but Wall Street is buying up risk! #Bullish#SPY
Update: 30-min chart... Shows slightly bullish patterns for the #SP500.
Notes: Thick green vertical was the top of the S&P. Thinner vertical is the conclusion after the #Iran strike.