Two million people.
Five boroughs. The Queensboro climb and the First Avenue roar.
The day you ran New York — drawn four ways, so you can hang the one that feels like yours.
→ https://t.co/HgHWTohm1l
URBANLINES.
The medal goes in a drawer. The route stays with you.
We turn the marathon you finished into a piece of design. This week, we begin.
Remember the run.
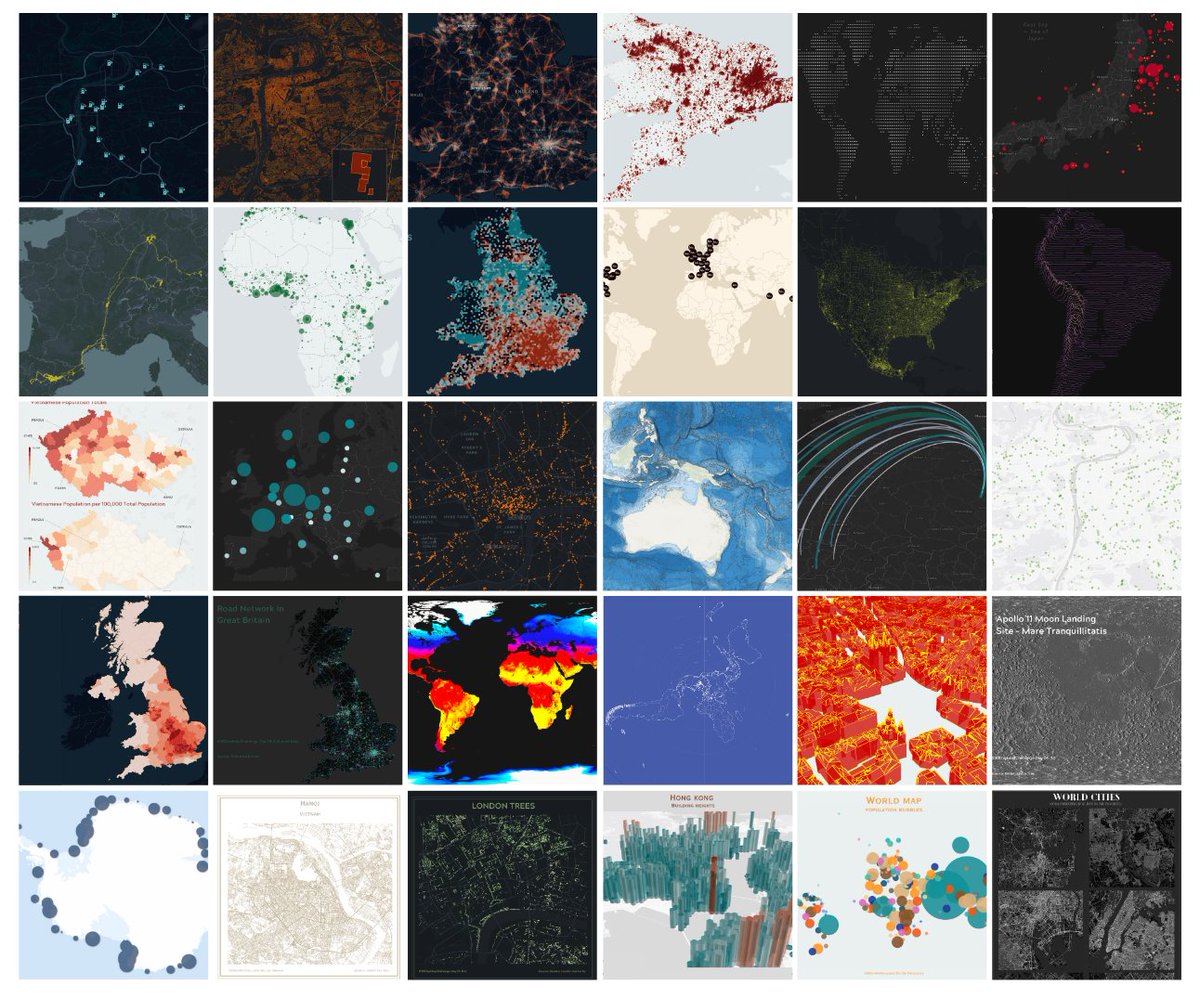
That's a wrap.
I have to admit I enjoyed the #30daysmapchallange more than anticipated. I also have to admit I did not think I would actually complete it.
It was great to take part in this and looking forward for next year's challenge!
@mapstack_io Hi, I don't have a the processed data available online but you can get it here https://t.co/BfLLvxi47p. Be aware it's a pretty big file. Once downloaded the the path is Biology/Emperor Penguin Colonies. Hope this helps:)
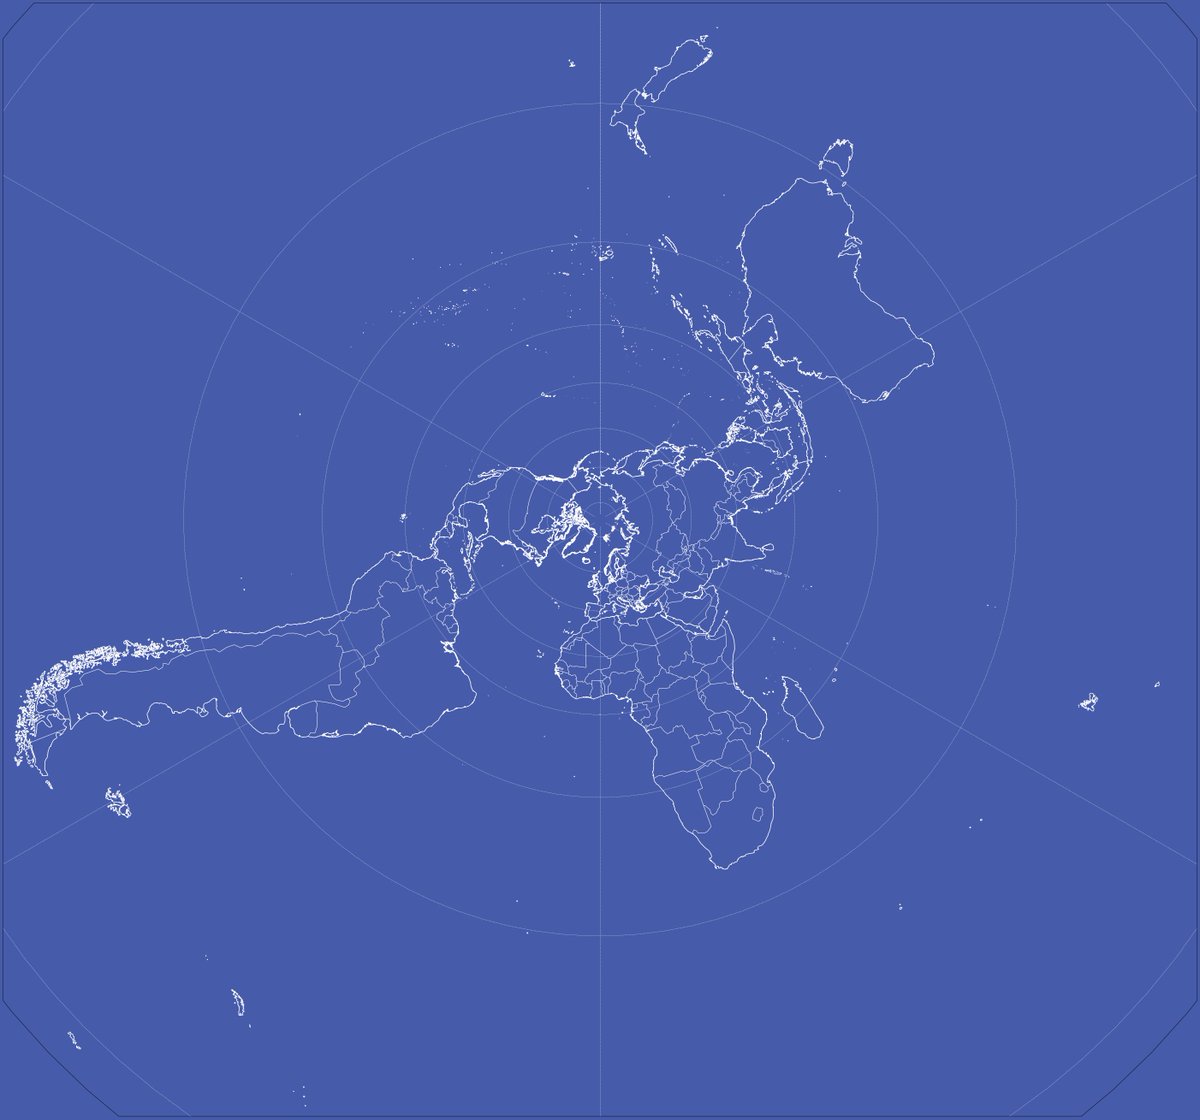
#30daymapchallenge | Day 25 | Antarctica
Population of Emperor Penguin colonies around Antarctica continent.
Source: npolar, Quantarctica
#GIS#mapping#dataviz
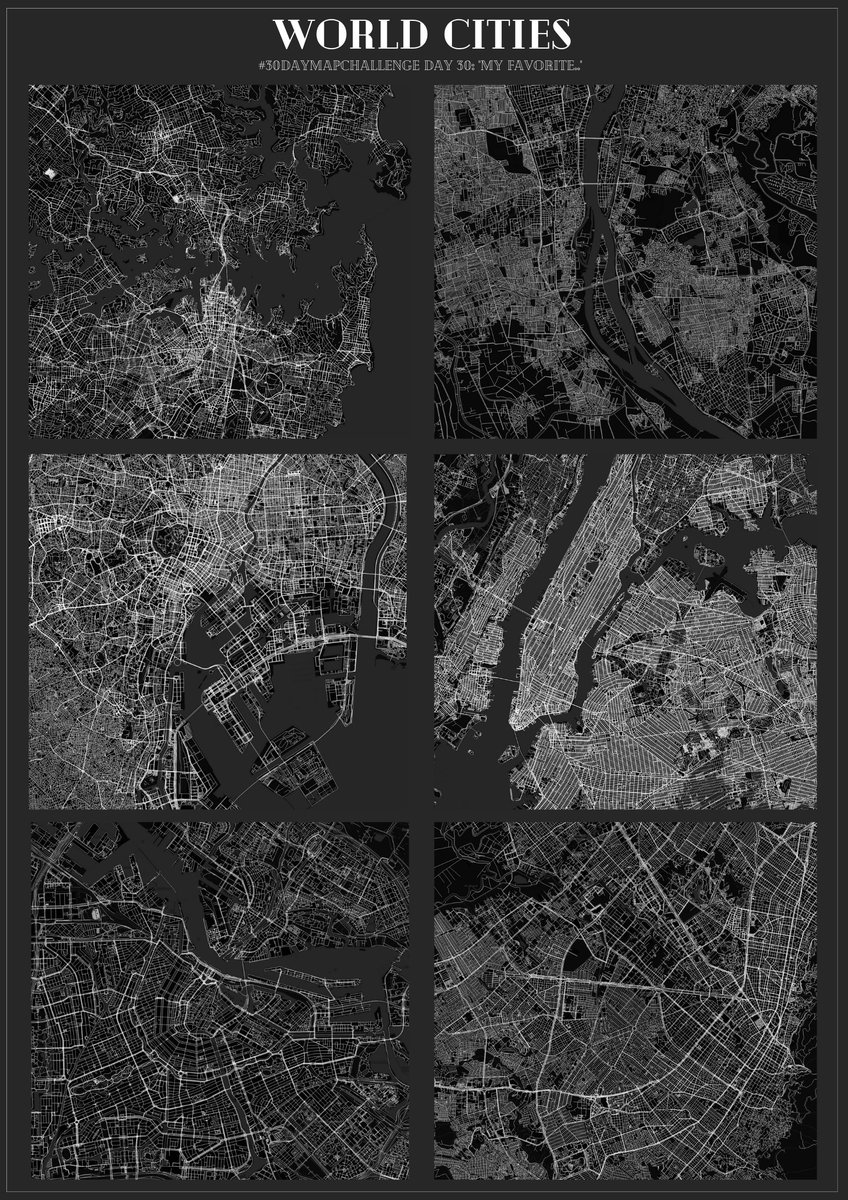
The last day of the #30DayMapChallenge
As l love road networks, for the final day I have created maps of six cities: Amsterdam, Bogota, Cairo, New York, Sydney and Tokyo.
Can you guess which one is which?
Day 30: "My favourite..."
#Day30#GIS#mapping#dataviz#cities
#30daymapchallenge | Day 24 | Black and White
Took a liberty of doing a map of our beloved moon and plot the coordinates of the Apollo 11 landing site.
Source: NASA, Moon Trek - NASA’s Lunar Mapping and Modelling Portal
#GIS#mapping
#30daymapchallenge | Day 21 | Raster
Average land surface temperature in December measured by moderate resolution imaging spectroradiometer.
Source: NASA Earth Observations
#GIS#mapping#dataviz
#30daymapchallenge | Day 20 | Outdoors
As a kid I spent hours outdoors on the playgrounds. Could say plenty of core childhood memories were unlocked in one of these playgrounds.
Source: OpenStreetMap
#GIS#mapping#prague
#Day19 | 5 Minute Map | #30DayMapChallenge
A simple road network of Great Britain with red colour representing the motorways, green colour A roads and blue colour B roads.
Made in QGIS just about under 5 minutes.
Source: Ordnance Survey
#GIS#Map#dataviz
#30daymapchallenge | Day 18 | Atmosphere |
Population-weighted mean of particle pollution across local authorities.
Breathing in unhealthy levels of PM2.5 can increase the risk of health problems. Urban areas are especially affected.
#GIS#mapping#dataviz#pollution
#30DayMapChallenge | Day 17 | Flow
Flow of Ukrainian refugees to Czech Regions following the Russian invasion. The refugees have been granted residency rights in the respected regions.
Source: Ministry of the Interior of the Czech Republic
#Day17#GIS#maps#dataviz
I was delayed... but here is Day 16 - Oceania of the #30DayMapChallenge. Combined GEBCO bathymetry (depth) data with ESRI Ocean base map using QGIS. It's simple but somewhat captivating.
Source: GEBCO
#Day16#GIS#maps#ocean#Datavisualization