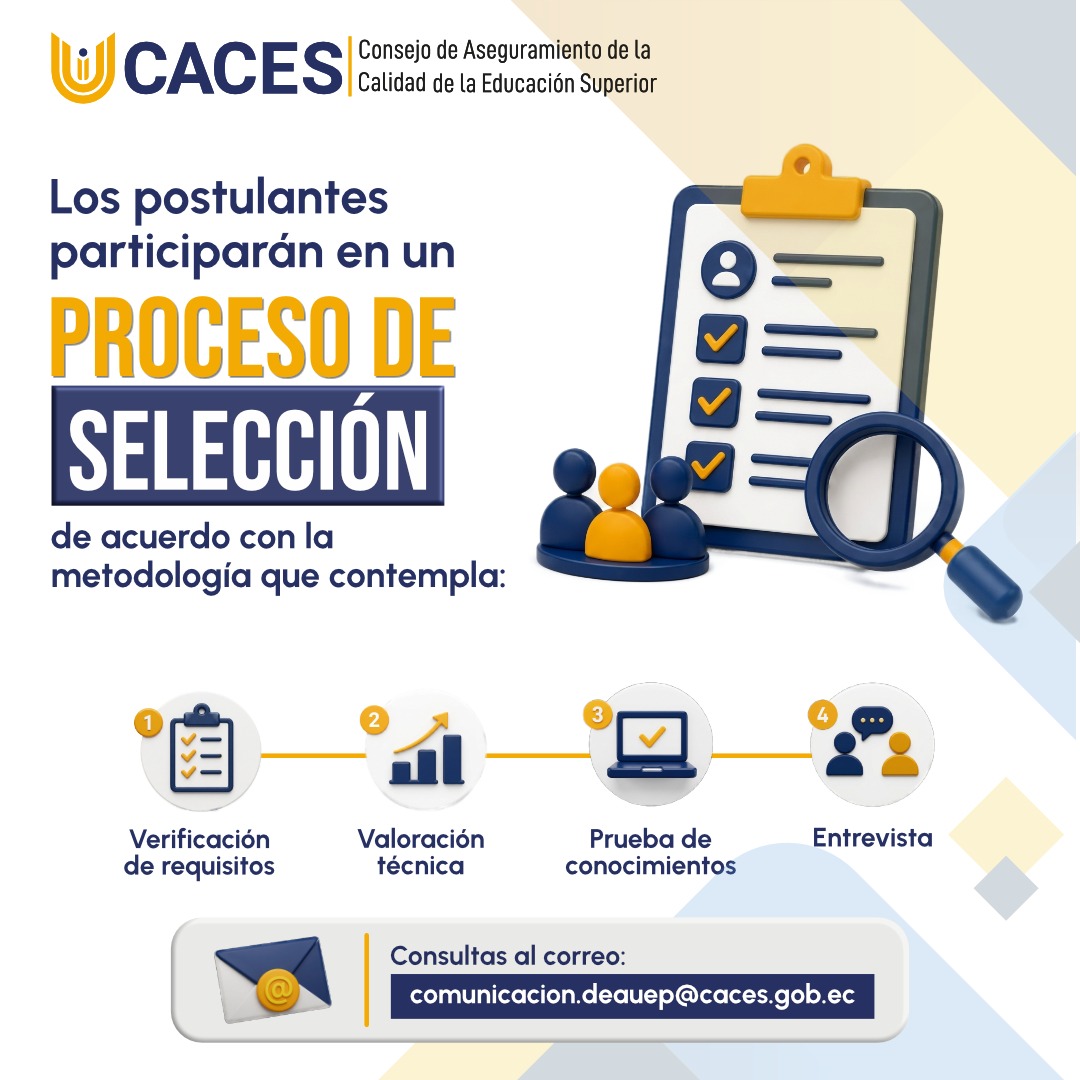
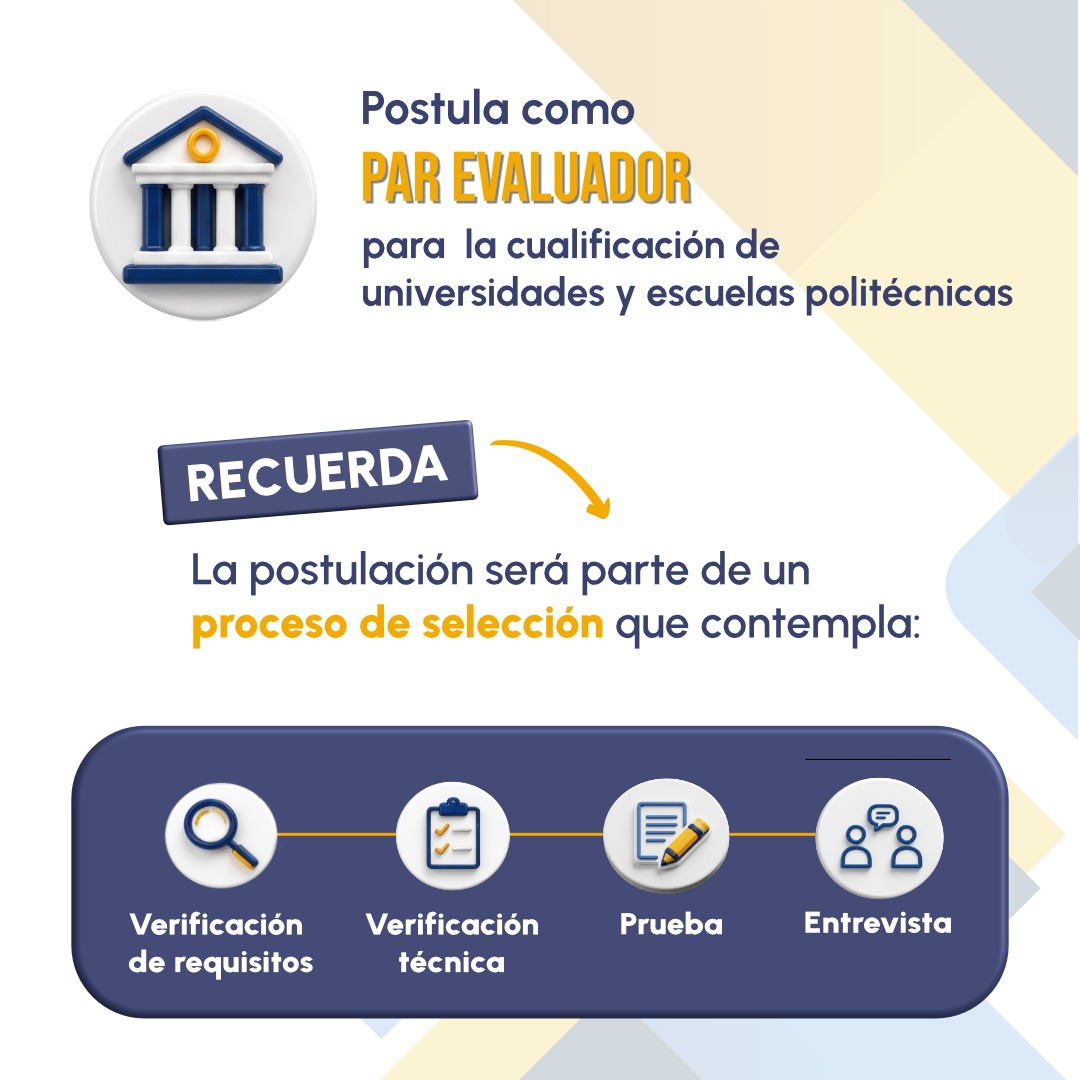
📹Revisa paso a paso para postular como #ParEvaluador en el proceso de cualificación académica de universidades y escuelas politécnicas.
Te invitamos a ver el siguiente video ⬇️
📌Cada #ParEvaluador es una pieza clave para el proceso de cualificación académica de universidades y escuelas politécnicas.
Antes de postular, toma en cuenta las siguientes recomendaciones ⬇️
https://t.co/9BMihNMQnl
¡La convocatoria está abierta!
Si tienes PhD o su equivalente, experiencia en docencia, investigación y gestión académica, esta es tu oportunidad de ser parte del proceso de cualificación académica del país.
📧 [email protected]
Postula ⬇️ https://t.co/9CV3oDWllp
📚¿Quieres ser #ParEvaluador del CACES y participar en el proceso de cualificación de universidades y escuelas politécnicas?
Postula aquí ⤵️ https://t.co/9CV3oDWllp
📣El #CACES está en la búsqueda de los mejores perfiles para la selección de #ParesEvaluadores externos para el proceso de cualificación de universidades y escuelas politécnicas.
Postula aquí ⬇️ https://t.co/9CV3oDWllp
Martha Macías, consejera del #CACES, lidera la prueba piloto del Modelo de Evaluación para Especialidades Médicas en la Universidad de Cuenca.
Las jornadas a nivel nacional han permitido fortalecer el instrumento de evaluación, con el fin de promover su aplicación efectiva.
Binary and multinomial logistic regression are two powerful statistical methods used to analyze categorical data. While they share some similarities, they are used for different types of data and serve different purposes.
Key differences between binary and multinomial logistic regression:
🔹 Binary logistic regression: This method is used when the target variable has only two possible outcomes, such as "yes" or "no". It estimates the probability of one outcome over the other based on predictor variables. This is ideal for straightforward decision-making scenarios, like determining if a customer will make a purchase or not.
🔹 Multinomial logistic regression: This approach extends binary logistic regression to handle target variables with more than two categories, such as "A", "B", and "C". It is useful when you want to model outcomes that are not simply binary but can belong to multiple groups, like predicting the preferred type of product a customer will buy.
Graphs explained:
🔹 The visualization of this post showcases both logistic regression models side by side. The left plot demonstrates binary logistic regression, where two categories are predicted based on a single predictor variable. You can see how the predicted probabilities vary between the two outcomes across different values of the predictor.
🔹 The right plot illustrates multinomial logistic regression, showing predicted probabilities for three categories. The curves in this plot help visualize how the likelihood of each outcome changes with the predictor variable, making it a great tool for understanding complex relationships in data with more than two possible outcomes.
If you want to learn more about these techniques and their practical applications, check out my online course on Statistical Methods in R. This course will dive deeper into logistic regression and other related topics.
Check out this link for more details: https://t.co/7YQCRDKSPO
#DataAnalytics #datastructure #datascienceenthusiast #DataVisualization #RStats #rstudioglobal
Martha Macías, consejera del #CACES, lidera la aplicación piloto del Modelo de Evaluación para Especialidades Médicas en la @lacentralec.
Esta simulación constituye un componente clave para validar y fortalecer el instrumento a utilizar en los procesos de evaluación.
Martha Macías, consejera del #CACES, lidera la aplicación de prueba piloto del Modelo de Evaluación de Especialidades Médicas en la @ucatolicagye. La simulación vivencial permite validar y afinar el instrumento para los procesos de evaluación.
📍Guayaquil
Martha Macías, consejera del #CACES, lidera espacios estratégicos de acompañamiento técnico a los programas de posgrado de las universidades, fortaleciendo las acciones de mejora continua en los campos de conocimiento de Educación, Derecho, TIC y Administración.
#CACESenTerritorio
Desde Cuenca, Martha Macías, consejera del #CACES, lidera espacios de acompañamiento técnico y atención a programas de posgrado, para fortalecer las acciones de mejoramiento continuo en los campos de conocimiento de Educación, Derecho, TIC y Administración.
📉La Rendición de Cuentas del CACES 2025 es el reflejo del compromiso, esfuerzo y trabajo conjunto de todas las áreas que conforman este Consejo.
Te invitamos a ver el siguiente video que cuenta la historia de un equipo que avanza unido hacia objetivos comunes ⬇
The Tukey criterion is a simple and effective method for detecting anomalies using the interquartile range (IQR). It classifies potential outliers as values below Q1 − 1.5 × IQR or above Q3 + 1.5 × IQR.
Advantages:
✔️ Easy to calculate and interpret
✔️ Nonparametric (doesn’t assume normality)
✔️ Works well for simple univariate data
Limitations:
❌ May misclassify outliers in strongly skewed data
❌ Not suitable for multivariate datasets
❌ Sensitive to small sample sizes
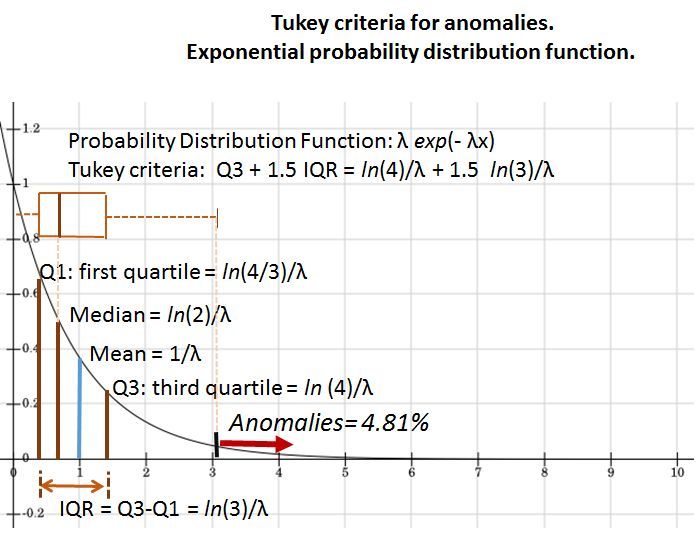
Originally developed for symmetric distributions, it can also be applied to skewed data such as the exponential distribution. The visualization below illustrates how the Tukey criterion identifies anomalies beyond Q3 + 1.5 × IQR, representing about 4.8% of the data. Image source Wikipedia: https://t.co/Nn99krNQnQ
Tukey criterion in R and Python:
🔹 R: available in functions like boxplot.stats() or through manual IQR calculations
🔹 Python: implemented via scipy.stats.iqr() or directly with the IQR method in pandas and numpy
Note: The Tukey criterion provides a consistent way to identify potential outliers but doesn’t automatically justify removing them. Outlier removal should always be done carefully and only with clear theoretical or domain-based reasoning.
Stay up to date with R, Python, and data science. Subscribe to my newsletter for regular tutorials and insights. Further details: https://t.co/ktUcWo9XpO
#Data #datasciencetraining #DataAnalytics #R #DataAnalytics #RStats
Curious about how Principal Component Analysis (PCA) can streamline your data before diving into K-means clustering? Let's explore!
PCA Before K-means Clustering:
1️⃣ Data Simplification: PCA condenses complex data by capturing its essential information into fewer dimensions, making it more manageable for clustering.
2️⃣ Dimension Reduction: It reduces the number of features while retaining most of the variance, making subsequent clustering more efficient.
3️⃣ Enhanced Interpretation: PCA transforms variables into uncorrelated components, aiding in identifying meaningful patterns and relationships between data points.
4️⃣ Optimal Clustering: By reducing noise and redundant information, PCA helps K-means clustering focus on relevant features, leading to more accurate cluster assignments.
5️⃣ Improved Performance: With fewer dimensions, K-means operates faster and more effectively, especially on large datasets.
By leveraging PCA before K-means clustering, you can:
✅ Enhance Clustering Results: Identify clearer and more distinct clusters within your data.
✅ Boost Efficiency: Speed up the clustering process and conserve computational resources.
✅ Facilitate Interpretation: Simplify understanding by visualizing data in reduced dimensions.
✅ Optimize Resource Allocation: Allocate resources more effectively by concentrating on the most influential features.
Would you like to learn more about PCA? Explore our Statistics Globe online course on how to apply PCA using the R programming language. Learn more: https://t.co/DUfoAHuxxD
#RStats #Data #programming #database #Statistical
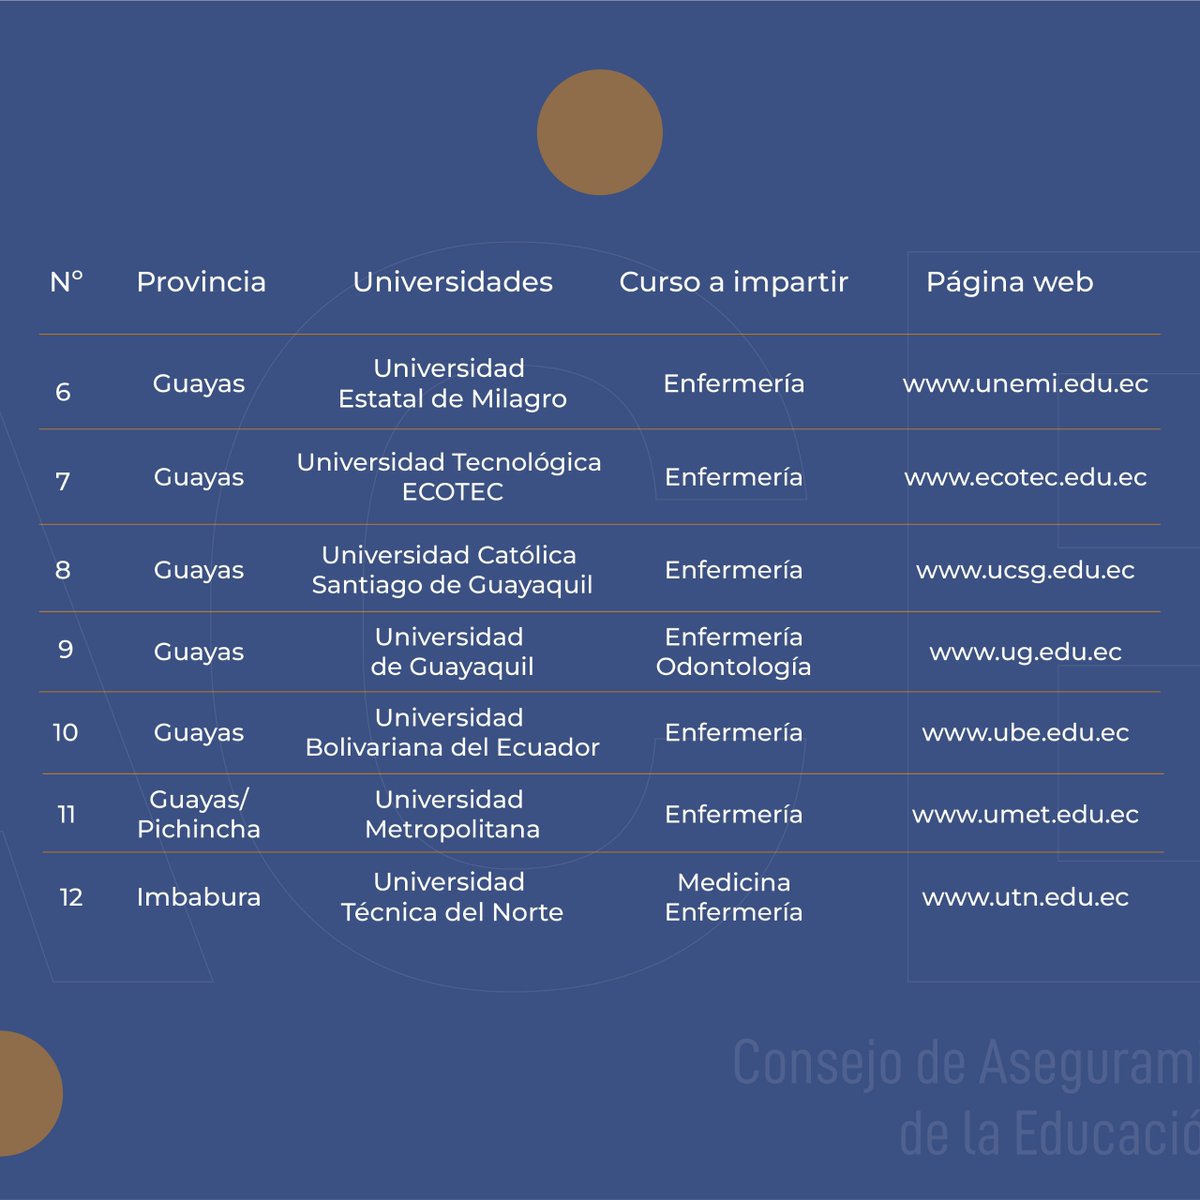
🚩Conoce qué universidades realizan el Curso de Actualización de Conocimientos para el #EHEP primera convocatoria y consulta detalles en estas instituciones.