One Skill. Endless Potential.
The most powerful transformations often start with a single decision: to master one thing deeply.
When you focus your energy like this, doors you didn’t even know existed begin to open — across your career, creativity, and life.
What’s the one skill you’re currently pouring everything into?
Drop it below 👇
#OneSkillEndlessPotential #SkillMastery #GrowthMindset #PersonalGrowth #UnlockYourPotential #MindsetMatters #SkillDevelopment #MotivationDaily #SelfImprovement #FocusAndDiscipline #LevelUp #EndlessPossibilities
9EMA (9 period Exponential Moving Average)-
Quick Explanation:
•Ema is a trend follower/ moving avg
•Shows the trend direction
•Weighted AVG on recent closes
•Best used for identifying trend direction
•doesn’t have a set range or boundary it follows the price
Formula to get the 9EMA (Copy and pasted)
9EMA = (Current Close × 0.2) + (Previous 9EMA × 0.8)
EMA = (Current Close × Multiplier) + (Previous EMA × (1 - Multiplier))
How to use:
•Price above the 9EMA along with 9EMA sloping upwards is bullish looking to go long (Calls)
•Price below the 9EMA along with the 9EMA sloping down is bearish looking to take shorts (Puts)
•Slope shows momentum strength a steep slope is a strong trend if it’s flat that means momentum is fading
Dynamic Support and Resistance:
•In uptrends 9EMA acts as support
•In a downtrend it acts as resistance
One strategy (I don’t recommend) is only using the 9EMA and calling longs and shorts based on the previous section.
There is a few strategies that the 9EMA work my personal favorite is 9EMA, RSI and VWAP (I’ll do a VWAP breakdown at some point).
Simple explanation on my strategy:
•Bullish set up or taking a call option. Price is greater then the 9EMA and price is greater then the VWAP I will also look at the RSI as a 3rd check before I take a Call
Pros
•Very responsive (good for quick day trades)
•Good for finding support and resistance levels
•Simple and easy to read
•Works across all different types of trades for extra confirmation
•Fits my style trades
Cons:
•Bad in sideway/ choppy market
•Needs other indicators to make it super useful
•Isn’t safe against news or high volatility times
Super HELPFUL indicator but isn’t consistent if you choose to use it alone but paired with other indicators it’s super useful
#stocks #tips #EMA #RSI #stockmarket
SCHD break down:
Quick explanation on this ETF. So SCHD is a ETF that has a group of stocks all put into this one ETF. They have a set amount of rules that they follow to either add in new stocks, take out old stocks or just keep stocks in the ETF. They shoot for constant dividend growth, low fees and lower volatility.
What is SCHD?
SCHD is a “dividend 100 index” so just about 100 high quality companies/ stocks that have…
1Consistently pay dividends year after year
2Relatively high yield
3Good fundamental strength and 5 year dividend growth rates
4Meet minimum liquidity requirements
This Next part is just stats I copied directly from the internet
Key Fund Statistics (as of mid-June 2026)
• AUM (Assets Under Management): ~$95B–$100B (highly liquid with strong trading volume).
• Expense Ratio: 0.06% — extremely low, minimizing long-term drag on returns.
• Number of Holdings: 103.
• Dividend Yield: ~3.25% (TTM/distribution yield); SEC 30-day yield ~3.31%.
• P/E Ratio (TTM): ~18.78–19.07.
• Beta (5Y monthly): 0.59 (significantly less volatile than the S&P 500).
• Weighted Average Market Cap: ~$176B (large-cap focus).
• Portfolio Turnover: ~42% (moderate for an index fund).
• Structure: Passively managed ETF — tax-efficient with mostly qualified dividends.
—
Portfolio Composition (as of ~June 18, 2026)
Top 10 Holdings (collectively ~43–44% of the fund; weights fluctuate slightly by exact date):
• Texas Instruments (TXN) — ~5.9–6.4%
• QUALCOMM (QCOM) — ~6.2–6.7%
• UnitedHealth Group (UNH) — ~5.1–5.5%
• Coca-Cola (KO) — ~3.95–4.1%
• Merck (MRK) — ~3.8–3.9%
• Chevron (CVX) — ~3.7–3.8%
• Procter & Gamble (PG) — ~3.5–3.8%
• Verizon (VZ) or Home Depot (HD) — ~3.5–3.6%
• Amgen (AMGN) or ConocoPhillips (COP) — ~3.4–3.6%
—
Sector Allocation (approximate):
• Technology: ~19.4%
• Consumer Defensive (Staples): ~18.5%
• Healthcare: ~18.4%
• Energy: ~14.6%
• Financial Services: ~9.1%
• Industrials: ~7.4%
• Consumer Cyclical: ~6.7%
• Communication Services: ~6.0%
• Utilities/Real Estate/Basic Materials: Near 0%
—-
Back to my own writing!
These stats allow for diversity and also less volatility during random pumps or dumps in the market. The only downside of this is that sure it’ll protect you from downside but that would also go for possibly slowing down the upside movement if a sector is lacking.
Quick list of reasons on why it’s a great long term investment!
•0.06% expense ratio (very cheap) this is SUPER beneficial over time
•Sustainability in dividend payments due to the rules they follow
•Income + growth (both can be sped up if you turn on DRIP)
•Low volatility and downside protection
•Tax efficient
•Proven track record (been the most loved long term div ETF since 2011)
Now if I’m gonna say the good I also have to say the bad
•Can lag in bull markets
•Exposure in some sectors can cause a little bit more then wanted volatility
•Still isn’t immune to a bear market
•Technically dividend growth is not guaranteed so the risk of this just not going up is technically on the table
Quick final conclusion
SCHD in my OPINION is one of the best if not the best “set it and forget it” ETF’s out. The track record is amazing along with how strict the holding rules are you just don’t see anyone competing with it YET. This is an amazing retirement opportunity and could benefit you largely.
Last tip!
DCA and DRIP is what will make this ETF successful long term. DCA is Dollar Cost Averaging basically you are buying in at certain times no matter the cost of the stock (I like the idea of each paycheck day you have a small amount buy into this ETF on a Green Day you leave the amount the same and then on a red day you up the buy a little)
$SCHD #stocks #stockmarket #retire
RSI-
Relative- Strength- Index. It measures how fast the price is moving up or down on a scale from 0-100.
Above 70 is over bought (This is when I think about taking a put)
Below 30 is over sold (This is when I’m thinking about taking a call)
Default setting is mostly set to =14 period
I use the 5 and 15min charts and drop it to the 9 period for faster signals.
Now how I actually use it:
Basic crossovers (Easy)
-Call (long) RSI crosses up through 30 from below + price action confirmation. (Confirm would be a bullish candle, support and hold, or a volume spike. Or it could be all 3 or even a mix of them)
-Put (short) RSI crosses down through 70 from above + resistance or a rejection candle.
Divergences (most consistent)
Bullish: Price makes a lower low while RSI makes a higher high. Bearish momentum is fading watch for a reversal to take a Call.
Bearish: Price makes a higher higher but RSI makes a lower high. Bullish momentum is weakening this is when id be watching to take a PUT.
Centerline (50)
Over 50 is bullish until it breaks over 70
Below 50 is bearish until breaks under 30
Tips:
Never use RSI alone. Pair it with volume, key support/ resistance or VWAP.
Moving averages (9/20 EMA)
Obviously candle stick patterns
Time frame tip that helps with consistency is using a higher time frame like the 1hr chart to find the bias then going back to a lesser time frame like the 5min to find entry.
#RSI #stock #stocktip #learn
When you are looking to purchase and hold a stock for longer periods of time you want to skip the “hype” and make sure it’s a proper investment and not just a pump and dump.
1.
Can you actually explain what they do in one sentence? Skip anything too complicated.
2.
Do they have an edge over the competition or something that just can’t be copied? Kinda like if you are selling cars but you manufacture your own parts which cuts down costs and allows for either bigger profits or allows for you to sell your product cheaper or even both.
3.
Are sales and profits showing growth year after year. Not saying every quarter has to be a gain but the overall growth is up.
4.
They are positive free cash flow/ making money after paying bills.
5.
Not drowning in debt. High debt= big risk if times get rough.
6.
Make good returns on the money they reinvest into the business. (high and steady ROE)
7.
Are you over paying for the shares? Look at the P/E ratio lower is usually better. Compare the P/E to past levels or similar companies.
8.
For growing companies check the PEG. Which is the P/E divided by the earning growth rate. Under or around one means decent value for growth.
9.
Are the owners or bosses honest? Do they own shares? Are they smart with the cash?
10.
Future of the industry does it have a growing demand for the product the company is producing?
All these tips are easily available online as well you can literally just type in something like “NVDA P/E ratio” and it will show up. These tips are very Warren Buffett style quality+ growth at a reasonable price so you aren’t over paying for shares.
Quick Extras these aren’t super important but can help a company.
Dividends: companies that are continuously increasing payouts is a good sign of strength
Ignore noise: don’t fomo into a huge pump and don’t sell on a random dump. Strong companies will recover time in the market if you are constantly gonna DCA that will keep drawdowns to less of a loss and then buy extra during dips will aid in higher returns.
#Investing #Stocks #LongTermInvesting #ValueInvesting #BuyAndHold #FinTwit #WealthBuilding
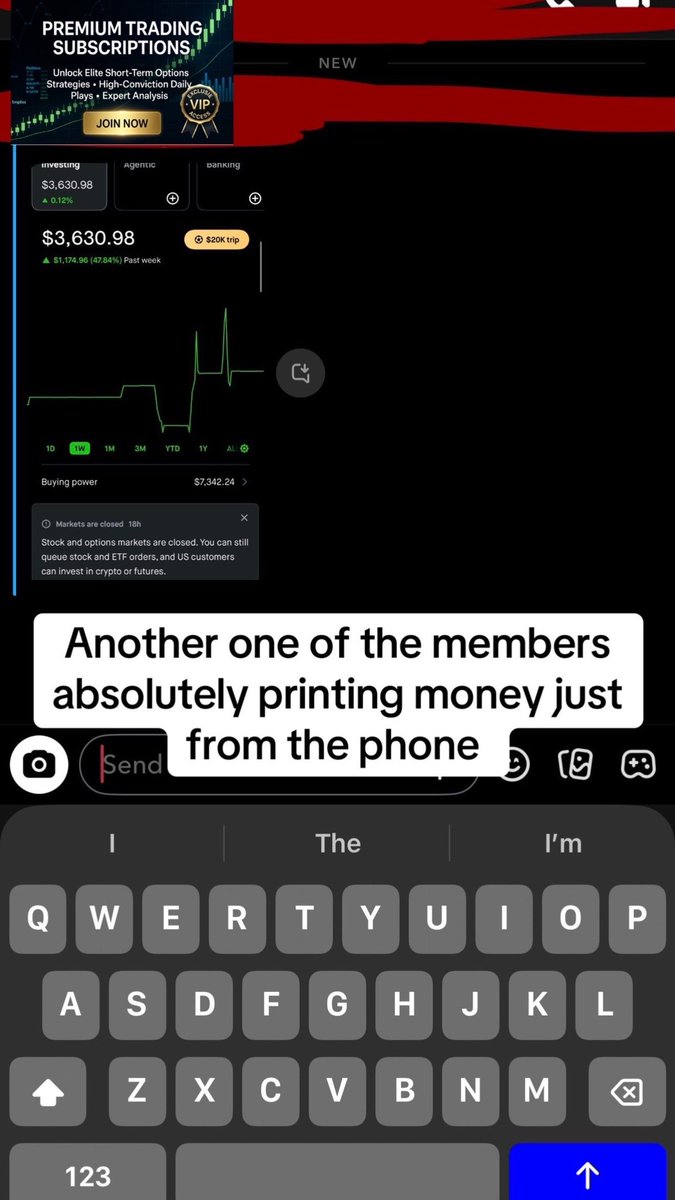
🚀 Premium Telegram Now Open
For traders serious about short-term options edge.
Get high-conviction directional plays:
→ 1DTE & overnight holds
→ Targeting 50%+ returns
→ $2,500 capital examples
→ Precise entries, stops & targets
→ Real-time alerts + breakdowns
No random calls. No bagholding. Just actionable setups.
Limited spots. Serious traders only.
DM me “TG” or tap link in bio to join 👇
@Ojinvests05
#OptionsTrading #TradingSignals #DayTrading
Also someone with $10k to “mess around” with will be tailing my trades so people are starting to gain quite a bit of confidence with me. Join the telegram before the price goes up!
Stop guessing the market.
Start owning it.
$VOO = The smartest way to hold America’s top 500 companies with almost zero fees and real long-term edge.
Want daily VOO breakdowns, smart trade ideas & market alerts?
Join here 👇
https://t.co/vSt6KrjOxK
#VOO #ETF #Investing #SP500 #WealthBuilding #PassiveInvesting #StockMarket #LongTermInvesting #Finance #TradingCommunity