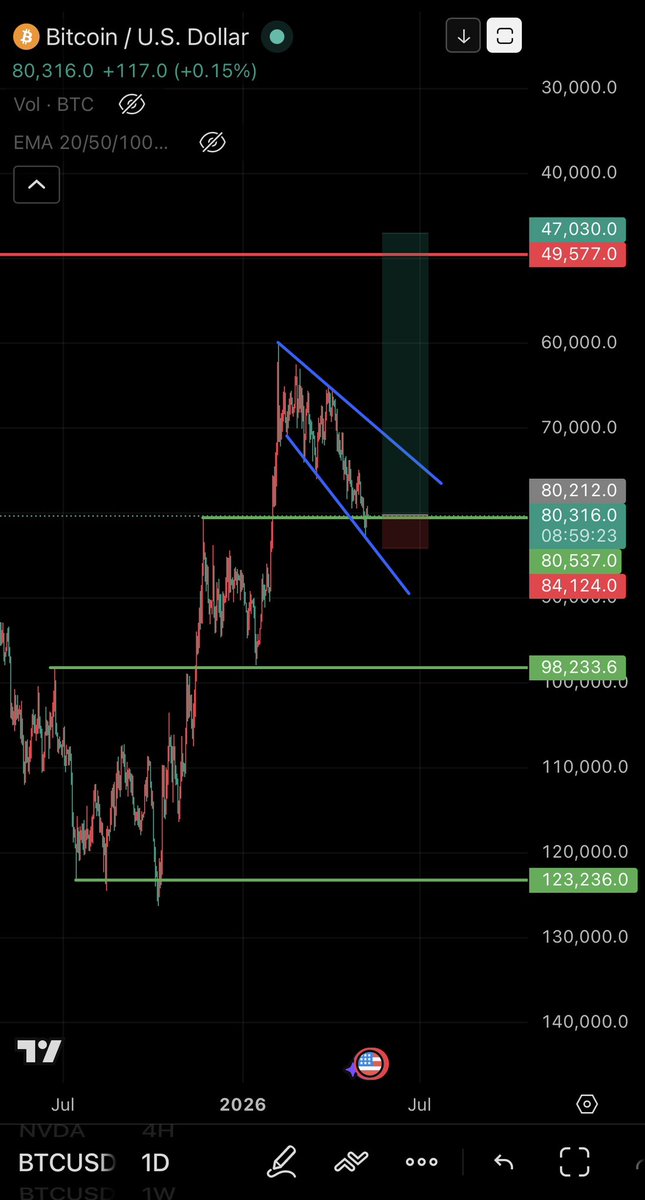
This is my base-case macro scenario for $Bitcoin.
On the 1M timeframe, we may be forming a potential lower high, while the 1W is currently showing signs of a higher low.
This could imply a move toward the 100k liquidity zone, where the monthly timeframe may complete a lower high before a larger correction unfolds.
If so, this would align with a classic 5-wave expansion followed by an ABC correction — something we haven’t clearly seen yet for bitcoin on macro timeframe, as no confirmed lower high has formed on the macro.
A move into 100k–130k, followed by a sharp rejection, could mark the B wave, before a more aggressive C wave to the downside.
I see this as a realistic prediction for Bitcoin. And we could see much lower price-levels than most people want to believe.
#Bitcoin #Trump #Crypto
$ORCA with a nice reclaim of the previous breakdown pivot.
Now retesting the level as support. If this holds, the range high around 3.66 could become the next liquidity magnet.
Let’s see what the market gives us
#Orca#Bitcoin#Crypto
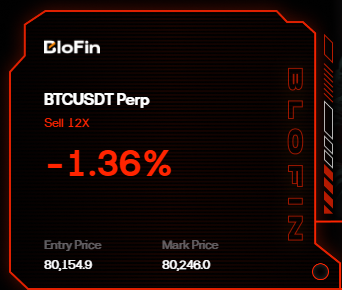
I just entered a $Bitcoin short.
The inverted daily chart still looks very bullish for further downside (bullish upside on the normal chart because of inversion).
If you remove the bias for a second and look purely at structure:
higher highs
higher lows
price currently sitting on a major support/retest area
…most people would probably call this bullish if the chart was flipped normally.
That’s exactly why I’m interested in this short.
On the inverted chart, downside becomes the “bullish” continuation scenario.
Current thesis:
clean trend structure on the inverted daily
retest of a key reclaimed level
potential continuation lower if support flips successfully into resistance on the real chart
Risk is clearly defined above the recent local highs.
Now it’s just a matter of seeing whether the market confirms the rejection over the coming days/weeks.
Let’s see how price develops. 👀
#Bitcoin #Crypto
@blazed_bison@tyfloki@sketshi_x@BOMO_io@Clark10x Well ive been holding the Solana one for a long time now… but seems to just be a slow bleeder… while look at the eth one… the chart dont lie… im just holding with hope at this point… and i know from experience thats not a good sign
Zoom out to the 1M chart... we dont have any lower high on the 1M. Much more likely this "A" move was a sweep of the previous higher low at 80k, now moving towards the WEEKLY lower high around 100-110k before which would potentialy be "B" before we see deeper bear market levels.
#Bitcoin $Bitcoin
@TedPillows Well... because the market should be strong now... where is the 1M lower high?
- Youre right... THERE IS NONE!
1W with double bottom seems very likely we will take out the 100k level before any big macro reversal to deep levels.
#Bitcoin