Broad market observations from 47 years in the financial markets. No post should be construed as a specific recommendation. (Registered w/Thurston Springer Fcl)
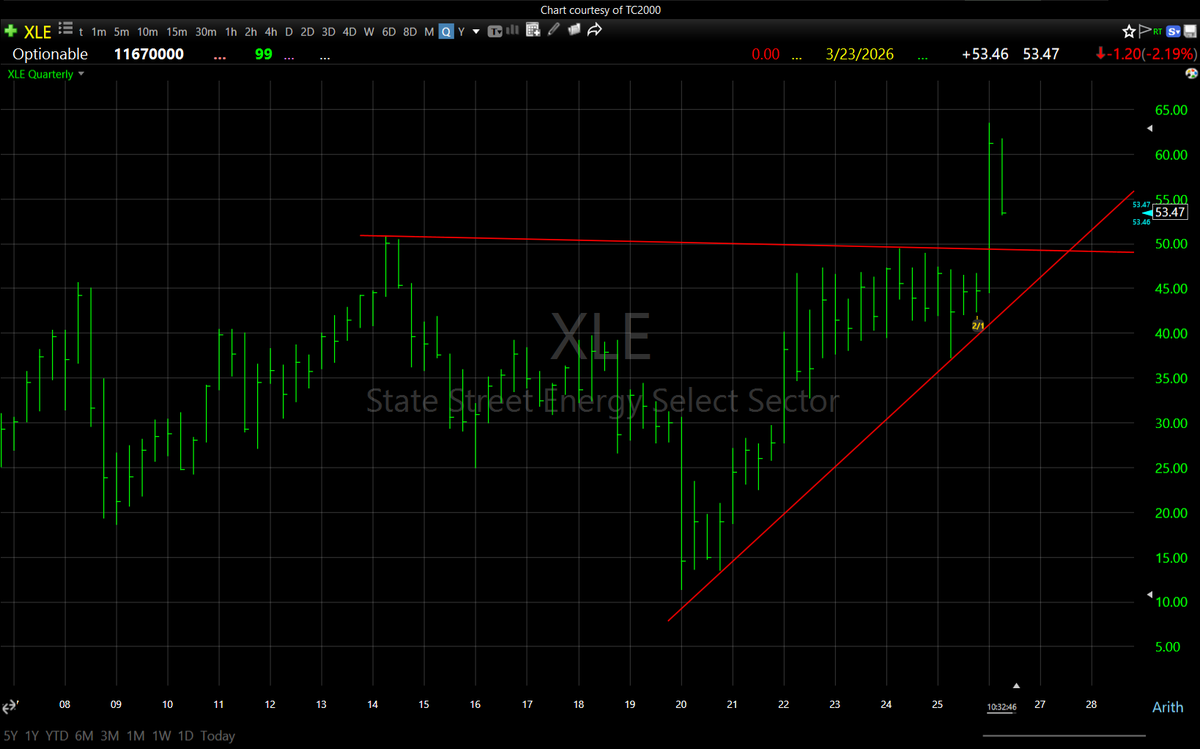
The ENERGY SPDR $XLE has been clearly struggling of late on the perception that the Iran war is winding down. From a longer term standpoint however, this pullback may be a re-test of a long term breakout that occurred in February (2nd chart). Needs time, but worth watching.
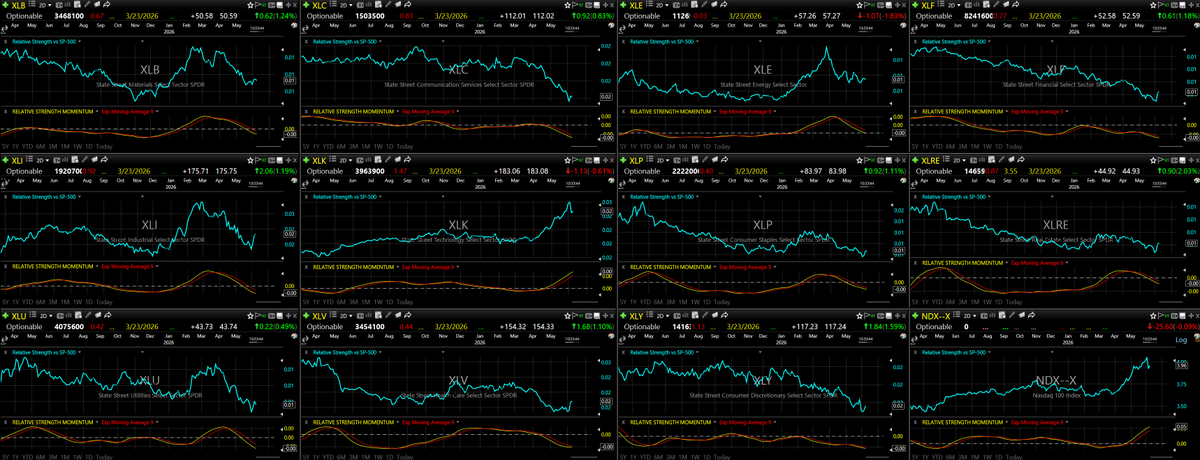
Below are the RELATIVE STRENGTH VS S&P 500 $SPX charts of the eleven major economic sectors. The relative strength is in the top section of each chart in blue. In the lower section of each is the "relative strength momentum" which shows whether RS is strengthening or weakening. It's still clear that only one of the eleven sectors has been out-performing, and that's Technology $XLK
Included in the lower right is the Nasdaq 100 $NDX, which has shown leadership being that 55% of the index is weighted in tech.
Notes... While modest, HEALTHCARE $XLV (2nd column at bottom) is currently showing increasing relative strength momentum.
SEMI's $SMH found support at 2 hour red-line (144 exponential moving avg) and put in a nice little reversal bar. With a little luck that will continue to hold. We'll see.
SEMI's $SMH found support at 2 hour red-line (144 exponential moving avg) and put in a nice little reversal bar. With a little luck that will continue to hold. We'll see.
Below are the RELATIVE STRENGTH VS S&P 500 $SPX charts of the eleven major economic sectors. The relative strength is in the top section of each chart in blue. In the lower section of each is the "relative strength momentum" which shows whether RS is strengthening or weakening. It's still clear that only one of the eleven sectors has been out-performing, and that's Technology $XLK
In the lower right is the Nasdaq 100 $NDX, which also shows leadership being that 55% of the index is weighted in tech.
Beginning to see symmetry for a "potential" upcoming head and shoulders top in the NASDAQ COMPOSITE. This pattern, if it were to continue to develop, would see a near term rally that stalls in the area of 26,700 (left shoulder area) before rolling over to break the neck-line (in red). Not a forecast at this point, just an observation to keep an eye on. $COMP $IXIC
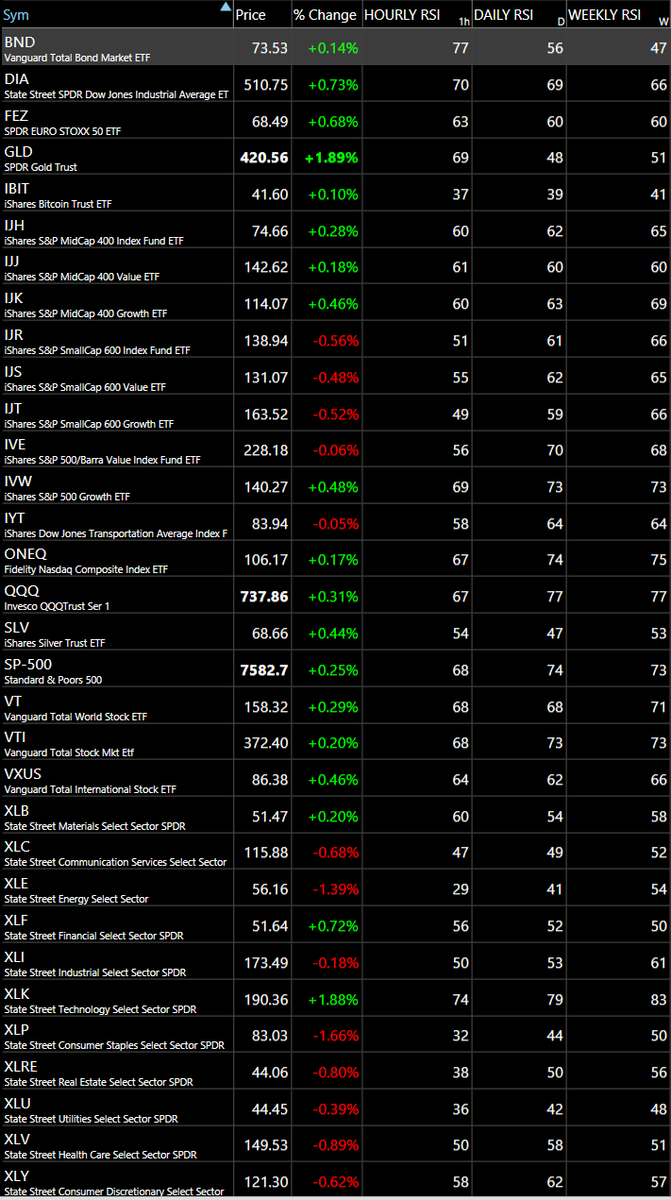
Hourly, daily and weekly RSI's on the MAJOR AVERAGES and sectors. While not necessarily a timing mechanism, RSI's above 70 are generally considered as being overbought with readings under 30 oversold.