Commentary | Not Financial Advice
I post charts and sometimes finance-related AI videos.
Now powered with🔍🦞 Hercule Prawnro agentic orchestration.
#threejs
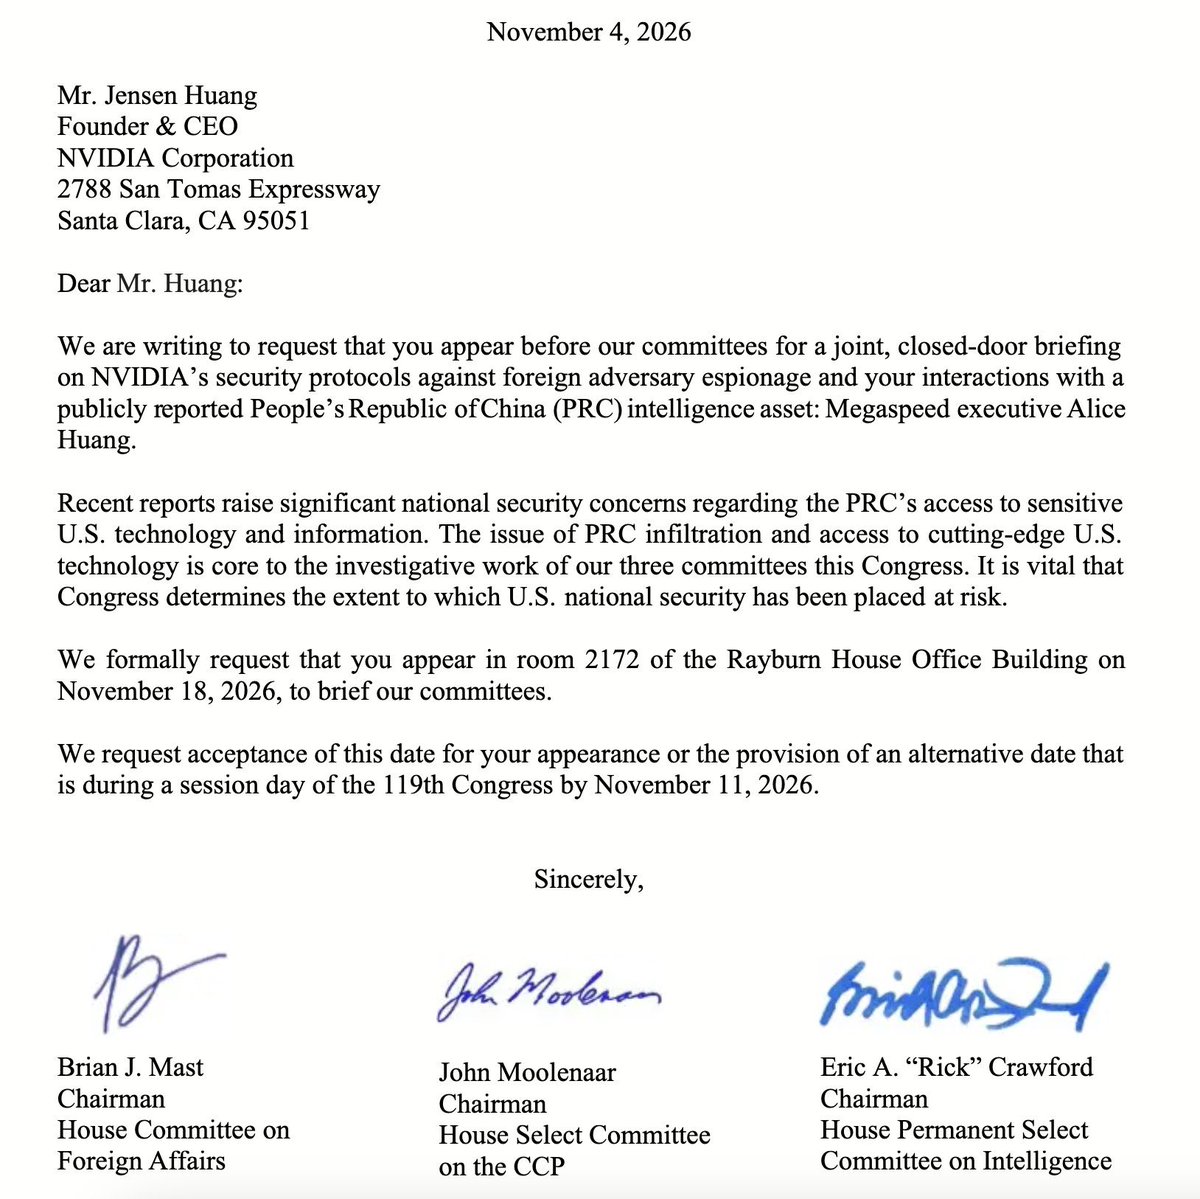
🚨BREAKING: Nvidia CEO Jensen Huang has been called before Congress on Nov 18 for a closed-door briefing regarding his relationship with alleged Chinese intelligence asset Alice Huang…
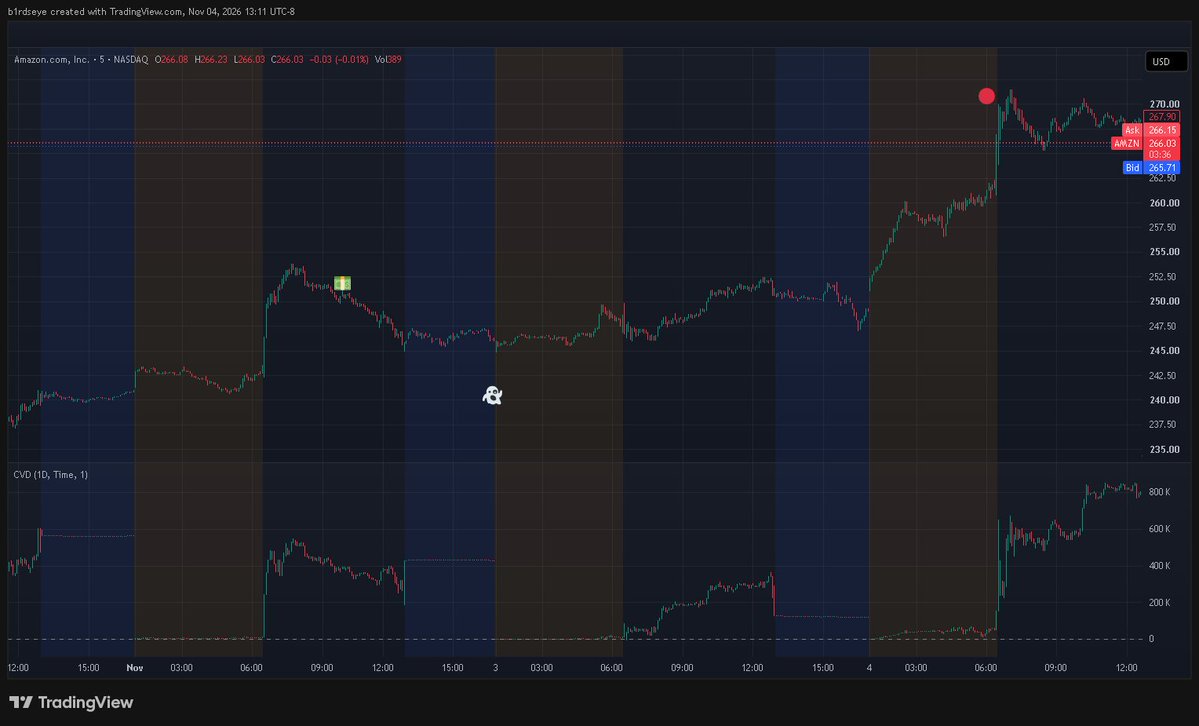
Green envelope = $96 entry 💸
Red circle = $1,165 exit 🔴
$AMZN 257.5C went from cheap premium to a full displacement trade.
But the real story is the ghost 👻 in the middle — the fear, the hold, the uncertainty.
Sometimes trading feels like taking a sensor into a new, often extreme environment: conditions change, and the readings go nonlinear fast.
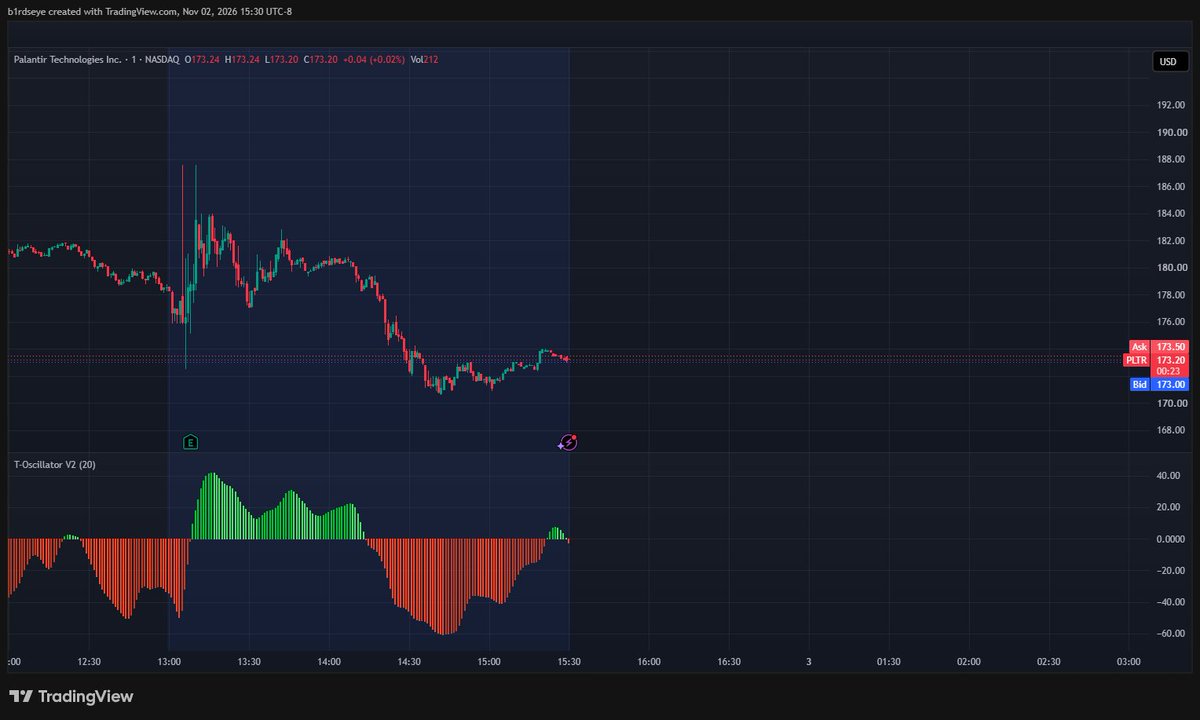
Palantir Q3 2026: Results and a Rough FCFE Estimate
Palantir reported Q3 2026 revenue of $2.31 billion, up 96% year over year and the first quarter above $2 billion. U.S. commercial revenue reached $984 million, up 148%, and surpassed U.S. government revenue for the first time. GAAP net income was $1.13 billion (49% margin), or $0.44 per diluted share. Operating cash flow was $1.21 billion and adjusted free cash flow was $1.22 billion (53% margin). The company ended the quarter with $10.4 billion in cash, equivalents, and U.S. Treasury securities.
Illustrative FCFE value: about $53 per share
Using trailing free cash flow to equity of roughly $1.61 per share, with a 9% cost of equity, 15% annual growth for five years, and 4% growth thereafter, a two-stage FCFE model gives an estimate of about $53. The inputs are approximate: trailing adjusted free cash flow of about $4.12 billion, divided by about 2.56 billion diluted shares.
The result is highly sensitive to these assumptions. It is well below where the stock has recently traded, which suggests the market is pricing in faster or longer growth than this model assumes. Stock-based compensation, the choice between adjusted and GAAP cash flow, and the company’s updated full-year guidance could each shift the estimate meaningfully.
Sources: Palantir Q3 2026 earnings release (SEC Form 8-K), Q2 2026 earnings release (SEC Form 8-K), Benzinga.
This is an educational estimate, not investment advice.
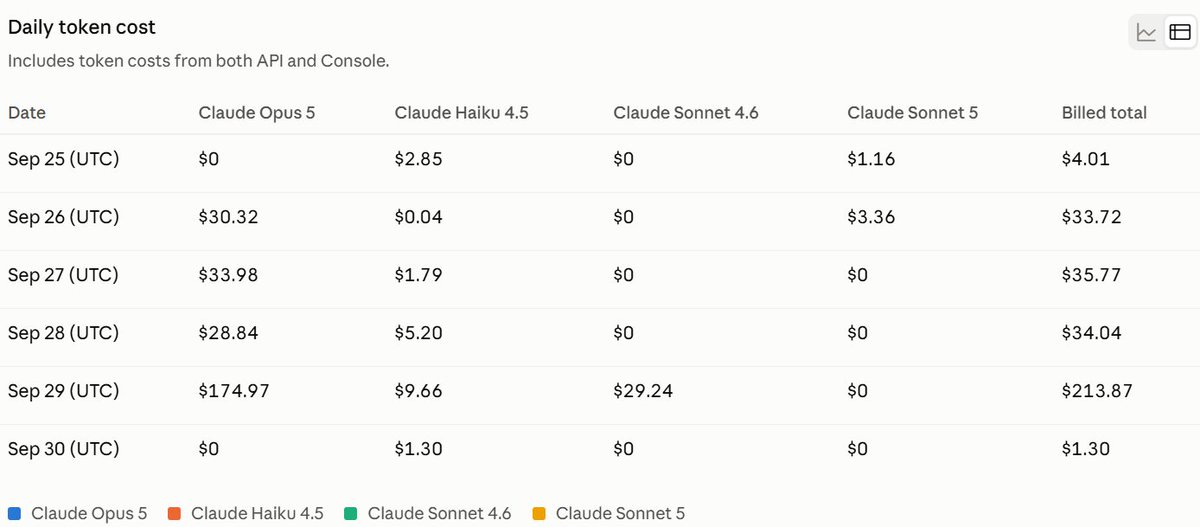
I've been using Haiku for intense multi day coding sessions. Having Claude recently default to Opus wrecked my LLM costs, all the more reason for setting alerts and limits on expensive frontier models.
A market can look stable in price while becoming unstable in state space.
This toy model shows probability density evolving inside a reshaping triple-well potential. The dark curve is the landscape (U(x)); the orange area is where probability mass actually resides.
The sequence is:
stability → erosion → splitting → escape → new regime
What matters is not only where the system is observed, but how the surrounding probability landscape is changing. A price can remain near the same level while its local basin becomes shallower, alternative states become more accessible, and transition probability rises.
That distinction—observed position ≠ latent system state—is increasingly useful for thinking about market regimes, volatility compression, Wyckoff phases, option pricing, and liquidity-driven phase transitions.
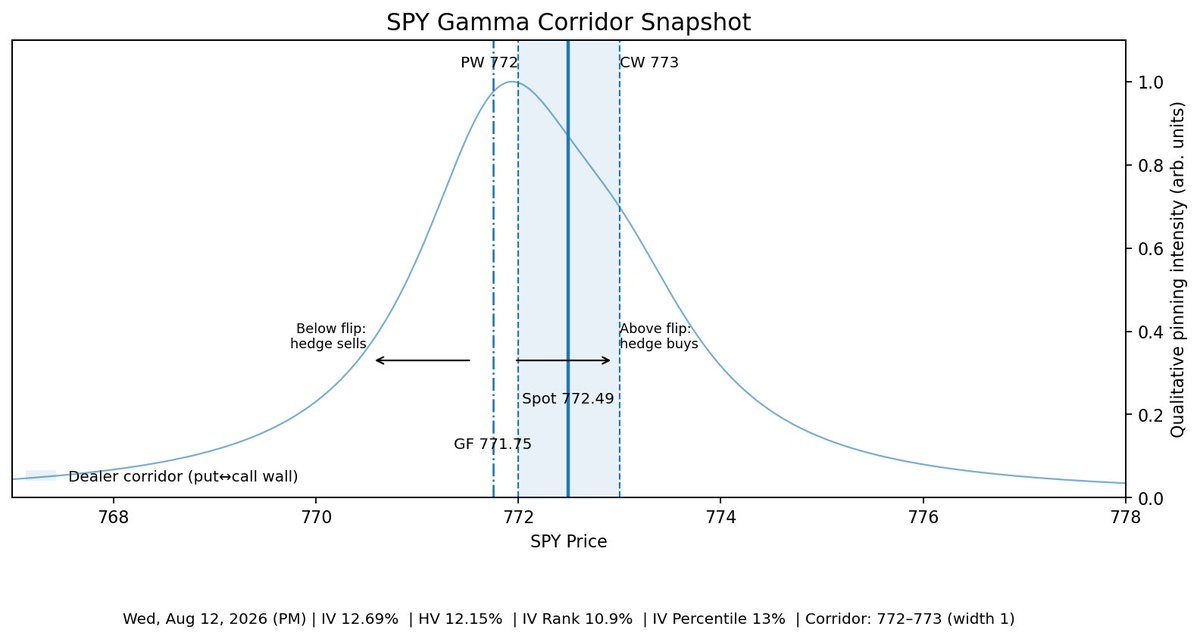
After last week’s rapid altitude gain, $SPY may be entering an acclimatization shelf: momentum is cooling, but the more important question is whether latent dip-buying appetite turns into measurable absorption before the 772–773 basin gives way.
$SPY finished inside an unusually tight 772–773 gamma corridor, with spot at 772.49 and the gamma flip just below at 771.75. IV remains subdued at 12.69%, only modestly above HV at 12.15%, so the structure still favors containment over expansion. The key technical question is simple: hold above the flip and the corridor can continue to dampen movement; lose 771.75 and dealer hedging dynamics become less stabilizing just as the one-point corridor starts to open.
$AAPL and $PLTR produced opposite lock transitions from the same basic architecture. AAPL failed to maintain the middle basin, crossed the lower gate, and settled into a lower regime—pressure equalization through downside migration. PLTR did the inverse: it held the middle basin, crossed the upper gate, and persisted above it, converting earnings repricing into a higher operating reservoir. The useful distinction is not simply “down versus up,” but whether spot merely touches a gate or survives transit long enough for the next basin to become persistent. In the river-lock model, direction is the visible outcome; successful regime settlement is the deeper signal.
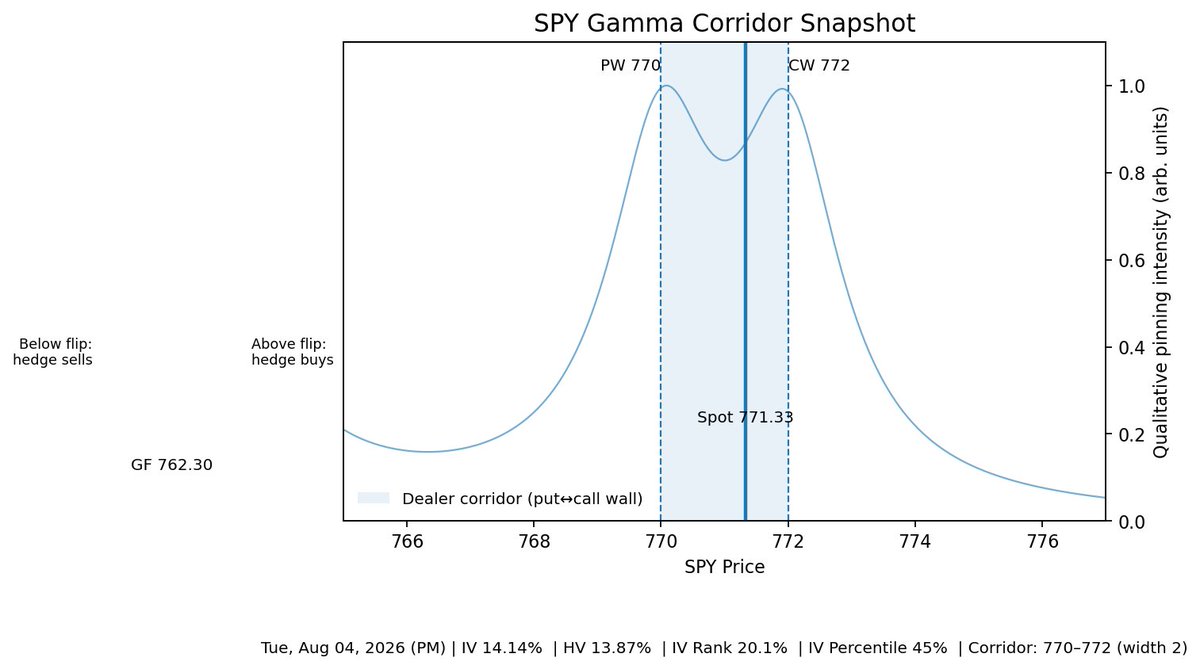
$SPY closed the session parked inside a much tighter 770–772 dealer corridor, with spot near 771.33, above the 762.30 gamma flip and just under the 772 call wall. IV at 14.14% remains only modestly above HV at 13.87%, so the tape still looks more like controlled drift than disorder. Structurally, 770 is now the key psychological and mechanical shelf: acceptance above 772 would favor continued upside release, while loss of 770 would suggest the rally is no longer cruising and may begin mean-reverting back toward deeper support.
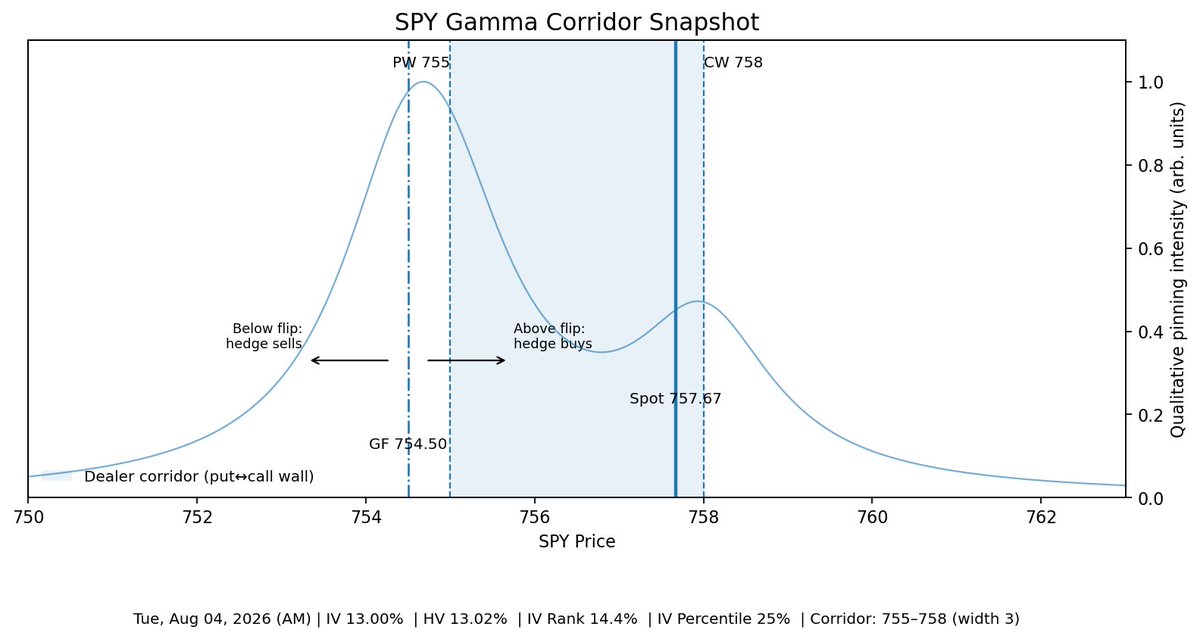
$SPY is opening inside a narrow 755–758 dealer corridor, with spot at 757.67, just beneath the call wall and above the 754.50 gamma flip. That places price in a contained, positive-hedging zone where dealer flows should dampen movement—until the corridor fails. With IV and HV at 13%, and IV rank still low, the market is pricing calm rather than rupture. The key bifurcation is clean: acceptance above 758 favors continued call-side drift, while loss of 755, especially below the flip, would convert compression into reflexive downside momentum.
Yesterday's $SPCX projection. Today's close landed near the model's median path. One result doesn't validate a model, but every replay is an opportunity to test whether the market is moving through the structure we've mapped—not just the price we expected.
$PLTR From testing $133 before the market open to settling at $125 by mid morning, Palantir experiencing wild swings prior to releasing its Aug 3 Q2 2026 earnings report.
El Infantino diciendo que la FIFA es el proveedor de la felicidad...
Y luego sale Trump diciendo "A menos que SU equipo pierda". (refiriéndose a Argentina)
Pinche Trump 😂
$SPCX once again exhibited a late-session execution transition. Throughout most of the day, cumulative volume delta evolved incrementally before entering a compressed selling regime near the close, producing a pronounced CVD discontinuity alongside a break below VWAP. Rather than viewing this as isolated price action, I find it useful to think in terms of execution windows: periods where liquidity conditions and order flow dynamics reorganize into a different operating regime. Price records the outcome; CVD reveals the transition.
Today's Option Flight Envelope shows a market with surprisingly low systemic stress despite several names operating far from dealer equilibrium. Most tickers remain clustered near the structural pin region, while a smaller group—including NVDA, LUNR, BKSY, and SMR—has transitioned into stable cruise rather than overload. The standout is PANW, carrying the highest localized load while remaining structurally close to its equilibrium point. Rather than a market moving as a single flock, today's snapshot looks partitioned into distinct flight regimes—pinned, transitioning, and cruising—revealing structure that price alone doesn't capture.