What if space exploration, orbital simulation, and geospatial intelligence could operate within a single, interconnected platform? 🛰️ 🛰️
What if anyone could explore the ISS, pilot inspection drones, execute crew missions, and analyze real world satellite imagery through an interactive 3D environment?
Orbio Station is building toward that vision. 📡
The platform combines an 18 module ISS reconstruction, orbital visualization, drone inspection workflows, AI assisted navigation, and wallet connected mission persistence.
Through Robinhood Chain, Orbio Station introduces onchain mapping bounties, enabling sponsors to fund geospatial analysis missions in ETH while contributors analyze historical satellite imagery, document environmental changes, and submit observations against predefined criteria.
$OBOS is launching.
0xdfd09ba073bf81a6fe7cbfca01ac6b76ed378faf
The next generation of spatial intelligence is taking shape through the convergence of orbital technology, autonomous systems, and onchain coordination.
Explore the ecosystem: https://t.co/MmbDOS2YAg
Could somebody find the same patch of Massachusetts from your description alone? Try that test on the Omaha floodplain: export a field report and give a friend the coordinates and source links. See whether they pick out the same change.
https://t.co/pvNoZwxkYu
Let’s take the scenic route across Massachusetts! 🛰️
Massachusetts ratified the U.S. Constitution on Feb. 6, 1788, becoming the sixth state. As America marks 250 years, the Bay State comes into view in our America from Space journey.
Though the seventh-smallest state by land area, Massachusetts is home to about 7 million people, more than 1,500 miles of coastline, and forests covering roughly 60 percent of the state. That mix gives Landsat three very different stories to tell.
First stop: Cape Cod. The state’s coastline has long supported fishing, maritime trade, and tourism. Wind, waves, and storms continually reshape the Cape’s beaches and barrier islands. Long-term Landsat imagery helps researchers track shoreline movement, breaches, and other coastal changes—information that can support coastal management.
Next: Boston and Cambridge. Boston has more than 18,000 people per square mile, and urban heat hotspots can increase health risks. Buildings and pavements can have higher land surface temperatures than trees, parks, and water. Landsat’s thermal observations can map those differences and help identify hotspots. Cambridge used Landsat data to help develop an urban heat island model that informed its 2021 Resilient Cambridge Plan.
Farther west, October Mountain State Forest brings Massachusetts’ forests into view. Forests play an important role in storing carbon. As Massachusetts developed its decarbonization plan, Landsat land-cover data helped researchers’ model how forest growth, development, and tree harvesting could affect future carbon storage.
🔗 Continue the scenic route from space. Explore the Massachusetts State Mosaic: https://t.co/rkZFmhIWfM
📸1: A Landsat 9 image of Cape Cod and surrounding coastal waters. Acquired September 12, 2026.
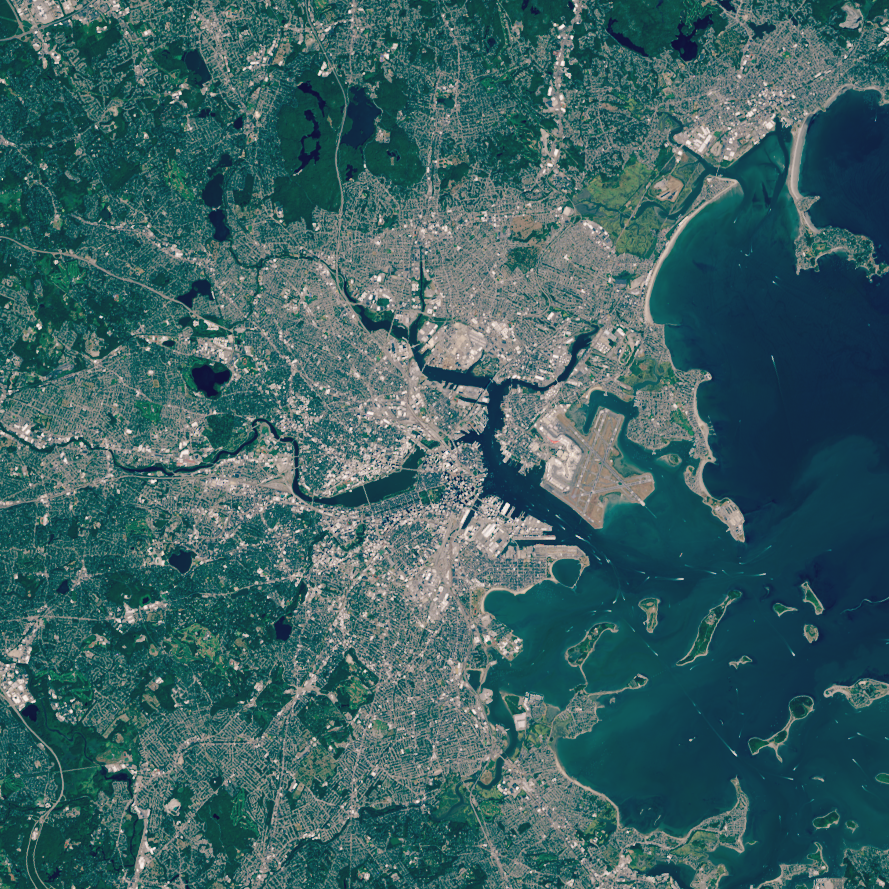
📸2: A Landsat 9 image of Boston, Cambridge, Boston Harbor, and surrounding communities. Acquired August 31, 2025.
📸3: A Landsat 9 image of October Mountain State Forest in western Massachusetts. Sun glint is visible on several ponds across the forested landscape. Acquired June 13, 2026.
Credit: USGS
#AmericaFromSpace #America250 #TheBayState
The people who know how an instrument works bring something different from the people who know the landscape. When reviewing a mapping mission, we like asking both: what can the sensor resolve, and what local detail would change your reading?
https://t.co/2bqz2fDW1v
What does it take to build the next generation of Earth observation? 🛰️
Meet the 2026-2030 Landsat Science Team, a group of experts from universities, private industry, and federal and international agencies who advise on the science behind the Landsat program.
The team provides analysis and guidance on priority issues like atmospheric correction and calibration, agriculture and vegetation monitoring, snow and aquatic systems, wildland fires, volcanoes and geothermal systems, and more. The team’s work helps guide Landsat 10, planned to launch in 2031. The new satellite will carry 26 spectral bands and feature enhanced resolution, continuing a 54-year legacy of Earth observation.
Here's a look at what some of our scientists are working toward:
🌽 Tracking exactly how much water crops are using—helping farmers irrigate more efficiently
🔥 Mapping dead and dying vegetation to monitor fire danger and tree mortality
💧 Helping satellites detect harmful algal blooms before they become dangerous
❄️ Improving how we track snow cover in the western U.S.—a critical piece of the nation’s water supply
The Landsat science team provides a key advisory role in making sure the program continues to serve farmers, land and water managers, scientists and communities for decades to come.
🔗Learn more about the team: https://t.co/quxWIllzln
📸: The 2026-2030 Landsat Science Team gathered at USGS National Center in Reston, Virginia, October 2026. Credit: USGS
#LandsatScienceTeam #Landsat10
Follow the Landsat ground tracks here, then open the orbit map in Orbio Station. Try tracing one pass with your finger. An orbital path makes it much easier to picture why a sensor sees one strip of Earth at a time.
https://t.co/TJIJFlLG6z
For Landsat 8 and Landsat 9, every week is space week. 🛰️🌎
This World Space Week, take a spin with Landsat 8 and Landsat 9 as the satellites follow their paths around our planet.
Both satellites travel about 438 miles above Earth in sun-synchronous, near-polar orbits. Each completes one orbit around Earth in about 99 minutes. As Earth rotates beneath them, the satellites observe a different strip of Earth’s surface with each pass.
Each satellite returns to the same “start” or ground path every 16 days. Landsat 8 and Landsat 9 provide complete coverage of Earth’s land surfaces every eight days because their orbital cycles are offset by that many days.
Along the way, each satellite collects about 750 scenes per day, building a detailed record of how Earth’s land surfaces change over time. That’s one busy pair of Earth observers.
🎥: A sped-up animation showing Landsat 8, represented in blue, and Landsat 9, represented in green, orbiting Earth. Credit: USGS
#WorldSpaceWeek #Landsat #EarthFromSpace
Oregon’s wildfire sequence suggests a good question for anyone writing a mapping brief: do you need the footprint on one date, or how it grew? Tell the analyst up front so they can choose the right scenes.
https://t.co/4Wao8CUN0E
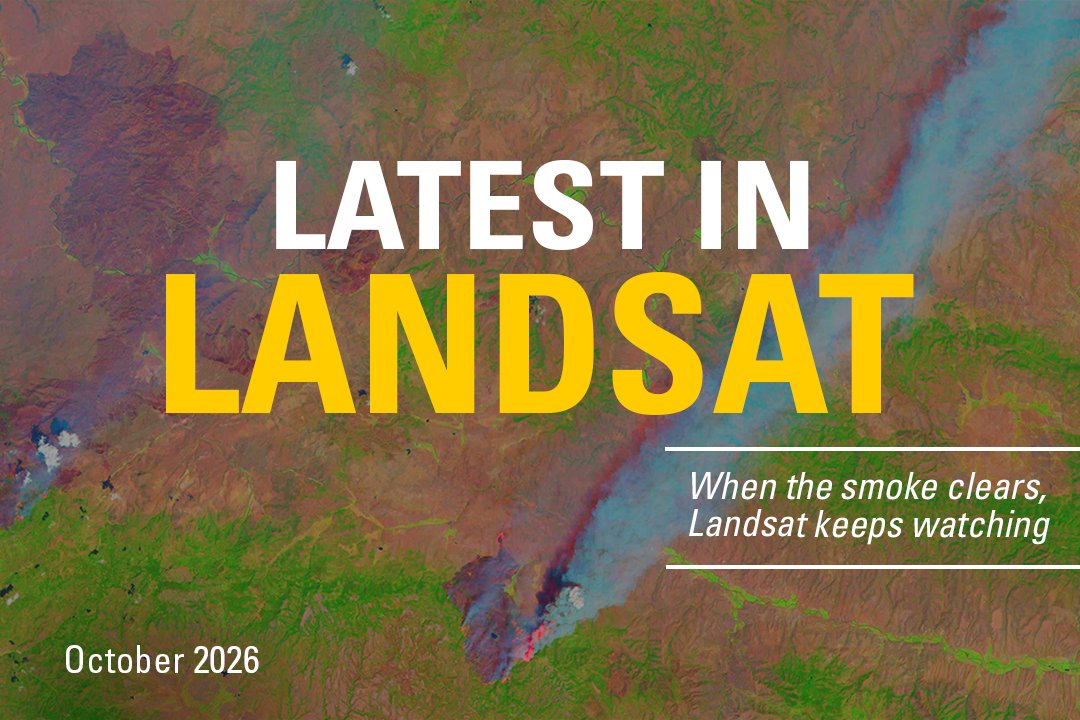
What’s new with Landsat this October? 🛰️
This month’s issue starts in north-central Oregon, where Landsat captured the progression and aftermath of summer wildfires.
Also in this issue:
🔹 Learn how Landsat data help support water management worldwide
🔹 Get the latest on reprocessed Landsat 2 and Landsat 3 MSS Level-1 products
🔹 Learn how Amazon SNS topics can keep you updated when new Landsat data and science products are added to the USGS EROS archive
🔹 Continue celebrating America’s 250th anniversary with Landsat views from across the country
🔗 https://t.co/URSG24MOQt
📸: Landsat 8 image showing active fire fronts and large smoke plumes as the fires spread across the landscape. Credit: USGS
#LatestInLandsat #Landsat #EarthObservation
Which bands made this image? It’s a useful question as Landsat prepares its next instrument. In our Omaha survey you’re looking at Terra MODIS bands 7, 2 and 1. The dark patches along the river are where we’d start looking for water.
https://t.co/fka0psKpGa
A sharper view of our changing planet is coming. 🛰️🌎
Meet LandIS, the Landsat Instrument Suite that will fly aboard Landsat 10, the next satellite in the Landsat series.
With 26 spectral bands spanning visible light to thermal infrared, LandIS will collect more than twice as many bands as Landsat 8 and Landsat 9. These additional bands will help users better distinguish features on Earth’s surface and monitor water quality, agriculture, vegetation health, snow and ice, soil conditions, and other environmental parameters.
LandIS will also capture finer spatial detail, with resolutions of 10 to 20 meters for visible, near-infrared, and shortwave-infrared observations. That means a clearer view of smaller features, including streams, streamside habitats, woodlots, and individual agricultural fields.
Together, more spectral bands and finer spatial resolution will help users detect, distinguish, and track environmental change with greater detail and precision.
Expected to begin operations in the early 2030s, LandIS will also continue Landsat’s coverage of sunlit land and near-shore waters, along with select nighttime observations. It will also uphold the program’s high standards for data accuracy, extending a record of Earth observations that spans more than 54 years.
Learn more about Landsat 10 and its planned capabilities: https://t.co/mrBwF9Zaqe
📷: A visual comparison of spatial resolution showing the 30-meter pixels of Landsat 8 and 9 (left) alongside the finer, more detailed 10-meter pixels planned for Landsat 10 (right). Credit: NASA
Even a 45-letter lake name won’t tell a reviewer which shore you mean. In the Omaha mission, click the exact spot: Orbio Station places the marker at the same coordinates in both images.
https://t.co/dFkTmlKLDM
Can you pronounce this lake's name on the first try? 👀
Meet Lake Chargoggagoggmanchauggagoggchaubunagungamaugg. Yes, that's 45 letters, and yes, it's real. Tucked in Webster, Massachusetts, it's widely considered one of the longest place names in the United States.
In this Landsat image, you can see its three connected sections, North, Middle, and South Pond, linked by narrow channels, with the town of Webster right along its western shore.
Here's a fun myth: the lake’s name is often said to mean "You fish on your side, I fish on mine, nobody fishes in the middle." It’s a great story, but the translation was popularized as a hoax by a newspaper editor in the 1920s. The name has roots in the Indigenous Nipmuc language, though its precise original meaning remains debated. One interpretation of Chaubunagungamaug connects it to a fishing place at a boundary.
Formed by retreating glaciers at the end of the last Ice Age, it's the largest natural lake in Massachusetts. At just 3.25 miles long, it's easier to swim across than it is to say its own name. From orbit, Landsat captures the whole thing in a single pass, no tongue-twisters required.
Want to explore this lake, or anywhere else on Earth, for yourself? Search Landsat imagery on EarthExplorer: https://t.co/amwk0IkbjV
📸: Landsat 9 image of Lake Chargoggagoggmanchauggagoggchaubunagungamaugg in Webster, Massachusetts, showing its three connected ponds and the surrounding town. Credit: USGS Landsat image acquired October 12, 2026.
#USGSEROS #EarthExplorer
Mount St. Helens left a record far downstream. For a river survey, we’d start with one dated observation at a bend, then ask someone upstream to check theirs. Two pins make a much better conversation than “the river looks different.”
https://t.co/zwOiJpHtTS
The eruption lasted hours. Its effects on rivers and ecosystems are still showing up more than 40 years later. 🌋
When Mount St. Helens erupted, it sent a massive wave of mud, water, and debris downstream, overwhelming the Toutle, Cowlitz, and Columbia Rivers with sediment. Parts of the Columbia Riverbed rose by nearly 30 feet.
The rivers never fully reset. Today, some still carry sediment at rates tens of times higher than before the eruption, creating ongoing challenges for flood protection and fisheries.
The land tells a different story, and it's one that genuinely surprised scientists. Before 1980, experts assumed the blast zone would take generations to recover.
Instead, life came back much faster than predicted. Because the devastation wasn't uniform, pockets of surviving plants and animals became the seeds of entirely new habitats. Today, the diversity of life at Mount St. Helens exceeds what existed before the eruption.
That discovery changed how scientists study recovery after disasters, not just at volcanoes, but after wildfires, floods, and other events worldwide.
In 1982, Congress established the Mount St. Helens National Volcanic Monument, protecting 110,000 acres around the volcano as a living laboratory for studying long-term change.
Landsat has been part of that story from the start, capturing land change recovery one pixel at a time for more than 40 years.
Want to learn more? Explore 10 ways the Mount St. Helens eruption changed our world 👉 https://t.co/eD9PgbHgmx
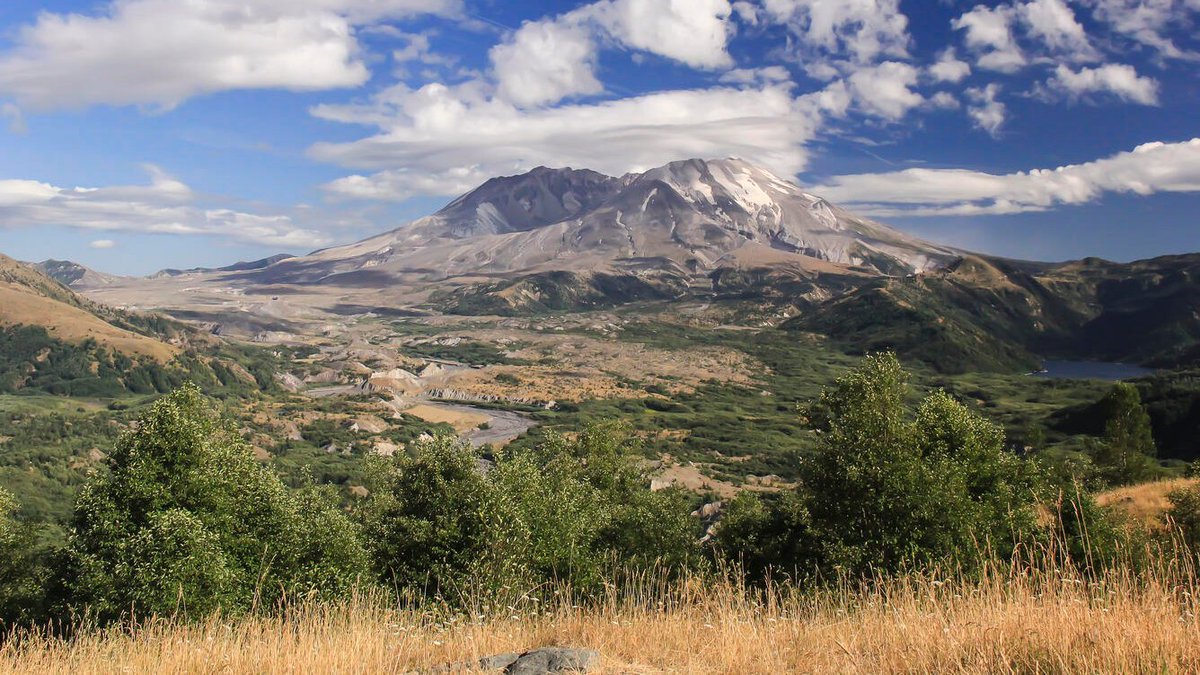
📸1: Mount St. Helens, as viewed from the Castle Lake Overlook
📸2: Landsat 9 image, acquired August 26, 2024, showing Mount St. Helens and the surrounding landscape. Shades of red and pink highlight vegetation regrowth, while the volcano’s north-facing crater and lakes formed by the eruption remain visible.
Credit: USGS
#EarthScienceWeek #MountStHelens #Landsat
If the two images were slightly out of alignment, a riverbank could appear to move. Before marking a change in Omaha, find a nearby feature that stays put in both frames. It makes a handy reference point.
https://t.co/G6XAtJO68U
🛰️ How do we know Landsat's satellites are still seeing Earth accurately after years in orbit?
We check. Constantly.
The USGS EROS Cal/Val Center of Excellence (ECCOE) Team, working alongside NASA counterparts, continually monitors the geometric and radiometric performance of all active Landsat missions. That means asking questions such as: Are the pixels lining up correctly on the ground? Is the sensor reading brightness and reflectance values accurately?
When something drifts, they recalibrate. Findings are compiled into quarterly reports, creating a running, public record of satellite health going back years.
It's quiet, behind-the-scenes work, but it's a big reason scientists, land managers, and researchers around the world trust Landsat's 54-year data record enough to build their work on it.
Landsat Calibration/Validation is the Gold Standard for Earth Observation!
Read the latest quarterly: https://t.co/N36FN2YZIl
📸: Landsat 9 image of Railroad Valley Playa, Nevada, acquired July 2024. A portion of the playa is used as a vicarious radiometric calibration and validation site for various satellite sensors.
Try tracing the South Carolina shoreline before reading the place names. Which inlet would you recognize from another angle? That’s a good challenge to set a friend when you share a Cupola photo from Orbio Station.
https://t.co/GhJuWd64WT
More than 100 waterfalls. 187 miles of coastline. Welcome to South Carolina. 🛰️
South Carolina became the eighth state to ratify the Constitution on May 23, 1788. Nearly 240 years later, the Palmetto State is the next stop on our journey across America from space.
Home to more than 5 million people, South Carolina stretches from the Blue Ridge Mountains in the Upstate down to the Lowcountry, where 35 barrier islands line the coast. That range shows up in what lives here too: more than 100 tree species, including the palmetto that gives the state its nickname, and wildlife from black bears and alligators to bottlenose dolphins offshore.
Forests cover two-thirds of South Carolina making it the state's leading industry. Loblolly pine and oak, much privately owned, contribute $21 billion to the economy through pulp, paper, and logging. The state’s Forestry Commission uses Landsat data to track its forest change.
Those forests climb into the Blue Ridge Mountains, feeding more than 100 waterfalls as rivers begin their journey downstream. Landsat data feed South Carolina's Watershed Atlas—helping managers track water quality as it moves toward the coast.
Near Charleston, tidal creeks and marshes buffer the shoreline where those waters eventually arrive. Low elevation leaves the coast vulnerable to hurricanes and flooding with sea-level rise a growing concern. Landsat’s view from space has tracked those changes for more than 5 decades now.
🔗 Want a closer look? Explore South Carolina's full story: https://t.co/vYcLQuJpHw
📸1: A Landsat 8 image of the Francis Marion and Sumter National Forest near Monticello Reservoir in north-central South Carolina. Acquired October 16, 2026.
📸2: A Landsat 8 image of the Blue Ridge Mountains in South Carolina's Upstate, showing forested mountain terrain with Lake Jocassee and Lake Keowee visible. Acquired October 23, 2026.
📸3: A Landsat 8 image of the Charleston, South Carolina, area, showing a river winding through forested land and tidal marsh before reaching the Atlantic coast. Acquired June 3, 2026.
Credit: USGS
#AmericaFromSpace #America250 #ThePalmettoState
A thermal sensor can help estimate how much water a field uses. Our Omaha survey asks a different water question: where did the river spread? Pick a bend and compare its outline on May 30 and June 27, 2011.
https://t.co/G7JvJPhdab
Exactly how much water is my crop using? 🌽🛰️
Landsat's thermal instruments detect land surface temperature. Crops cool the land as they "sweat" through evapotranspiration (ET), and that temperature data helps scientists estimate how much water crops are using, field by field.
Today, U.S. farmers and water managers use Landsat data to help decide when to irrigate, how much water is needed, whether a field is showing signs of water stress, and how to meet water use reporting requirements.
With water scarcity a growing concern in many parts of the country, OpenET, a Landsat-based project, provides this kind of precise, satellite-based data to help people use water more efficiently.
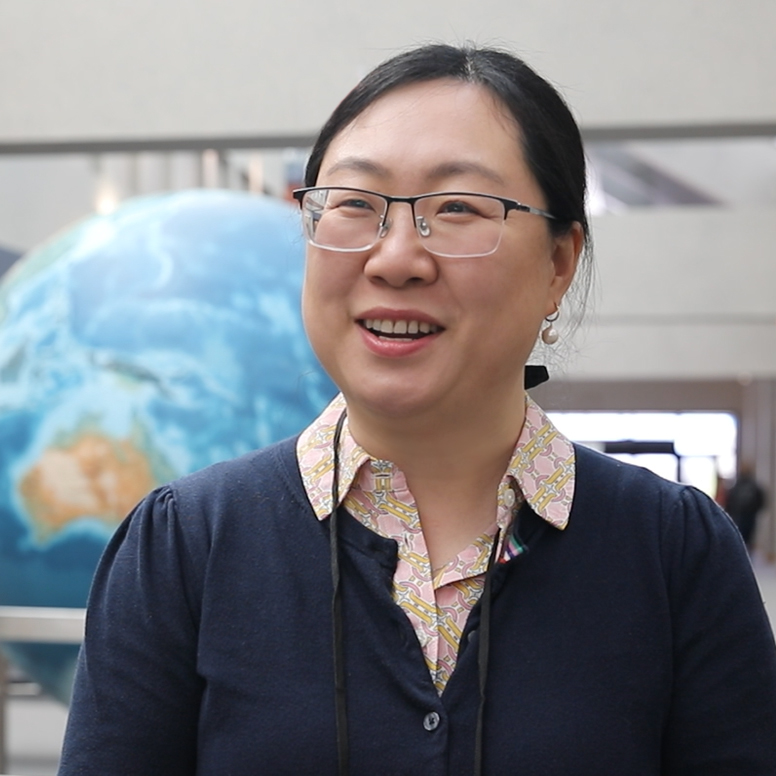
Scientists on the Landsat Science Team are working to make these estimates even more accurate and useful. Among them is Yun Yang, a Cornell assistant professor whose research focuses on improving evapotranspiration monitoring and helping farmers make more informed water management decisions.
"Landsat is the gold standard for ET estimation," Yang said.
By improving ET estimates, researchers hope to give farmers an even clearer picture of how much water their fields need, helping them make more informed decisions about irrigation and water management.
Read Yang's full story: https://t.co/TVDWV9rmX7
📸1: Landsat 8 captured this image of center-pivot irrigated fields in southwestern Kansas on August 24, 2026. The town of Garden City is in the upper right quadrant of the image. Landsat satellites provide a key source of data for estimating evapotranspiration.
📸2: Yun Yang, member of the Landsat Science Team.
Credit: USGS
#LandsatScienceTeam #Landsat10
A cat-shaped lake is a good reminder of how quickly we see familiar shapes from orbit. Try the same game in the Orbio Station Cupola: save a shot, share its gallery link, and ask someone else what they see before telling them your answer.
https://t.co/x6smKfulg3
Earth is ready for Halloween 🎃
Whether it’s a cat-shaped lake or an iceberg-shaped coffin, a ghostly face in the rocks or an aurora reminiscent of a bubbling cauldron, our planet is decorated for spooky season! 🐈⬛⚰️👻🧙
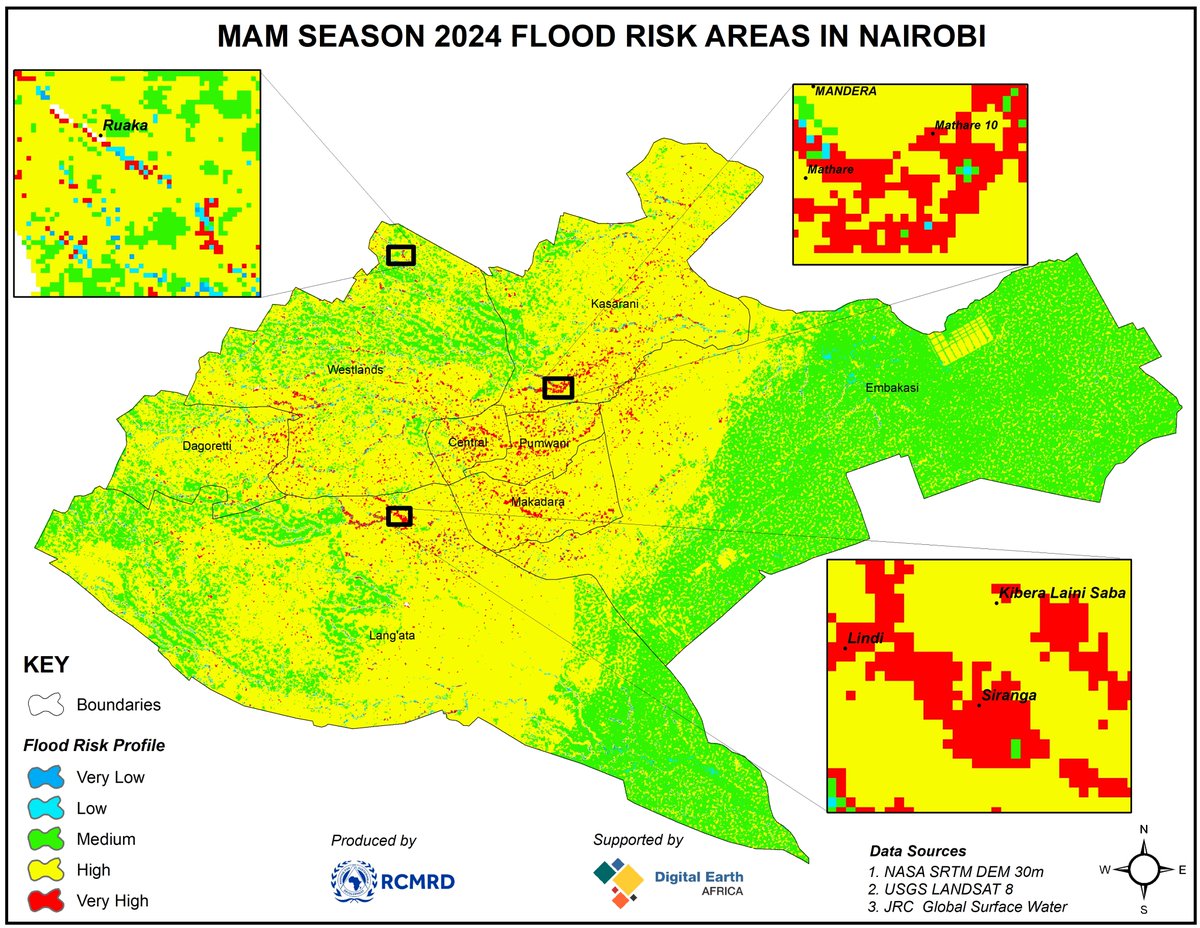
The Nairobi team combined imagery, elevation and surface-water history to study flood risk. In our Omaha case, try writing one sentence about the water you can see and a second naming the extra data you’d request before assessing risk.
https://t.co/PTh8MpUcTg
@DEarthAfrica & RCMRD are using #EarthObservation data to map #flood-risk areas in Nairobi County, Kenya, for the March-May long rains, leveraging #Landsat 8 data, elevation data from NASA SRTM DEM at 30 metres & the EU Joint Research Centre's Global Surface Water dataset.
What happens after a spacewalk? Cleanup and maintenance still need a place on the crew schedule. In Orbio Station, give your own inspection a proper finish: return the drone to its dock after the scan.
https://t.co/eFNJ0TRFVy
Expedition 75 cleaned up after a spacewalk, conducted biomedical assessments, and maintained lab systems wrapping up a busy week aboard the International Space Station. More... https://t.co/ROMyn6pLQx
NASA astronaut Anil Menon rides the Canadarm2 robotic arm 260 miles above Earth while carrying a roll-out solar array during Thursday's spacewalk.
Quick question for the crew 👇
First thing you do aboard Orbio Station:
🛸 Fly the inspection drone
🌍 Watch Earth from orbit
📡 Chase the lost signal
🛰️ Explore every deck
https://t.co/PLuQFkBV9h
A sunlight measurement starts long before a satellite reaches orbit. The team tests the hardware first. When you export an Omaha observation from Orbio Station, the report keeps the instrument name and source links so another reader can trace the measurement.
https://t.co/RQrIbCs25u
How does a satellite study for launch? 📝 It takes tests!
TSIS-2, NASA’s upcoming sunlight-measuring satellite, passed its latest tests. They brought the satellite to freezing temperatures and vacuum pressures, and through launch-like vibrations.
https://t.co/mSiGKkT76W
The dates are part of the finding. This forest study spans decades. Our Omaha case spans four weeks. If you pass a map to someone else, include the observation window so they know exactly what changed between which dates.
https://t.co/4eqcCXN5aK
According to a new study analyzing nearly 30 years of #Landsat data, Haiti lost nearly half of its primary, old-growth forests between 1996 and 2022.
These forests are crucial for biodiversity and carbon storage.
Earth photography made it onto the crew’s shift alongside sample work. Our favorite way to end a shift in Orbio Station: head to the Cupola, wait for a coastline to clear the window frame, then save the shot to your mission gallery.
https://t.co/Idkeg517zt
Expedition 75 started the week processing microbe samples and swapping spacesuits for return to Earth inside a @SpaceX Dragon cargo spacecraft. Breathing in microgravity and Earth photography rounded out the shift. More... https://t.co/e0M4WgjYhw
$OBOS is the token behind Orbio Station, live on the Pons Family launchpad. 🪐
The station is open. The drone is fueled. Earth is waiting outside the Cupola.
https://t.co/PLuQFkCsYP
Congrats to the Singapore teams. For builders comparing notes on Robinhood Chain, here’s one design choice from Orbio Station: assign the analyst when the sponsor funds a mission, so both parties know which wallet can submit the report.
https://t.co/hETmuquapk
Microbiology, spacesuits and cargo all made the crew’s Tuesday list. In Orbio Station, try starting a crew shift with one practical question for Orbio: “Which tool do I need, and where do I pick it up?”
https://t.co/C8hZaN8cGb